The Gold Standard Challenge: Why and How to Benchmark Novel Receptor Assays Against Established Methods
This article provides a comprehensive guide for researchers and drug development professionals on benchmarking novel receptor assays against established gold standards.
The Gold Standard Challenge: Why and How to Benchmark Novel Receptor Assays Against Established Methods
Abstract
This article provides a comprehensive guide for researchers and drug development professionals on benchmarking novel receptor assays against established gold standards. We explore the fundamental importance of these comparisons, detailing current methodologies (e.g., radioligand binding, SPR) and their applications in drug discovery. We offer troubleshooting strategies for common experimental discrepancies and systematic validation frameworks. By synthesizing comparative data interpretation, the article establishes a clear pathway for validating new assays, ensuring robust, reproducible, and translatable results in biomedical research.
Defining the Gold Standard in Receptor Assays: Why Benchmarking is Non-Negotiable in Drug Discovery
What Constitutes a 'Gold Standard' Assay? Historical Context and Core Principles
Historical Context and Definition
The term "gold standard" in assay development originates from clinical diagnostics, where it referred to the most accurate test available, often invasive or expensive, against which new methods are benchmarked. In receptor pharmacology and drug discovery, this concept evolved through pivotal methodologies. The radioligand binding assay (RBA), developed in the 1970s, became the first widely accepted gold standard for directly measuring receptor-ligand affinity (Kd) and density (Bmax). Its dominance was rooted in its directness, sensitivity, and quantitative rigor.
Core Principles of a Gold Standard Assay
A contemporary gold standard assay is defined by four core principles:
- High Specificity & Sensitivity: Unambiguously measures the target interaction with minimal background noise.
- Quantitative Accuracy & Precision: Yields reproducible, absolute values (e.g., Kd, Ki, EC50) with low error.
- Broad Acceptance & Validation: Extensively cited, peer-reviewed, and serves as the definitive reference method in the field.
- Mechanistic Directness: Measures the primary event of interest (e.g., binding, functional activation) with minimal inferential steps.
Comparative Analysis of Receptor Assay Platforms
The following table compares key assay types used for receptor characterization, benchmarking their performance against the historical gold standard (Radioligand Binding) for specific parameters.
Table 1: Benchmarking Receptor Assay Platforms
| Assay Platform | Measured Parameter | Throughput | Key Advantage vs. RBA | Key Limitation vs. RBA | Typical Use Case |
|---|---|---|---|---|---|
| Radioligand Binding (RBA) | Affinity (Kd/Ki), Receptor Density (Bmax) | Low | Direct, label-free measurement; Absolute quantification. | Radioactivity use; No functional data. | Gold Standard for binding kinetics & affinity. |
| Surface Plasmon Resonance (SPR) | Binding Kinetics (kon, koff), Affinity (KD) | Medium-High | Real-time, kinetic data; No labeling required. | Requires chip immobilization; Can be cost-prohibitive. | Kinetic profiling of ligand-receptor interactions. |
| Fluorescence Polarization (FP) | Affinity (Kd/Ki) | High | Homogeneous ("mix-and-read"); High throughput. | Requires fluorescent ligand; Signal can be size-limited. | High-throughput screening for competitive binders. |
| BRET/FRET (Biolum./Fluor. Resonance Energy Transfer) | Conformational change, Protein-Protein Interaction | Medium | Cell-based, proximity-based signal; Highly specific. | Requires genetic fusion of tags; Optimization intensive. | Measuring dimerization or intracellular signaling events. |
| cAMP Accumulation / Ca2+ Mobilization (Functional) | Functional Efficacy (EC50, IC50, Emax) | Medium-High | Measures downstream pathway activation; Agonist/antagonist characterization. | Indirect measure; Subject to system bias (e.g., receptor reserve). | Gold Standard for G-protein-coupled receptor (GPCR) functionality. |
Experimental Protocol: Radioligand Binding Assay (Competition)
This protocol is a core methodology for establishing binding affinity of unlabeled compounds.
1. Objective: Determine the inhibitory constant (Ki) of a test compound by competing it against a fixed concentration of a known radioligand for a specific receptor.
2. Key Reagents & Materials:
- Membrane preparation containing the target receptor.
- Radioactively labeled ligand (e.g., [³H]- or [¹²⁵I]-) with known high affinity.
- Test compounds at varying concentrations (typically 10-12 concentrations in a dilution series).
- Non-specific binding (NSB) determinant: a high concentration of a known potent unlabeled ligand.
- Assay Buffer (e.g., Tris-HCl or HEPES, with ions like Mg2+ to stabilize receptor state).
- Filtration apparatus (cell harvester) and GF/B or GF/C glass fiber filters.
- Scintillation counter or gamma counter.
3. Procedure: 1. Dilute membrane preparation in ice-cold assay buffer. 2. In a 96-well plate, add: * Total Binding (TB) Wells: Buffer, membranes, radioligand. * Non-Specific Binding (NSB) Wells: Buffer, membranes, radioligand, excess unlabeled ligand. * Competition Wells: Buffer, membranes, radioligand, serial dilutions of test compound. 3. Incubate to equilibrium (determined empirically, often 60-120 min at room temp or 4°C). 4. Terminate reaction by rapid vacuum filtration through pre-soaked (e.g., in 0.3% PEI) glass fiber filters to separate bound from free radioligand. 5. Wash filters 3-4 times with ice-cold buffer. 6. Transfer filters to vials, add scintillation cocktail, and quantify bound radioactivity (DPM or CPM).
4. Data Analysis: * Calculate specific binding for each well: SB = TB - NSB. * Fit the competition curve (Specific Binding % vs. log[Test Compound]) using a four-parameter logistic (4PL) model to determine the IC50. * Calculate the Ki using the Cheng-Prusoff equation: Ki = IC50 / (1 + [L]/Kd), where [L] is the radioligand concentration and Kd is its dissociation constant.
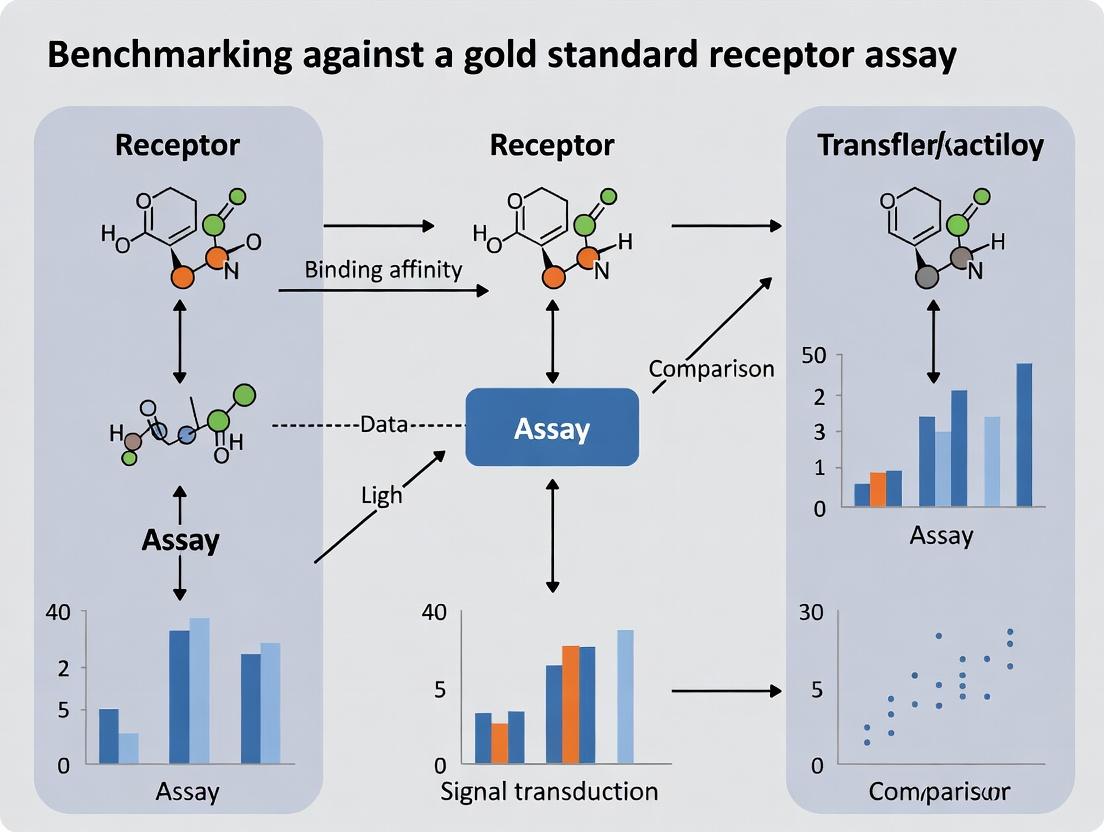
Visualizing Key Concepts
Title: Gold Standard Validation & Benchmarking Workflow
Title: Radioligand Competition Binding Protocol
The Scientist's Toolkit: Key Research Reagents & Materials
Table 2: Essential Reagents for Gold Standard Receptor Binding Studies
| Item | Function & Importance |
|---|---|
| Purified Receptor Membrane Preparation | Source of the target protein. Quality (receptor density, purity) is the single most critical factor for a robust assay. |
| High-Affinity Radioligand (Hot Ligand) | The detectable probe. Must have high specific activity, known Kd, and high selectivity for the target receptor. |
| Reference Pharmacological Agent (Cold Ligand) | A well-characterized, high-potency compound used to define non-specific binding and validate the assay system. |
| Assay Buffer with Ionic Cofactors | Maintains physiological pH and includes ions (e.g., Mg2+) that stabilize receptor conformation for optimal ligand binding. |
| Glass Fiber Filter Plates (GF/B/C) | For rapid separation of bound ligand-receptor complex from unbound ligand during vacuum filtration. |
| Polyethylenimine (PEI) or BSA | Used to pre-soak filters to minimize non-specific binding of the radioligand to the filter itself. |
| Scintillation Cocktail (for ³H/¹⁴C) or Gamma Counter | Essential for detecting and quantifying the amount of bound radioligand after filtration. |
| Microplate Scintillation & Luminescence Counter | Enables high-throughput reading of 96- or 384-well filtration plates, integrating data collection. |
Within the broader thesis on benchmarking against gold standard receptor assays, the selection of an appropriate assay platform is foundational. Receptor assays are critical for quantifying ligand-receptor interactions, characterizing pharmacological profiles, and determining functional cellular responses. This guide objectively compares the performance, applications, and technical considerations of four primary assay categories: Radioligand Binding, Functional Assays (e.g., cAMP, Ca2+ mobilization), Surface Plasmon Resonance / Biolayer Interferometry (SPR/BLI), and Enzyme-Linked Immunosorbent Assays (ELISAs). Data is derived from current literature and manufacturer benchmarks.
Comparative Performance Analysis
Table 1: Key Performance Metrics Across Receptor Assay Types
| Parameter | Radioligand Binding | Functional (cAMP/Ca2+) | SPR/BLI | ELISAs |
|---|---|---|---|---|
| Primary Measurement | Direct binding affinity (Kd, Ki) | Functional efficacy/potency (EC50, IC50) | Binding kinetics (ka, kd, KD) | Quantification of analyte concentration |
| Throughput | Low to Medium | High (plate-based) | Low to Medium | High |
| Information Depth | Affinity, receptor density (Bmax) | Signaling pathway activation/ inhibition | Real-time kinetics, affinity | Total protein/phosphoprotein levels |
| Label Requirement | Radioisotope (e.g., ³H, ¹²⁵I) | Fluorescent/Luminescent probe | Label-free (direct) | Enzyme-linked antibody |
| Assay Time | Hours to a day | Minutes to hours (live-cell) | Minutes to hours | Several hours |
| Gold Standard For | Binding affinity & occupancy | Functional pharmacology & pathway analysis | In-vitro kinetic characterization | End-point quantitative analysis |
| Key Limitation | Hazardous waste, no kinetics | Pathway-specific, indirect measurement | Requires protein immobilization, may not reflect native membrane environment | End-point only, no kinetics or real-time data |
Table 2: Typical Experimental Data from Benchmarking Studies
| Assay Type | Target (Example) | Reported KD/EC50 (nM) | Z'-Factor | Key Benchmark |
|---|---|---|---|---|
| Radioligand Binding | β2-adrenergic receptor | 1.2 ± 0.3 (Antagonist) | 0.6 - 0.8 | High sensitivity for low-abundance receptors |
| Functional (cAMP) | GPCR (Gs-coupled) | 5.4 ± 1.1 (Agonist) | 0.7 - 0.9 | Excellent correlation with physiological response |
| SPR (Biacore) | mAb:Antigen Interaction | 0.8 ± 0.2 | N/A | Direct ka (1-5 x 10⁵ M⁻¹s⁻¹) and kd (1 x 10⁻³ s⁻¹) measurement |
| ELISA (Phospho-ERK) | EGFR Signaling | N/A (Quantitative) | 0.5 - 0.7 | High specificity, linear range 15.6-1000 pg/mL |
Detailed Experimental Protocols
Radioligand Binding Assay (Competition Saturation)
Objective: Determine inhibitor affinity (Ki) and receptor density.
- Membrane Preparation: Isolate cell membranes expressing target receptor via homogenization and centrifugation.
- Incubation: In a 96-well plate, incubate membranes with a fixed concentration of radioligand (e.g., ³H-Naloxone for opioid receptors) and increasing concentrations of unlabeled competitor. Include wells for total binding (no competitor) and nonspecific binding (excess cold ligand).
- Separation: Terminate reaction by rapid filtration through GF/B filter plates. Wash plates 3x with ice-cold buffer to separate bound from free ligand.
- Detection: Dry filters, add scintillation cocktail, and count radioactivity (Counts Per Minute, CPM) on a microplate scintillation counter.
- Analysis: Fit data (e.g., using GraphPad Prism) with a one-site competition model to derive IC50, then calculate Ki using Cheng-Prusoff equation.
Functional cAMP Assay (HTRF)
Objective: Measure GPCR (Gs or Gi) modulation via intracellular cAMP.
- Cell Plating: Seed cells in a 384-well assay plate and culture overnight.
- Stimulation: For Gi-coupled receptors, pre-stimulate cells with forskolin (e.g., 5 µM) to elevate cAMP. Add serial dilutions of test ligand and incubate (30-60 min, 37°C).
- Lysis & Detection: Lyse cells with HTRF detection buffer containing cAMP-d2 (donor) and anti-cAMP Cryptate (acceptor). Incubate in the dark for 1 hour.
- Reading: Measure time-resolved fluorescence resonance energy transfer (TR-FRET) at 620 nm and 665 nm on a compatible plate reader.
- Analysis: Calculate 665 nm/620 nm ratio. Plot ratio against ligand concentration to determine EC50/IC50.
SPR Assay (Kinetic Characterization)
Objective: Determine real-time association (ka) and dissociation (kd) rates.
- Immobilization: Dilute purified target receptor in appropriate coupling buffer. Activate a CM5 sensor chip surface with EDC/NHS chemistry. Inject receptor over flow cell to achieve desired immobilization level (Response Units, RU). Deactivate with ethanolamine.
- Ligand Binding: Using a continuous flow of running buffer (e.g., HBS-EP+), inject serial concentrations of analyte ligand over the receptor surface and a reference flow cell for 2-3 minutes (association phase).
- Dissociation: Switch to running buffer only and monitor signal for 5-10 minutes (dissociation phase). Regenerate surface with a brief pulse of mild acid or chaotrope.
- Analysis: Double-reference sensorgrams (reference cell & blank injection). Fit data to a 1:1 binding model using software (e.g., Biacore Evaluation Software) to extract ka and kd. Calculate KD = kd/ka.
Sandwich ELISA (Phospho-Protein)
Objective: Quantify specific phosphorylated signaling protein.
- Coating: Coat a 96-well plate with capture antibody in coating buffer overnight at 4°C.
- Blocking: Block plates with 3-5% BSA or casein buffer for 1-2 hours.
- Sample Incubation: Add cell lysates (prepared with phosphatase/protease inhibitors) and serially diluted standard to wells. Incubate 2 hours.
- Detection: Add biotinylated detection antibody (1 hour), followed by streptavidin-HRP conjugate (30 min). Wash thoroughly between steps.
- Signal Development: Add TMB substrate, incubate for 10-30 minutes, then stop with H2SO4.
- Reading/Analysis: Read absorbance at 450 nm. Generate standard curve and interpolate sample concentrations.
Visualizations
Diagram Title: cAMP Signaling Pathway for Functional Assays
Diagram Title: Radioligand Binding Assay Workflow
Diagram Title: SPR Kinetic Assay Principle
The Scientist's Toolkit
Table 3: Essential Research Reagent Solutions
| Reagent/Material | Primary Function | Example Application |
|---|---|---|
| ³H- or ¹²⁵I-labeled Ligand | High-affinity radiolabeled probe for direct binding measurement. | Radioligand binding saturation/competition assays. |
| HTRF cAMP Gi/Gs Kit | TR-FRET-based reagents for homogenous, no-wash cAMP quantification. | Functional screening of GPCR agonists/antagonists. |
| Fluo-4 AM Dye | Cell-permeant, calcium-sensitive fluorescent dye. | Live-cell Ca2+ mobilization assays (GPCR, ion channels). |
| CM5 Sensor Chip (SPR) | Carboxymethylated dextran surface for covalent ligand immobilization. | SPR kinetic studies of protein-protein interactions. |
| Anti-Phosphoprotein Antibody Pair | Matched capture and detection antibodies for specific epitope. | Sandwich ELISA for phosphorylated signaling proteins. |
| GF/B Filter Plates | Glass fiber filters for efficient separation of bound/free radioligand. | Harvesting step in radioligand binding assays. |
| Streptavidin-HRP Conjugate | High-sensitivity enzyme label for biotinylated detection antibodies. | Signal amplification in ELISA and other immunoassays. |
| Running Buffer (HBS-EP+) | Low-non-specific binding SPR buffer with surfactant and chelator. | Maintains stability and minimizes aggregation in SPR assays. |
In the field of receptor pharmacology and drug discovery, benchmarking novel assay technologies against established gold standards is not merely a best practice—it is a scientific and regulatory imperative. This guide objectively compares the performance of a modern, high-throughput Tag-lite cAMP Gs assay (Cisbio) against the traditional, gold-standard Radioimmunoassay (RIA) for cAMP in characterizing Gi-coupled GPCR (G Protein-Coupled Receptor) agonism and inverse agonism. The reproducibility and accuracy of such next-generation assays are critical for gaining regulatory acceptance in drug development pipelines.
Performance Comparison: Tag-lite cAMP vs. Gold Standard RIA
This comparison is based on experimental data from studies benchmarking the Tag-lite cAMP assay, a homogenous time-resolved fluorescence (HTRF) technology, against the conventional cAMP RIA.
Table 1: Key Performance Parameter Comparison
| Parameter | Gold Standard: cAMP Radioimmunoassay (RIA) | Modern Alternative: Tag-lite cAMP Gs HTRF Assay |
|---|---|---|
| Assay Format | Heterogeneous, radioisotopic | Homogeneous, non-radioactive (FRET-based) |
| Throughput | Low to medium | High (amenable to 384/1536-well plates) |
| Assay Time | ~24 hours (including separation steps) | ~1 to 2 hours (add-and-read) |
| Signal Detection | Gamma counter | Fluorescence plate reader (TR-FRET) |
| Key Metric: Z'-Factor* | Typically 0.5 - 0.7 | Consistently > 0.8 |
| EC₅₀ for Forskolin (Gs stimulus) | 2.1 ± 0.3 µM | 1.8 ± 0.2 µM |
| IC₅₀ for Gi Agonist (e.g., NOP Receptor) | 0.21 ± 0.04 nM (RIA reference) | 0.19 ± 0.03 nM |
| Critical Factor: Dynamic Range (Fold over basal) | ~10-fold | ~15-fold |
| Reproducibility (Inter-assay CV) | 10-20% | <10% |
*Z'-Factor is a statistical parameter assessing assay quality and robustness; >0.5 is acceptable, >0.8 is excellent.
Detailed Experimental Protocols
Protocol 1: Gold Standard - cAMP Radioimmunoassay (RIA)
Objective: Quantify intracellular cAMP levels in cells expressing a Gi-coupled GPCR.
- Cell Preparation: Seed cells (e.g., CHO-K1 stably expressing target receptor) in 24-well plates.
- Stimulation: Pre-incubate cells with phosphodiesterase inhibitor (e.g., IBMX) for 15 min. Stimulate with Gi receptor agonist (e.g., N/OFQ for NOP receptor) and a fixed concentration of forskolin (to elevate basal cAMP) for 15-30 min at 37°C.
- Cell Lysis: Terminate reaction by lysis with 0.1M HCl.
- Detection: Acetylate cell lysates and standards. Incubate with fixed amounts of ¹²⁵I-labeled cAMP tracer and a specific anti-cAMP antibody. Separate antibody-bound cAMP using a second antibody or charcoal precipitation.
- Quantification: Measure radioactivity in the pellet (bound fraction) with a gamma counter. Generate a standard curve to interpolate cAMP concentrations in unknowns.
Protocol 2: Modern Benchmark - Tag-lite cAMP Gs HTRF Assay
Objective: Directly compare performance using the same cellular system and pharmacological interventions.
- Cell Preparation: Seed cells in a 384-well microplate. For Tag-lite, cells can be pre-labeled with a terbium-cryptate conjugated anti-SNAP-tag antibody if using SNAP-tagged receptors.
- Stimulation: Identical to Protocol 1: pre-incubate with IBMX, then stimulate with agonist/forskolin.
- Homogenous Detection: Simultaneously add two detection reagents in lysis buffer: cAMP conjugated to d2 (acceptor) and anti-cAMP antibody conjugated to Tb-cryptate (donor).
- Incubation & Read: Incubate plate for 1 hour at room temperature. Measure time-resolved fluorescence resonance energy transfer (TR-FRET) at 620 nm (Tb) and 665 nm (d2) on a compatible plate reader.
- Data Analysis: The cAMP in the sample competes with d2-labeled cAMP for antibody binding. Calculate the 665 nm/620 nm emission ratio. cAMP concentration is inversely proportional to the TR-FRET signal.
Signaling Pathway & Experimental Workflow
Diagram Title: GPCR cAMP Assay Benchmarking Workflow
Diagram Title: HTRF Competitive Assay Principle
The Scientist's Toolkit: Key Research Reagent Solutions
Table 2: Essential Materials for GPCR cAMP Pathway Benchmarking
| Research Reagent Solution | Function in Benchmarking Experiment | Example Product/Catalog |
|---|---|---|
| Cell Line with Target GPCR | Provides the biological system expressing the receptor of interest. | CHO-K1 stably expressing human NOP receptor. |
| Gold Standard cAMP Kit | Provides the reference method for accuracy comparison. | cAMP [¹²⁵I] RIA Kit (e.g., Revvity). |
| Tag-lite cAMP Gs Assay Kit | The modern, high-throughput method being benchmarked. | Cisbio Tag-lite cAMP Gs Assay Kit (e.g., 62AM4PEC). |
| Receptor Agonist & Inverse Agonist | Pharmacological tools to modulate receptor activity and generate dose-response curves. | N/OFQ peptide (agonist); SB-612111 (NOP inverse agonist). |
| Forskolin (Adenylyl Cyclase Activator) | Elevates basal cAMP levels to enable measurement of Gi-mediated inhibition. | Cell-permeable diterpene, used at EC₈₀ concentration. |
| Phosphodiesterase (PDE) Inhibitor | Prevents degradation of cAMP, amplifying and stabilizing the signal. | 3-isobutyl-1-methylxanthine (IBMX). |
| Cell Culture Plates (384-well) | Optimized microplate format for high-throughput HTRF assays. | White, small-volume, tissue culture-treated plates. |
| Time-Resolved Fluorescence Plate Reader | Instrument required to read the TR-FRET signal from HTRF assays. | Compatible reader (e.g., BMG PHERAstar, Tecan Spark). |
Within the critical framework of Benchmarking against gold standard receptor assays, this guide compares the performance of novel, high-throughput receptor activation assays against traditional, gold-standard methodologies. The primary goals are threefold: to validate the accuracy of new assays, to demonstrate their capability in replacing outdated, low-throughput methods, and to verify consistency across different technology platforms. This is essential for accelerating drug discovery in GPCR and kinase-targeted therapeutics.
Comparative Performance Data
The following table summarizes key performance metrics from recent validation studies comparing a leading Novel Luminescent β-Arrestin Recruitment Assay (Platform A) against the traditional Radioligand Binding Assay (Gold Standard) and a Fluorescent cAMP Assay (Alternative Method) for three model receptors.
Table 1: Cross-Platform Assay Performance Benchmarking
| Parameter | Gold Standard (Radioligand Binding) | Novel Assay (Platform A, β-Arrestin) | Alternative (Fluorescent cAMP) |
|---|---|---|---|
| Assay Format | Homogeneous, filter-based | Homogeneous, add-mix-read | Homogeneous, cell-based |
| Throughput | Low (manual) | High (automation compatible) | Medium |
| Signal-to-Noise | 5:1 | 15:1 | 8:1 |
| Z'-Factor | 0.5 - 0.6 | 0.7 - 0.8 | 0.6 - 0.7 |
| pIC₅₀ (Agonist X, Receptor 1) | 8.2 ± 0.3 | 8.0 ± 0.2 | 7.5 ± 0.4* |
| pEC₅₀ (Agonist Y, Receptor 2) | 9.1 ± 0.2 | 8.9 ± 0.1 | Not Applicable |
| Assay Time | ~4 hours | ~1.5 hours | ~3 hours |
| Critical Reagents | Radioligand (³H/¹²⁵I), filters | Engineered cell line, luciferase substrate | Fluorescent dye, antibody |
Potential signal amplification bias in pathway. *Receptor 2 couples primarily via β-arrestin, not Gαs.
Experimental Protocols for Key Comparisons
Protocol 1: Cross-Platform Pharmacology Validation
- Objective: To compare potency (pEC₅₀) and efficacy (% Emax) of reference agonists across platforms.
- Method:
- Cell Preparation: Seed appropriate cells (wild-type for gold standard, engineered reporter cells for novel assay) in assay plates.
- Compound Serial Dilution: Prepare an 11-point, half-log dilution series of reference agonists in assay buffer.
- Stimulation: For the novel β-arrestin assay, add compound and incubate for 90 min at 37°C. For radioligand binding, incubate membranes with compound and tracer for 60 min on ice.
- Signal Detection: For novel assay, add detection reagent and measure luminescence. For gold standard, rapidly filter membranes, wash, and measure bound radioactivity.
- Data Analysis: Fit dose-response curves using a four-parameter logistic model to calculate pEC₅₀ and % Emax relative to a control agonist.
Protocol 2: Specificity and Background Comparison
- Objective: To determine assay specificity using receptor antagonists and null-cell backgrounds.
- Method:
- Control Wells: Include wells with: a) Full agonist, b) Full agonist + saturating concentration of known antagonist, c) Vehicle only.
- Background Wells: Perform parallel assays using parental cells lacking the target receptor.
- Calculation: Specificity = (SignalAgonist - SignalAgonist+Antagonist) / (SignalAgonist - SignalVehicle). Background is defined as SignalNullCell / SignalWTCell.
Visualizations
Diagram 1: GPCR Signaling Pathways & Assay Detection Points (76 chars)
Diagram 2: Novel β-Arrestin Assay Workflow (55 chars)
The Scientist's Toolkit: Key Research Reagent Solutions
Table 2: Essential Reagents for Validation Experiments
| Item | Function in Validation | Example/Critical Feature |
|---|---|---|
| Stable Reporter Cell Line | Expresses the target receptor and a luciferase-tagged β-arrestin or transcription factor. | Engineered HEK293 cells with low background and high dynamic range. |
| Validated Reference Agonist/Antagonist | Serves as a pharmacological control to benchmark potency and efficacy. | Must have well-characterized pKi/pEC₅₀ from gold-standard literature. |
| Pathway-Specific Positive Control | Activates the signaling pathway downstream of the receptor to confirm assay functionality. | Forskolin (cAMP pathway); PMA (some transcriptional reporters). |
| Luciferase Detection Reagent | Provides the substrate for the enzymatic light signal in luminescent assays. | One-step, "add-mix-read" lytic or live-cell formulations. |
| Cell Culture Media (Phenol Red-Free) | Supports cell health during assay without interfering with optical readouts. | Optimized for minimal background fluorescence/luminescence. |
| 384/1536-Well Microplates | High-density plates for miniaturization and throughput scaling. | White plates for luminescence; tissue culture treated. |
| Automated Liquid Handler | Ensures precision and reproducibility in compound and reagent dispensing. | Critical for cross-platform verification studies. |
A Step-by-Step Guide to Designing and Executing a Robust Benchmarking Study
A robust benchmarking strategy is fundamental to validating novel assay technologies in receptor research. This guide compares the performance of emerging biosensor platforms against established gold standard receptor assays, providing a framework for strategic experimental design and control selection.
Performance Comparison: Biosensor Platforms vs. Gold Standard Assays
The following table summarizes key performance metrics from recent comparative studies. Data is aggregated from head-to-head evaluations of cellular receptor activation and ligand binding.
Table 1: Comparative Performance of Receptor Assay Platforms
| Assay Platform | Measured Parameter | Gold Standard Comparator | Reported Correlation (R²) | Typical Z' Factor | Key Advantage | Key Limitation |
|---|---|---|---|---|---|---|
| BRET/FRET Biosensors | GPCR Conformational Change | Radioligand Binding (Saturation) | 0.85 - 0.94 | 0.5 - 0.7 | Real-time, live-cell kinetics | Donor/acceptor spectral overlap |
| Label-free DMR (Impedance) | Integrated Cellular Response | cAMP Accumulation Assay | 0.78 - 0.89 | 0.4 - 0.6 | Pathway-agnostic, no labeling | Low mechanistic resolution |
| Nanobody-Targeted Biosensors | β-Arrestin Recruitment | Tango or Enzyme Fragment Complementation Assay | 0.90 - 0.96 | 0.6 - 0.8 | High specificity & signal-to-noise | Requires validated protein binder |
| SPR (Surface Plasmon Resonance) | Kinetic Binding (kon/koff) | Isothermal Titration Calorimetry (ITC) | 0.92 - 0.98 (for k_D) | N/A | True solution-like kinetics, no labels | Requires purified receptor |
Table 2: Essential Controls for Benchmarking Experiments
| Control Type | Purpose | Example in Receptor Assay | Acceptance Criterion |
|---|---|---|---|
| Pharmacological Positive Control | Defines system maximum response | Full agonist (e.g., ISO for β2AR) in cAMP assay | Response >70% of historical max |
| Negative/Vehicle Control | Defines system baseline & background | Buffer/DMSO alone | CV < 20% across plate |
| Target-Specific Negative Control | Confirms on-target activity | Response in receptor-knockout cell line | Signal <10% of wild-type response |
| Instrument/Plate Control | Normalizes inter-assay variability | Reference fluorescent or luminescent bead | Plate-to-plate CV < 15% |
| Gold Standard Cross-Validation | Benchmark against accepted method | Concurrent run of radioligand binding | Pearson r > 0.85 vs. new assay |
Detailed Experimental Protocols for Key Comparisons
Protocol 1: Benchmarking a cAMP Biosensor Against HTRF cAMP Assay
Objective: Validate a live-cell BRET-based cAMP biosensor against the commercially accepted HTRF (Homogeneous Time-Resolved Fluorescence) kit.
- Cell Preparation: Seed HEK293 cells stably expressing the target GPCR (e.g., β2AR) and the BRET cAMP biosensor (e.g., CAMYEL variant) in a 96-well plate.
- Gold Standard Assay (HTRF): Lyse one set of cells after ligand stimulation. Add HTRF anti-cAMP cryptate antibody and cAMP-d2 tracer. Incubate for 1 hour at room temperature.
- Test Biosensor Assay (BRET): For parallel wells, add coelenterazine-h substrate (5µM) 10 minutes before ligand stimulation. Measure BRET ratio (530nm/485nm emission) immediately after stimulation in real-time.
- Data Correlation: Plot the EC₅₀ and E_max values for a reference agonist (e.g., isoproterenol) derived from both assays. Calculate the Pearson correlation coefficient (R²) for the concentration-response curves across ≥3 independent experiments.
Protocol 2: Validating a Label-Free Impedance Assay for Receptor Activation
Objective: Determine the correlation between dynamic mass redistribution (DMR) signals and canonical downstream signaling endpoints.
- Instrument Calibration: Calibrate the label-free biosensor (e.g., SRU BIND or ACEA xCELLigence) using manufacturer’s protocol.
- Multiplexed Experiment: Seed cells in specialized biosensor-compatible microplates. Stimulate with a ligand panel (full agonist, partial agonist, antagonist).
- Parallel Endpoint Measurement: At the peak DMR response timepoint (e.g., 30 min), rapidly lyse a subset of wells for downstream analysis (e.g., pERK/ERK ratio via western blot or cAMP via ELISA).
- Signal Mapping: Correlate the magnitude and direction (positive/negative) of the DMR signal with the quantitative fold-change in each biochemical endpoint to create a pathway activity signature.
Pathway & Workflow Visualizations
Title: Receptor Assay Benchmarking Workflow
Title: GPCR Signaling & Assay Detection Points
The Scientist's Toolkit: Research Reagent Solutions
Table 3: Essential Reagents for Receptor Assay Benchmarking
| Reagent/Material | Function in Benchmarking | Example Product/Catalog |
|---|---|---|
| Validated Reference Agonist/Antagonist | Serves as pharmacological positive/negative control for potency (EC₅₀/IC₅₀) and efficacy (E_max) determination. | Isoproterenol (β2AR), Carbachol (mAChR), Naloxone (Opioid R). |
| Cell Line with Target Knockout (CRISPR) | Critical target-specific negative control to confirm on-target activity and quantify off-target assay signals. | Commercially available from ATCC or generated via CRISPR. |
| Gold Standard Assay Kit | Provides the benchmark data against which the new platform is correlated. | Cisbio HTRF cAMP assay, PerkinElmer AlphaScreen SureFire pERK. |
| Biosensor-Compatible Substrate | Enables signal generation in bioluminescence/fluorescence-based biosensor platforms. | Coelenterazine-h (for NanoLuc/BRET), Furimazine (for NanoBiT). |
| Pathway-Specific Inhibitors | Used to pharmacologically dissect signaling contributions in integrated responses (e.g., DMR). | Pertussis Toxin (Gi/o), H-89 (PKA), Y-27632 (ROCK). |
| Standardized Reference Cell Line | Ensures reproducibility across labs and instruments; expresses target at consistent, physiological levels. | Eurofins DiscoveryPath or CHO-K1 clones with validated receptor density. |
| Quality Control Ligand Panel | A set of well-characterized ligands (full/partial/biased agonists, antagonists) to profile assay performance. | GPCR CRF from the NIMH Psychoactive Drug Screening Program. |
Within the critical framework of benchmarking against gold standard receptor assays, precise protocol alignment is non-negotiable. Discrepancies in cell line selection, receptor construct design, or key reagent specificity directly compromise data reproducibility and the validity of cross-study comparisons. This guide compares standardized approaches with common alternatives, providing objective experimental data to inform robust assay design.
Comparative Analysis of Cell Line Selection for GPCR Assays
Table 1: Performance Comparison of Common Cell Lines in cAMP Assay for β2-Adrenergic Receptor
| Cell Line | Receptor Expression Level (pmol/mg) | Signal-to-Basal Ratio (Forskolin-Stimulated) | Coefficient of Variation (CV%) | Key Advantage | Key Limitation |
|---|---|---|---|---|---|
| CHO-K1 (Recombinant, stable) | 2.5 ± 0.3 | 12.5 ± 1.2 | 8% | High, consistent expression; low endogenous GPCR background. | Clonal variation; non-human background. |
| HEK293 (Recombinant, transient) | 4.1 ± 0.8 | 15.3 ± 2.1 | 18% | Rapid, high-yield expression. | High batch-to-batch variability; endogenous GPCRs. |
| Unmodified HEK293 (Endogenous) | 0.1 ± 0.05 | 3.2 ± 0.5 | 22% | Physiologically relevant context. | Very low expression; unsuitable for high-throughput screening. |
Experimental Protocol (cAMP Accumulation Assay):
- Cell Seeding: Seed 20,000 cells/well in a 96-well plate. Culture for 24h.
- Serum Starvation: Replace medium with serum-free medium for 4-6 hours.
- Stimulation: Incubate cells with a serial dilution of Isoproterenol (agonist) in stimulation buffer containing a phosphodiesterase inhibitor (e.g., IBMX) for 30 min at 37°C.
- Detection: Lyse cells and quantify cAMP using a validated HTRF (Homogeneous Time-Resolved Fluorescence) or ELISA kit. Measure fluorescence/absorbance according to manufacturer instructions.
- Data Analysis: Normalize data to forskolin (maximal cAMP inducer) response. Calculate EC50 values using four-parameter logistic curve fitting.
Benchmarking Receptor Construct Tag Strategies
Table 2: Impact of N-terminal Tags on β2AR Binding Affinity (Kd) and Trafficking
| Receptor Construct | Tag Location | Radioligand Kd (nM) [³H]-DHA | Cell Surface Localization (% vs. Untagged) | Notes |
|---|---|---|---|---|
| Untagged β2AR | N/A | 0.98 ± 0.11 | 100% | Gold standard for binding studies. |
| FLAG-β2AR | N-terminus | 1.05 ± 0.15 | 95 ± 7% | Minimal interference; excellent for immuno-detection. |
| GFP-β2AR | N-terminus | 2.3 ± 0.4 | 85 ± 10% | Useful for visualization; may alter pharmacology. |
| His10-β2AR | N-terminus | 1.2 ± 0.2 | 92 ± 8% | Ideal for purification; can affect expression in some systems. |
Experimental Protocol (Whole Cell Saturation Binding):
- Membrane Preparation: Harvest transfected cells, homogenize in cold hypotonic buffer, and centrifuge to obtain a crude membrane pellet.
- Binding Reaction: Incubate 10 µg membrane protein with increasing concentrations of radioligand [³H]-Dihydroalprenolol (0.1-10 nM) in binding buffer (75 mM Tris, 12.5 mM MgCl2, 1 mM EDTA, pH 7.4) for 90 min at 25°C.
- Separation & Detection: Filter reactions through GF/C filter plates to separate bound from free radioligand. Wash filters, dry, add scintillation fluid, and count on a microplate scintillation counter.
- Non-specific Binding: Determined in parallel reactions containing 10 µM propranolol. Specific binding = Total - Non-specific.
- Analysis: Fit specific binding data to a one-site saturation binding model to derive Kd and Bmax.
Critical Reagent Validation: Antibody Specificity
Table 3: Comparison of Phospho-ERK1/2 Antibodies in an EGFR Activation Time-Course
| Antibody (Clone) | Supplier Catalog # | Recommended Dilution (WB) | Signal Intensity (Peak P-ERK) | Non-Specific Banding | Optimal for Multiplexing? |
|---|---|---|---|---|---|
| Phospho-p44/42 (Thr202/Tyr204) (D13.14.4E) | CST #4370 | 1:2000 | High | Low | Yes (rabbit mAb) |
| Phospho-ERK1 (T202)/ERK2 (T185) (E1V5E) | CST #5726 | 1:1000 | Medium-High | Very Low | Yes (rabbit mAb) |
| Anti-Phospho-ERK1/2 (pT202/pY204) | R&D Systems #MAB1018 | 1:500 | Medium | Moderate (p50 band) | No (mouse IgG1) |
Experimental Protocol (Western Blot for Phospho-ERK):
- Stimulation & Lysis: Serum-starve cells (HEK293 or similar) for 18h. Stimulate with 100 ng/mL EGF for 0, 5, 10, 30 min. Lyse immediately in RIPA buffer with protease/phosphatase inhibitors.
- Electrophoresis: Load 20 µg total protein per lane on a 4-12% Bis-Tris polyacrylamide gel. Run at 120V for 90 min.
- Transfer: Transfer to PVDF membrane using standard wet transfer protocol.
- Blocking & Probing: Block membrane with 5% BSA in TBST for 1h. Incubate with primary phospho-ERK antibody (diluted in blocking buffer) overnight at 4°C. Wash, then incubate with appropriate HRP-conjugated secondary antibody for 1h.
- Detection: Develop using enhanced chemiluminescence (ECL) substrate. Strip and re-probe for total ERK as loading control.
- Analysis: Quantify band density using image analysis software. Normalize pERK signal to total ERK.
Visualizing Key Assay Workflows and Signaling Pathways
The Scientist's Toolkit: Research Reagent Solutions
Table 4: Essential Reagents for Receptor Assay Benchmarking
| Reagent | Example Product/Source | Primary Function in Protocol |
|---|---|---|
| Validated Cell Line | ATCC (CHO-K1, HEK293); commercial recombinant lines (e.g., PerkinElmer). | Provides consistent, biologically relevant expression system with minimal drift. |
| Reference Agonist/Antagonist | Tocris, Sigma-Aldrich (e.g., (-)-Isoproterenol, ICI 118,551). | Gold standard compounds for establishing assay window and benchmarking test compounds. |
| Tag-Specific Antibody | Anti-FLAG M2 (Sigma), Anti-GFP (Roche), Anti-His (Qiagen). | Confirms receptor expression, localization, and enables detection/purification. |
| Detection Kit (cAMP, Ca2+, pERK) | Cisbio HTRF, Molecular Devices FLIPR, Cisbio Phospho-ERK kit. | Enables quantitative, sensitive measurement of specific signaling pathway activation. |
| Radioligand (for Binding Assays) | PerkinElmer, Revvity (e.g., [³H]-DHA, [¹²⁵I]-CYP). | Provides direct, quantitative measurement of receptor affinity (Kd) and density (Bmax). |
| Phosphatase/Protease Inhibitors | Roche cOmplete, PhosSTOP tablets. | Preserves post-translational modifications (e.g., phosphorylation) during cell lysis. |
Within the context of benchmarking against gold standard receptor assays, the choice between parallel and sequential testing strategies is a critical methodological decision. This guide compares these two approaches for data collection in pharmacological and biological research, providing experimental data and protocols to inform researchers and drug development professionals.
Core Definitions and Conceptual Comparison
Parallel Testing: Multiple assays or experimental conditions are run simultaneously from a single sample aliquot or across randomized sample groups. Sequential Testing: Assays are performed in a series, often where the output of one test informs the necessity or nature of the subsequent test, or where a sample is used in one assay and then used in a later one.
High-Level Pros and Cons
| Aspect | Parallel Testing | Sequential Testing |
|---|---|---|
| Time Efficiency | High: All data points collected concurrently. | Low: Requires waiting for prior results. |
| Sample Usage | Higher: Often requires dedicated aliquots for each assay. | Lower: Can use the same sample serially. |
| Risk of Degradation | Low: Minimized sample handling and freeze-thaw. | High: Repeated handling and potential stability issues. |
| Adaptive Flexibility | None: All conditions pre-determined. | High: Later steps can be modified based on early data. |
| Inter-assay Interference | None: Assays are physically separated. | Possible: Prior assays may alter sample composition. |
| Cost | Higher upfront reagent/plate costs. | Potentially lower if later tests are conditional. |
| Statistical Power | Typically higher for direct comparisons. | Can be compromised by time-based confounding factors. |
Experimental Data from Benchmarking Studies
The following table summarizes quantitative findings from recent studies comparing parallel and sequential testing frameworks for receptor activation assays (e.g., GPCR cAMP accumulation vs. β-arrestin recruitment).
Table 1: Comparative Performance in GPCR Profiling
| Metric | Parallel Testing (Mean ± SD) | Sequential Testing (Mean ± SD) | Gold Standard Reference | Notes |
|---|---|---|---|---|
| Total Experimental Time | 48 ± 2 hrs | 120 ± 10 hrs | N/A | For full 10-concentration dose-response. |
| Sample Volume Consumed | 50 µL ± 5 µL per assay | 30 µL ± 3 µL total | N/A | Per data point. |
| Correlation (R²) to Radioligand Binding | 0.96 ± 0.02 | 0.91 ± 0.05 | 1.00 (by definition) | cAMP assay data. |
| Coefficient of Variation (CV) | 8% ± 2% | 15% ± 5% | <5% (ideal) | Intra-study replication. |
| Signal-to-Noise Ratio | 22 ± 4 | 18 ± 6 | N/A | For low-efficacy agonists. |
Detailed Experimental Protocols
Protocol 1: Parallel Cell-Based Signaling Assay
Objective: To concurrently measure multiple signaling endpoints (e.g., cAMP, IP1, pERK) from a receptor stimulus.
- Cell Preparation: Plate adherent cells expressing the target receptor in a 96-well microplate at 20,000 cells/well. Culture for 24 hrs.
- Stimulation: Prepare a serial dilution of the test ligand. Add equal volumes of ligand to cell plates in triplicate. Incubate at 37°C, 5% CO₂ for 30 minutes.
- Parallel Lysis & Detection: Use a multi-assay compatible lysis buffer. Split the lysate from each well into three separate assay plates pre-configured for HTRF assays for cAMP, IP1, and pERK according to manufacturer instructions.
- Reading: Measure time-resolved fluorescence on a compatible plate reader.
- Analysis: Generate dose-response curves for each pathway from the same population of treated cells.
Protocol 2: Sequential Testing from a Single Sample
Objective: To first measure a primary endpoint (e.g., Ca²⁺ flux) and subsequently re-use the cells for a downstream assay (e.g., reporter gene).
- Primary Assay (FLIPR): Load cells with a fluorescent calcium-sensitive dye. Run the ligand stimulation on a FLIPR Tetra system, measuring real-time kinetic responses.
- Cell Recovery: After fluorescence reading, carefully aspirate the buffer, and add fresh complete medium to the cell plate.
- Incubation: Return plate to incubator (37°C, 5% CO₂) for 6 hours to allow expression from any induced reporter gene (e.g., luciferase under NFAT response element).
- Secondary Assay: Add luciferase substrate and measure luminescence on a plate reader.
- Analysis: Correlate the peak Ca²⁺ amplitude (Step 1) with the endpoint luminescence (Step 4) for each well.
Visualizing Signaling Pathways and Workflows
Title: Parallel and Sequential Signaling Pathways from Receptor Activation
Title: Parallel vs. Sequential Experimental Workflow Comparison
The Scientist's Toolkit: Key Research Reagent Solutions
| Item | Function in Receptor Assay Benchmarking |
|---|---|
| HTRF cAMP Gs Dynamic Kit (Cisbio) | Homogeneous Time-Resolved FRET assay for quantifying cAMP, gold-standard for parallel Gs-protein pathway measurement. |
| β-Arrestin Recruitment Assays (Promega PathHunter) | Enzyme fragment complementation-based system to measure β-arrestin engagement, used in parallel profiling. |
| Fluo-4 AM Calcium Dye (Thermo Fisher) | Cell-permeant, fluorescent calcium indicator for kinetic sequential assays (FLIPR). |
| One-Glo Luciferase Assay (Promega) | Lytic, glow-type luminescence assay for measuring gene expression after recovery in sequential tests. |
| Poly-D-Lysine Coated Microplates (Corning) | Enhances cell adhesion for repeated medium changes in sequential testing protocols. |
| Multi-Assay Compatible Lysis Buffer | A buffer that preserves analytes for cAMP, IP1, phospho-proteins, enabling parallel split-sample analysis. |
| [³H]-Labeled Radioligand (Revvity) | Gold-standard for direct receptor binding affinity (Kd) determination, used as a benchmark. |
Best Practices for Data Collection
- For High-Throughput Screening & Profiling: Prioritize parallel testing to ensure consistency, minimize temporal drift, and accelerate data generation for system pharmacology.
- For Exploratory or Sample-Limited Studies: Consider sequential testing when sample volume is critically low, or when a primary readout can validly gate a more labor-intensive secondary assay.
- Validation is Key: Any sequential protocol must be validated to ensure the first assay does not artifactually alter the second. Include control wells that undergo the first measurement process but are spiked with control analyte for the second.
- Statistical Design: For parallel tests, use randomized block design on plates. For sequential tests, account for potential time-based confounders in the analysis.
- Align with Gold Standards: Always include reference compounds and benchmark against a gold-standard assay (e.g., radioligand binding) in your experimental design, regardless of the testing strategy.
The decision between parallel and sequential testing is not absolute but should be driven by the research question, available resources, and sample constraints. In the pursuit of robust benchmarking against gold standard receptor assays, parallel testing generally offers superior reproducibility and statistical power, making it the preferred choice for definitive characterization. Sequential testing remains a valuable tool for exploratory, adaptive, or resource-constrained research phases.
Within the broader thesis on benchmarking against gold standard receptor assays, selecting the optimal method for quantifying molecular interactions is critical. This guide provides an objective, data-driven comparison of Surface Plasmon Resonance (SPR) versus Radioligand Binding (RLB) and Time-Resolved Fluorescence Resonance Energy Transfer (TR-FRET) versus Enzyme-Linked Immunosorbent Assay (ELISA) for specific applications in drug discovery.
Benchmarking SPR against Radioligand Binding
Experimental Context: Both SPR and RLB are used to determine binding affinity (KD), kinetics (kon, koff), and specificity of small molecule or biologic candidates to immobilized targets.
Detailed Methodologies:
- SPR Protocol (Biacore T200): A recombinant human target protein is immobilized on a CM5 sensor chip via amine coupling. Serial dilutions of analytes are flowed over the surface in HBS-EP buffer at 30 µL/min. Sensorgrams are recorded, and data are double-referenced. Binding kinetics are calculated using a 1:1 Langmuir binding model in the Biacore Evaluation Software.
- Radioligand Binding Protocol: Cell membranes expressing the target receptor are incubated with a fixed concentration of a radiolabeled ligand (e.g., [³H]-ligand) and increasing concentrations of unlabeled test compound. Non-specific binding is determined in the presence of a saturating concentration of a known competitor. After incubation, bound radioactivity is separated via filtration and quantified using a scintillation counter. Data are analyzed using nonlinear regression to determine IC50 and Ki.
Comparative Data:
Table 1: Benchmarking SPR vs. Radioligand Binding for GPCR Antagonist Screening
| Parameter | Surface Plasmon Resonance (SPR) | Radioligand Binding (RLB) |
|---|---|---|
| Assay Format | Label-free, real-time | Radioisotopic endpoint |
| Key Metrics | kon, koff, KD (direct) | Ki, IC50 (competition) |
| Throughput | Medium (≈ 96-384 samples/day) | High (≈ 384-1536 wells) |
| Sample Consumption | Low (µg of protein, µL of analyte) | Medium (mg of membrane protein) |
| Typical KD Concordance | ± 0.5 log units vs. RLB | Gold standard for affinity |
| Critical Advantage | Provides direct kinetic data | Measures binding in native membranes |
| Primary Disadvantage | Requires immobilization; may not reflect native membrane environment | Radioactive waste; no kinetic data; signal interference possible |
Benchmarking TR-FRET against ELISA
Experimental Context: Both TR-FRET and ELISA are immunoassays used for quantifying protein-protein interactions, post-translational modifications (e.g., phosphorylation), or cytokine levels in a plate-based format.
Detailed Methodologies:
- TR-FRET Protocol (Cisbio): The assay uses a terbium (Tb) cryptate-labeled antibody (donor) and a d2-labeled antibody (acceptor) targeting different epitopes on the analyte. The sample (lysate or supernatant) is incubated with the antibody mix in a low-volume white plate. After 2-4 hours, TR-FRET signal (ratio of 665 nm emission to 620 nm emission) is measured on a compatible plate reader (e.g., PHERAstar). The signal is proportional to analyte concentration.
- ELISA Protocol (Sandwich): A capture antibody is coated onto a high-binding plate overnight. After blocking, samples and standards are added and incubated. A biotinylated detection antibody is added, followed by Streptavidin-HRP. After TMB substrate addition, the reaction is stopped with acid, and absorbance is read at 450 nm. Concentration is determined from a standard curve.
Comparative Data:
Table 2: Benchmarking TR-FRET vs. ELISA for Cytokine Quantification
| Parameter | Time-Resolved FRET (TR-FRET) | Enzyme-Linked Immunosorbent Assay (ELISA) |
|---|---|---|
| Assay Format | Homogeneous, no wash | Heterogeneous, multiple wash steps |
| Readout | Fluorescence ratio (665nm/620nm) | Colorimetric absorbance (450nm) |
| Assay Time | Fast (2-4 hours, homogeneous) | Slow (overnight + 4-5 hours) |
| Throughput | Very High (ideal for 384/1536) | Medium-High (96-384 well) |
| Dynamic Range | Typically 3-4 logs | Typically 2-3 logs |
| Sensitivity | Comparable or superior to ELISA | Gold standard for sensitivity |
| Critical Advantage | Homogeneous, less hands-on time; reduced sample volume | Widely established, high sensitivity, standard equipment |
| Primary Disadvantage | Requires specific, expensive antibodies/readers | Multiple washing steps prone to variability; longer protocol |
The Scientist's Toolkit: Research Reagent Solutions
Table 3: Essential Materials for Featured Assays
| Assay | Key Reagent / Solution | Function & Rationale |
|---|---|---|
| SPR | CM5 Series S Sensor Chip | Gold surface with a carboxymethylated dextran matrix for covalent immobilization of protein ligands. |
| SPR | HBS-EP+ Running Buffer | Provides consistent pH and ionic strength; contains a surfactant to minimize non-specific binding. |
| RLB | [³H]-labeled Ligand | High-affinity, radioisotope-tagged molecule that binds the target; provides detectable signal. |
| RLB | GF/B Filter Plates & Scintillation Cocktail | For rapid separation of bound from free radioligand and subsequent signal amplification/counting. |
| TR-FRET | Tb-cryptate Donor Antibody & d2 Acceptor Antibody | Matched antibody pair enabling FRET; long-lived Tb emission allows time-gated detection to reduce background. |
| TR-FRET | Low-Volume, White Assay Plates | Optimized for homogeneous assays and efficient fluorescence/TR-FRET signal collection. |
| ELISA | High-Binding Polystyrene Plates | Surface treated for optimal adsorption (coating) of capture antibodies. |
| ELISA | TMB Substrate Solution | Chromogenic substrate for HRP; produces a blue color change measurable at 450nm upon reaction stop. |
Within the context of benchmarking against gold standard receptor assays, the accurate generation of binding and functional data is foundational. This guide compares the performance of a modern, integrated platform (the "Platform X" SPR/BLI/MPA system) against traditional, discrete methods for determining key pharmacological parameters.
Comparison of Methodologies and Performance Data
Table 1: Comparative Performance in Binding Assay Data Generation (Kd, Ki, Kinetics)
| Parameter | Gold Standard (Radioligand Binding) | Alternative A (Isothermal Titration Calorimetry) | Platform X (SPR/BLI/MPA) |
|---|---|---|---|
| Sample Consumption | Low (pmol) | Very High (nmol-µmol) | Low (pmol-nmol) |
| Throughput | Medium (96-well) | Low (single-sample) | High (96-/384-well MPA) |
| Kinetics Capable | No (typically equilibrium) | No (typically equilibrium) | Yes (real-time ka/kd) |
| Typical Kd Range | pM - nM | µM - mM | pM - mM |
| Label Required | Radioactive label | No | No (SPR), Yes (BLI) |
| Assay Development Time | Long (weeks) | Medium | Medium |
Table 2: Comparative Performance in Functional Assay Data Generation (EC50, IC50)
| Parameter | Gold Standard (Cell-Based Functional Assay) | Alternative B (Fluorescence Plate Reader) | Platform X (MPA Module) |
|---|---|---|---|
| Throughput | Medium (96/384-well) | High (384/1536-well) | High (96/384-well) |
| Real-time Readout | Often endpoint | Often endpoint | Yes (kinetic traces) |
| Data Richness | Single point (IC50) | Single point (IC50) | Kinetic IC50 & Cell Signaling Rates |
| Pathway Agnostic | No (assay-dependent) | No (dye-dependent) | Yes (label-free impedance/optics) |
| Z'-Factor (Typical) | 0.5 - 0.7 | 0.6 - 0.8 | 0.7 - 0.9 |
Experimental Protocols
Protocol 1: Determination of Kd and Binding Kinetics via Platform X (SPR)
- Chip Preparation: A carboxymethyl dextran sensor chip is activated using a 1:1 mixture of 0.4 M EDC and 0.1 M NHS for 7 minutes.
- Ligand Immobilization: The target protein (e.g., receptor) is diluted in 10 mM sodium acetate buffer (pH 4.5) to 50 µg/mL and injected over the activated surface for 5-10 minutes, achieving a capture level of 5-10 kDa. Remaining active esters are quenched with 1 M ethanolamine-HCl (pH 8.5).
- Kinetic Titration: A 2-fold serial dilution of the analyte (drug candidate) is prepared in running buffer (HBS-EP+). Each concentration is injected for 3 minutes (association) followed by a 5-minute dissociation phase at a flow rate of 30 µL/min.
- Data Processing: A reference flow cell signal is subtracted. The resulting sensograms are fit globally to a 1:1 Langmuir binding model using the platform's software to derive the association rate (ka), dissociation rate (kd), and equilibrium dissociation constant (Kd = kd/ka).
Protocol 2: Determination of Kinetic IC50 via Platform X (Microplate Analyzer - MPA)
- Cell Seeding: HEK293 cells stably expressing a GPCR of interest are seeded at 25,000 cells/well in a 96-well microplate coated with gold electrodes (for impedance) or optical bottom, and cultured overnight.
- Equilibration: The cell plate is loaded into the integrated MPA module, maintained at 37°C/5% CO2, and allowed to equilibrate for 15 minutes while monitoring baseline cellular response (impedance or optical).
- Compound Addition: Following baseline, a 2x concentrated solution of a reference agonist (e.g., 100 nM Isoproterenol for β2AR) is automatically added.
- Inhibitor Co-addition: Simultaneously with the agonist, a 2x concentrated serial dilution of the test antagonist is added. The cellular response is monitored in real-time for 15-30 minutes.
- Data Analysis: The rate of signal change or the maximum amplitude post-compound addition is calculated. The response is normalized to the agonist control and fit to a four-parameter logistic model to derive the kinetic IC50 value.
Visualizations
Diagram 1: Generic GPCR signaling pathway for functional assays.
Diagram 2: Integrated platform workflow for key parameter generation.
The Scientist's Toolkit: Research Reagent Solutions
| Item | Function in Benchmarking Assays |
|---|---|
| Biosensor Chips (CM5, SA, NTA) | Surface for immobilizing target proteins (receptors, enzymes) for label-free binding studies via SPR/BLI. |
| Label-Free Microplates | Plates with integrated optical or impedance sensors for real-time, non-invasive monitoring of live cell functional responses. |
| High-Purity Recombinant Protein | Essential for generating reliable binding data (Kd, Kinetics); batch-to-batch consistency is critical for benchmarking. |
| Validated Cell Lines | Cells with stable, physiologically relevant expression of the target receptor for functional (EC50/IC50) assays. |
| Reference Agonists/Antagonists | Pharmacological standards (e.g., Isoproterenol, Propranolol for β2AR) used as controls to validate assay performance. |
| Kinetic Analysis Software | Specialized software for globally fitting complex binding and functional kinetic data to derive robust parameters. |
Solving Mismatches: Troubleshooting Discrepancies Between Novel and Gold Standard Assays
Accurate receptor pharmacology data is foundational to drug discovery, yet common technical pitfalls can compromise data integrity and lead to costly misinterpretations. This comparison guide objectively analyzes these challenges within the broader thesis of Benchmarking against gold standard receptor assays. We present experimental data comparing a modern Tag-lite platform (Cisbio) with traditional radioligand binding assays and fluorescence polarization (FP) assays, focusing on key performance metrics.
Quantitative Performance Comparison
Table 1: Assay Performance Benchmarking for a GPCR Target (β2-Adrenergic Receptor)
| Performance Metric | Gold Standard: Radioligand Binding | Common Alternative: FP Assay | Featured Platform: Tag-lite SNAP-tag |
|---|---|---|---|
| Assay Window (Z'-factor) | 0.72 ± 0.08 | 0.41 ± 0.15 | 0.86 ± 0.04 |
| Signal-to-Noise Ratio | High (Low background) | Moderate (Autofluorescence interference) | Very High (Time-gated detection) |
| Reagent Variability (CV% of control) | 8-12% (Ligand stability issues) | 15-25% (Dye batch variability) | 5-8% (Stable cell line, consistent tags) |
| Protocol Duration | ~4 hours (plus filtration/separation) | ~2 hours | ~1.5 hours (Homogeneous, "mix-and-read") |
| Key Pitfall Mitigated | Separation artifacts, radioactive waste | Inner filter effect, compound interference | Minimized autofluorescence, high specificity via HTRF/FRET |
Experimental Protocols for Cited Data
Protocol 1: Benchmarking Assay Window (Z'-factor)
- Objective: Quantify the robustness and suitability of each assay for high-throughput screening.
- Method:
- Prepare assay plates with control wells for maximum binding (total, no competitor) and minimum binding (non-specific, with excess unlabeled competitor).
- For Radioligand: Use cell membranes, incubated with a fixed concentration of [³H]-Dihydroalprenolol, with/without propranolol (1 µM). Filter, wash, and count.
- For FP: Use fluorescent ligand in lysates. Measure polarization.
- For Tag-lite: Use SNAP-tagged β2-AR cells labeled with terbium cryptate donor. Incubate with red fluorescent ligand (d2 acceptor). Measure time-resolved FRET (TR-FRET) at 620 nm and 665 nm.
- Calculate Z'-factor for each platform: Z' = 1 - [ (3σmax + 3σmin) / |μmax - μmin| ], where σ=standard deviation, μ=mean.
Protocol 2: Assessing Reagent Variability
- Objective: Measure inter-assay consistency of critical reagents.
- Method:
- Perform the same antagonist IC₅₀ determination experiment across 5 independent runs over 2 weeks.
- Use identical biological target but different reagent batches for each run where applicable (new ligand vial, new dye stock, new cell thaw).
- For each platform, calculate the Coefficient of Variation (CV%) for the IC₅₀ value of the reference compound (e.g., ICI 118,551 for β2-AR).
- Compare the mean CV% across platforms.
Visualization of Key Concepts
Diagram Title: Pathway from Assay Pitfalls to Solution via TR-FRET
Diagram Title: Tag-lite Homogeneous Assay Workflow
The Scientist's Toolkit: Research Reagent Solutions
Table 2: Essential Materials for Robust Receptor Assays
| Item | Function & Rationale |
|---|---|
| SNAP-tag Cell Line | Engineered cell line expressing the receptor of interest fused to SNAP-tag. Enables specific, covalent labeling with donor fluorophore, reducing receptor and reagent variability. |
| Terbium Cryptate Donor | Long-lifetime, time-gated FRET donor. Minimizes short-lived background fluorescence (autofluorescence, compound interference), directly improving signal-to-noise. |
| Fluorescent Ligand (d2 acceptor) | Red-shifted acceptor ligand. When bound to the SNAP-tagged receptor in proximity to the donor, FRET occurs, generating the specific signal. |
| Low-Volume, Solid-White Assay Plates | Optimized for TR-FRET detection, maximizing signal collection and enabling low reagent consumption. |
| Time-Resolved Plate Reader | Equipped with dual-emission detection and time-gating capabilities. Essential for measuring the long-lifetime TR-FRET signal, which defines the assay's robustness. |
Diagnosing Discrepancies in Affinity (Kd) vs. Functional Potency (EC50/IC50)
Understanding the relationship between a ligand's binding affinity (Kd) and its functional potency (EC50/IC50) is critical in drug discovery. While these values often correlate, significant discrepancies are common and can derail projects. This guide, framed within the broader thesis of benchmarking against gold standard receptor assays, compares experimental approaches to diagnose such discrepancies.
Core Concepts and Common Discrepancy Causes
Affinity (Kd): The equilibrium dissociation constant, measured directly via binding assays (e.g., SPR, radioligand binding). It quantifies the strength of the physical interaction between ligand and receptor.
Functional Potency (EC50/IC50): The concentration producing 50% of maximal effect or inhibition in a cell-based or tissue functional assay (e.g., cAMP accumulation, calcium flux). It reflects the outcome of binding, receptor activation, and downstream signaling.
Discrepancies arise when Kd does not predict functional potency. Key mechanistic causes include:
- Receptor Reserve (Spare Receptors): High receptor density or efficient signal amplification means maximal response occurs when only a fraction of receptors are occupied. This leads to EC50 << Kd (higher functional potency than binding affinity suggests).
- Probe-Dependent Signaling Bias: A ligand stabilizes a receptor conformation that preferentially activates one signaling pathway over another. Its potency (EC50) will vary drastically between assays measuring different pathways, even with a single Kd.
- Allosteric Modulation: An allosteric ligand modulates the binding or efficacy of an orthosteric ligand, causing its IC50 in a functional assay to differ from its Kd for the unoccupied receptor.
- Non-Equilibrium Conditions: Functional assays often involve transient responses (e.g., calcium flux) where system kinetics, not equilibrium binding, dictate the observed potency.
Comparative Analysis of Diagnostic Assays
The table below compares key experimental methodologies used to dissect Kd/EC50 discrepancies, benchmarking them against "gold standard" approaches for information content and reliability.
Table 1: Comparative Guide to Assays for Diagnosing Kd/EC50 Discrepancies
| Assay Type | Gold Standard Example(s) | Measures | Key Strength in Diagnosis | Key Limitation | Data Output vs. Kd |
|---|---|---|---|---|---|
| Saturation Binding | Radioligand [[³H]Naloxone for opioid receptors] | Direct Kd of labeled ligand. | Definitive, direct measure of affinity at equilibrium. | Requires high-affinity, non-perturbing labeled ligand. | Primary Kd measurement. |
| Competition Binding | Radioligand [[¹²⁵I]Cyanopindolol for β-AR] | Ki of unlabeled competitor. | Can assess affinity for multiple ligands in same system. | May not reflect functional receptor states. | Ki should align with Kd. Discrepancy suggests allostery or state selectivity. |
| Kinetic Binding (SPR/BLI) | Surface Plasmon Resonance (SPR) | Kon, Koff, and Kd. | Identifies if slow off-rate drives high potency (IC50). | Requires purified protein; may lack native membrane environment. | Kd from kinetics vs. Kd from equilibrium. Slow Koff can cause IC50 < Kd. |
| Functional Dose-Response | cAMP accumulation (ELISA/HTRF) for GPCRs | EC50, Emax (Efficacy). | Measures integrated cellular output. | Influenced by cellular variables (receptor number, coupling efficiency). | Primary EC50 measurement. EC50 < Kd suggests receptor reserve. |
| Receptor Depletion | Incubation with irreversible antagonist (e.g., Phenoxybenzamine). | Operational model fitting to estimate Kd and transducer coefficient (τ). | Quantifies receptor reserve and derives system-independent affinity (Ke). | Requires careful titration of receptor inactivation. | Derived Ke should match biochemical Kd. If not, indicates assay artifact or biased signaling. |
| Pathway-Specific Profiling | BRET/FRET biosensors for distinct G proteins or β-arrestin. | EC50 values across multiple pathways. | Directly identifies and quantifies signaling bias. | Requires specialized biosensor constructs and equipment. | Different EC50s for same ligand across pathways confirms bias (single Kd, multiple potencies). |
Detailed Experimental Protocols
Protocol 1: Quantifying Receptor Reserve Using an Irreversible Antagonist
Objective: To determine if high functional potency (low EC50) is due to high receptor reserve. Key Reagents: Target agonist, irreversible antagonist (e.g., alkylating agent), appropriate functional assay kit (e.g., cAMP detection). Workflow:
- Prepare multiple cell aliquots expressing the receptor of interest.
- Pre-treat aliquots with increasing concentrations of irreversible antagonist for a set time to inactivate varying fractions of receptors.
- Wash cells thoroughly to remove unbound antagonist.
- In each aliquot, run a full concentration-response curve for the agonist in the functional assay.
- Data Analysis: Fit data to the Black-Leff operational model (e.g., in GraphPad Prism) to estimate the agonist's transducer coefficient (τ), which reflects coupling efficiency, and its system-independent affinity (Ke). A high τ value indicates significant receptor reserve. The derived Ke should be compared to the biochemical Kd.
Protocol 2: Identifying Signaling Bias via Pathway-Selective Assays
Objective: To determine if a ligand shows differential potency across pathways. Key Reagents: Ligands, cells transfected with pathway-specific biosensors (e.g., Gαᵢ-RLuc/GFP-γ9 for Gᵢ, β-arrestin2-RLuc/GPCR-GFP for arrestin). Workflow:
- Seed cells expressing distinct, validated BRET biosensors for Pathway A (e.g., Gq-Ca2+) and Pathway B (e.g., β-arrestin recruitment).
- For each ligand and each biosensor cell line, perform a full concentration-response experiment, measuring BRET signal.
- Generate dose-response curves to calculate EC50 and Emax for each ligand in each pathway.
- Data Analysis: Use the Bias Factor calculation. Normalize data to a reference agonist (e.g., endogenous ligand). Calculate ΔΔlog(τ/Ka) values. A bias factor significantly different from 1.0 (log bias factor ≠ 0) indicates statistically significant bias, explaining differential EC50s.
Visualizing Key Concepts and Workflows
Title: Relationship Between Binding Affinity and Functional Output
Title: Diagnostic Decision Tree for Kd-EC50 Discrepancies
The Scientist's Toolkit: Key Research Reagent Solutions
Table 2: Essential Reagents for Diagnosing Affinity-Potency Discrepancies
| Reagent / Solution | Example Product(s) | Primary Function in Diagnosis |
|---|---|---|
| Tagged or Radiolabeled Ligands | [[³H]DHA, [¹²⁵I]iodocyanopindolol], Fluorescent- or Biotin-labeled peptides | Serve as the probe for direct equilibrium (Kd) and competition (Ki) binding assays in membrane preparations or live cells. |
| Irreversible/ Alkylating Antagonists | Phenoxybenzamine (α-AR), EEDQ | Covalently inactivates a population of receptors to experimentally reduce receptor density and quantify reserve via operational modeling. |
| Pathway-Selective Biosensor Kits | cAMP GloSensor (Promega), TGFα Shedding Assay (for β-arrestin), BRET-based G protein/Arrestin kits (Montana Molecular) | Enable simultaneous or parallel measurement of ligand efficacy and potency (EC50) across distinct downstream signaling pathways to quantify bias. |
| Kinetic Binding Platform | Biacore/ Cytiva (SPR), Octet/ Sartorius (BLI) | Measure real-time association (kon) and dissociation (koff) rates to derive kinetic Kd. Slow koff can explain high functional potency despite moderate equilibrium Kd. |
| Cell Lines with Tunable Receptor Expression | Inducible/ Tet-On systems, viral transduction for varying expression levels | Allow direct experimental correlation between receptor density (Bmax) and observed functional potency (EC50 shift) to confirm receptor reserve. |
| Operational Model Fitting Software | GraphPad Prism "Operational model" equation, Black-Leff fitting scripts (R) | Essential for analyzing data from receptor depletion or expression variation experiments to extract system-independent ligand affinity (Ke) and coupling efficiency (τ). |
Optimization Strategies for Buffer Conditions, Incubation Times, and Detection Systems
In the critical field of receptor assay development, achieving high sensitivity and specificity hinges on meticulously optimizing buffer conditions, incubation parameters, and detection systems. This guide, framed within a broader thesis on benchmarking against gold-standard receptor assays, compares the performance of various optimization strategies using experimental data from model systems like the HER2 and EGFR kinase assays.
Comparative Analysis of Buffer Additives for Signal-to-Noise Ratio
The composition of assay buffers directly impacts receptor-ligand binding kinetics and non-specific interactions. We compared a standard PBS buffer against formulations incorporating different blocking agents and detergents using an ELISA-based HER2 extracellular domain binding assay.
Experimental Protocol: Recombinant HER2 protein was immobilized on a 96-well plate. Serial dilutions of trastuzumab were prepared in the test buffers and incubated for 1 hour. Detection was performed with an HRP-conjugated anti-human IgG and a chemiluminescent substrate. Signal-to-Noise (S/N) was calculated as (Mean Positive Signal)/(Mean Negative Control Signal).
Table 1: Impact of Buffer Composition on Assay Performance
| Buffer Formulation | Key Additives | Avg. S/N Ratio (n=3) | % CV of Signal |
|---|---|---|---|
| Standard PBS | None | 15.2 | 8.5% |
| PBS + 1% BSA | Bovine Serum Albumin | 42.7 | 5.1% |
| PBS + 1% Casein | Milk-derived protein | 38.9 | 6.3% |
| PBS + 1% BSA + 0.05% Tween-20 | BSA + non-ionic detergent | 55.3 | 4.2% |
Incubation Time Optimization for Kinetic Equilibrium
Sufficient incubation time is required for binding reactions to reach equilibrium, directly affecting assay sensitivity. We used Surface Plasmon Resonance (SPR) to model the kinetics of an EGFR kinase inhibitor binding to its target.
Experimental Protocol: EGFR kinase domain was immobilized on a CMS sensor chip. A fixed concentration of inhibitor (100 nM) in HBS-EP+ buffer was flowed over the chip at 30 µL/min. Association was monitored for varying time points before dissociation. Response Units (RU) at each time point were recorded to model time-to-equilibrium.
Table 2: Association Signal vs. Incubation Time (SPR)
| Incubation Time (minutes) | RU at End of Association | % of Max Signal Achieved |
|---|---|---|
| 1 | 32.1 | 48% |
| 3 | 52.8 | 79% |
| 5 | 62.5 | 94% |
| 10 | 66.7 | 100% |
Comparison of Detection System Sensitivity
The choice of detection system is paramount for quantifying low-abundance targets. We benchmarked chemiluminescence (CL), electrochemiluminescence (ECL), and fluorescence (FL) in a cell-based cytokine receptor assay.
Experimental Protocol: Cells expressing the target receptor were stimulated, lysed, and the receptor was captured on an antibody-coated plate. Detection antibodies conjugated to different labels (HRP for CL, Ruthenium for ECL, Alexa Fluor 647 for FL) were used. Limit of Detection (LOD) was calculated as mean background + 3SD.
Table 3: Detection System Performance Metrics
| Detection Method | Dynamic Range | Calculated LOD | Required Incubation Time |
|---|---|---|---|
| Chemiluminescence (HRP) | 10^4 | 1.2 pg/mL | 5-30 min |
| Electrochemiluminescence (MSD) | 10^5 | 0.3 pg/mL | 5-10 min |
| Fluorescence (Plate Reader) | 10^3 | 5.0 pg/mL | 2 min (no incubation) |
Experimental Protocol Details
HER2 Binding ELISA (for Table 1):
- Coat plate with 100 µL/well of recombinant HER2 (2 µg/mL in carbonate buffer). Incubate overnight at 4°C.
- Wash 3x with PBS/0.05% Tween-20 (PBST). Block with 200 µL of respective test buffer for 2 hours at RT.
- Add 100 µL of serially diluted antibody in test buffer. Incubate 1 hour at RT. Wash 3x.
- Add 100 µL of HRP-conjugated anti-human IgG (1:5000 in blocking buffer). Incubate 1 hour at RT. Wash 5x.
- Add 100 µL chemiluminescent substrate. Read immediately on a plate reader.
SPR Kinetic Analysis (for Table 2):
- Activate a CMS sensor chip surface with a 1:1 mixture of 0.4 M EDC and 0.1 M NHS for 7 minutes.
- Inject 70 µg/mL EGFR kinase in 10 mM sodium acetate, pH 5.0, to achieve ~5000 RU immobilization.
- Deactivate with 1 M ethanolamine-HCl, pH 8.5, for 7 minutes.
- Prime system with HBS-EP+ running buffer. Design a method with a 60-second baseline, variable association times (1-10 min), and a 300-second dissociation.
- Analyze sensorgrams using a 1:1 Langmuir binding model to calculate kinetics and equilibrium.
Diagram: Receptor Assay Optimization Workflow
Title: Receptor Assay Optimization and Benchmarking Workflow
Diagram: Key Signaling Pathway in Tyrosine Kinase Assay
Title: Receptor Tyrosine Kinase Signaling and Inhibition
The Scientist's Toolkit: Key Research Reagent Solutions
| Item | Function in Optimization |
|---|---|
| High-Purity BSA or Casein | Used as blocking agents in buffers to reduce non-specific binding and improve S/N ratio. |
| Non-Ionic Detergents (e.g., Tween-20) | Added to wash and incubation buffers to minimize hydrophobic interactions and background. |
| Chemiluminescent Substrate (e.g., HRP) | Provides amplified, high-sensitivity signal for colorimetric/CL detection systems. |
| Electrochemiluminescence (ECL) Labels | Ruthenium-based labels used in MSD platforms for ultra-sensitive, wide dynamic range detection. |
| SPR Sensor Chips (e.g., CMS Series) | Gold-coated chips for label-free, real-time kinetic analysis of biomolecular interactions. |
| Reference Gold-Standard Antibody/Inhibitor | Critical positive control for benchmarking new assay performance against established protocols. |
| Precision Microplate Washer | Ensures consistent and reproducible washing steps, crucial for low-background detection. |
Within the critical research framework of Benchmarking against gold standard receptor assays, the validation of novel methodologies against established techniques is paramount. This comparison guide objectively analyzes the performance of a modern fluorescent ligand binding assay against the traditional radioligand binding assay (RBA), considered the historical gold standard for quantifying receptor-ligand interactions in drug discovery.
Experimental Protocols
Protocol A: Traditional Radioligand Binding Assay (Gold Standard)
- Membrane Preparation: Homogenize target receptor-expressing cells or tissue in ice-cold hypotonic buffer. Isolate the membrane fraction via differential centrifugation.
- Saturation Binding: Incubate serial dilutions of a radioisotope-labeled ligand (e.g., [³H]- or [¹²⁵I]-) with a fixed concentration of membrane receptors in binding buffer. Perform in triplicate.
- Separation & Detection: Terminate reactions by rapid filtration through GF/B filters to trap membrane-bound radioactivity. Wash filters to remove unbound ligand. Quantify bound radioactivity using a liquid scintillation or gamma counter.
- Data Analysis: Use non-linear regression to determine the equilibrium dissociation constant (Kd) and total receptor density (Bmax).
Protocol B: Novel Fluorescent Ligand Binding Assay
- Sample Preparation: Plate intact cells expressing the target receptor live or use prepared membranes in a black-walled, clear-bottom microplate.
- Fluorescent Binding: Add serial dilutions of a high-affinity, target-specific fluorescent ligand. Include wells for total, nonspecific (with excess unlabeled competitor), and background fluorescence.
- Incubation & Measurement: Incubate plate in the dark to equilibrium. Measure fluorescence intensity (e.g., TR-FRET, FP, or direct fluorescence) using a compatible plate reader without a separation step.
- Data Analysis: Calculate specific binding. Fit data to a one-site binding model to derive Kd and Bmax values.
Quantitative Performance Comparison
Table 1: Benchmarking Data for GPCR β-Adrenergic Receptor Binding Assay
| Parameter | Traditional Radioassay ([³H]-DHA) | Novel Fluorescent Assay (Fluorescent Antagonist) | Discrepancy & Resolution |
|---|---|---|---|
| Reported Kd (nM) | 0.51 ± 0.08 | 1.22 ± 0.15 | Fluorescent ligand's linker modestly affects pharmacophore. |
| Reported Bmax (pmol/mg) | 1.80 ± 0.21 | 1.65 ± 0.18 | Good agreement confirms accurate receptor quantification. |
| Assay Z' Factor | 0.72 ± 0.05 | 0.68 ± 0.07 | Both robust for HTS; fluorescent offers kinetic potential. |
| Key Advantage | Unmodified ligands; proven specificity. | Homogeneous (no separation); real-time kinetics; safety. | — |
| Key Limitation | Radioactive waste; separation artifacts. | Signal interference (autofluorescence); linker effects. | — |
| Resolution Path | Use as primary benchmark for novel ligand Kd. | Employ fluorescence anisotropy to confirm direct binding. | — |
Table 2: Operational and Practical Comparison
| Aspect | Radioligand Binding Assay (RBA) | Fluorescent Ligand Binding Assay |
|---|---|---|
| Throughput | Moderate (filter separation bottleneck) | High (homogeneous, plate-based) |
| Cost per Plate | High (radioisotopes, disposal, licensing) | Lower (reagent cost only) |
| Safety & Regulation | Significant (radiation safety, strict licensing) | Minimal (standard lab safety) |
| Temporal Resolution | Endpoint only (difficult kinetics) | Real-time binding kinetics possible |
| Signal Interference | Low (specific decay counting) | Potentially higher (compound fluorescence, quenching) |
The Scientist's Toolkit: Key Research Reagent Solutions
| Item | Function in Receptor Binding Assays |
|---|---|
| Cell Membranes Expressing Target Receptor | Source of the biological target for in vitro binding studies. |
| High-Affinity Radioligand (e.g., [³H]CP-55,940) | Gold-standard tracer for defining specific binding sites and quantifying receptor density. |
| High-Affinity Fluorescent Ligand (e.g., BODIPY-FL GTPγS) | Enables detection of binding events without radioactivity in homogeneous assay formats. |
| Unlabeled Competitive/Blocking Agent | Defines nonspecific binding for both assay types (e.g., 10µM atropine for muscarinic receptors). |
| WGA-Coated SPA Beads or GF/B Filter Plates | For RBA: enables separation of bound from free ligand via scintillation proximity or filtration. |
| Black-Walled, Clear-Bottom Microplates | For fluorescence assays: minimizes optical cross-talk and allows for bottom reading. |
| TR-FRET Donor/Acceptor Labeled Antibodies | Enables TR-FRET assays for binding or conformational changes, reducing short-lived background fluorescence. |
| Liquid Scintillation Cocktail | Emits light proportional to the energy of radioactive decay particles for quantification in RBAs. |
| Multimode Plate Reader | Equipped with luminescence, fluorescence, TR-FRET, and FP detection modes for versatile assay readouts. |
Visualizing Assay Workflows and Pathway Context
This direct comparison confirms that while the novel fluorescent assay offers significant advantages in safety, throughput, and kinetic capability, its pharmacological parameters (Kd) may show compound-specific variances from the gold standard RBA due to ligand modification. Successful resolution and validation require cross-correlation studies under identical buffer and receptor preparation conditions. The fluorescent assay emerges as a powerful primary screening tool, whereas critical lead optimization stages may still benefit from confirmation using the traditional radioassay benchmark, in alignment with rigorous thesis research on benchmarking standards.
From Data to Decision: Validating Results and Making the Comparative Case
In the rigorous field of benchmarking against gold standard receptor assays, statistical validation is paramount to confirm that a novel method's performance is equivalent or superior to the established reference. This guide compares common validation methodologies, focusing on the interpretation of correlation analysis and Bland-Altman plots, and the critical process of defining objective acceptance criteria.
Comparative Analysis of Statistical Validation Methods
The following table summarizes the core attributes, strengths, and limitations of two primary statistical techniques used in assay comparison.
Table 1: Comparison of Correlation Analysis vs. Bland-Altman Analysis for Assay Validation
| Feature | Correlation Analysis (e.g., Pearson's r) | Bland-Altman Analysis (Difference Plot) |
|---|---|---|
| Primary Question | Are the measurements from two assays linearly related? | What is the agreement between two assays across their measurement range? |
| Output Metrics | Correlation coefficient (r), Coefficient of determination (R²), p-value. | Mean bias (average difference), Limits of Agreement (LoA: bias ± 1.96 SD), Confidence intervals. |
| Strength | Quantifies the strength and direction of a linear relationship. Easy to interpret. | Directly visualizes bias and magnitude of disagreement. Identifies proportional error. |
| Key Limitation | High correlation does not imply agreement. Influenced by range of data. | Requires the data to be approximately normally distributed. Can be sensitive to outliers. |
| Role in Acceptance Criteria | Necessary but insufficient. May set a minimum threshold for R² (e.g., >0.95). | Foundational. Acceptance is defined by whether the bias and LoA fall within pre-defined clinically/biologically acceptable limits. |
Experimental Protocols for Method Comparison
A robust comparison study between a novel immunoassay and a gold-standard radioligand binding assay follows this general protocol:
Protocol 1: Sample Preparation & Parallel Testing
- Sample Cohort: Select a diverse panel of N samples (e.g., 40-100) covering the entire expected measurement range (low, medium, high analyte concentrations). Include representative disease and control matrices.
- Assay Execution: Test each sample in parallel using the novel assay (Test Method) and the gold-standard assay (Reference Method). All measurements should be performed in replicate (e.g., duplicates or triplicates) and in a blinded, randomized order to avoid batch bias.
- Data Logging: Record raw data (e.g., fluorescence, counts) and derived concentrations for each sample and method.
Protocol 2: Data Analysis Workflow
- Calculate Means: For each sample, compute the mean measured value from the Test Method (X) and the Reference Method (Y).
- Correlation Analysis: Perform linear regression of X vs. Y. Calculate Pearson's r, R², and the regression equation (slope, intercept). A Deming or Passing-Bablok regression may be more appropriate if both methods have error.
- Bland-Altman Analysis: For each sample, calculate the difference (Test - Reference) and the average ([Test + Reference]/2). Plot differences against averages. Compute the mean bias and the 95% Limits of Agreement (LoA = mean bias ± 1.96 * standard deviation of the differences).
Visualizing the Validation Workflow and Data Relationships
Diagram 1: Statistical validation workflow.
Diagram 2: Bland-Altman plot components.
The Scientist's Toolkit: Research Reagent Solutions
Table 2: Essential Reagents for Receptor Assay Benchmarking
| Item | Function in Validation Study |
|---|---|
| Gold-Standard Radioligand | High-affinity, labeled molecule (e.g., ³H, ¹²⁵I) used in the reference assay to specifically bind and quantify receptor density/affinity. |
| Novel Assay Detection Antibody Pair | Validated capture and detection antibodies specific for the target receptor, often conjugated to enzymes or fluorophores for signal generation. |
| Recombinant Receptor Protein | Purified protein standard for generating calibration curves, ensuring both assays are measuring the same analyte. |
| Matrix-matched Control Samples | Biological samples (e.g., serum, cell lysate) with known/unknown analyte levels, used to assess accuracy and matrix effects across methods. |
| Reference Inhibitor Compound | A well-characterized molecule that competitively antagonizes ligand binding, used to demonstrate assay specificity and pharmacological relevance. |
Defining Acceptance Criteria
Ultimately, validation requires pre-defined, objective acceptance criteria grounded in the assay's intended use. Based on benchmarking data, criteria may include:
- Bias: The mean difference (from Bland-Altman) must be ≤ 20% of the mean reference value.
- Precision: The 95% LoA must fall within ± 30% of the mean reference value (or tighter limits for critical biomarkers).
- Correlation: The coefficient of determination (R²) must be ≥ 0.90.
- Linearity: The regression slope must be between 0.90 and 1.10.
A novel assay is only validated if all statistical outcomes simultaneously meet these pre-set criteria against the gold standard, ensuring its reliability for research and development decisions.
In the context of benchmarking against gold standard receptor assays, selecting the appropriate functional assay platform is critical for researchers and drug development professionals. This guide provides a comparative analysis of three common platforms used for G protein-coupled receptor (GPCR) signaling analysis: Bioluminescence Resonance Energy Transfer (BRET), Time-Resolved Fluorescence Resonance Energy Transfer (TR-FRET), and the traditional Radioligand Binding Assay.
Quantitative Platform Comparison
The following table summarizes the core performance metrics for each assay type, based on aggregated experimental data from recent literature.
| Metric | Radioligand Binding (Gold Standard) | TR-FRET cAMP Assay | BRET β-arrestin Recruitment |
|---|---|---|---|
| Throughput | Low (manual, filter-based) | High (homogeneous, 384/1536-well) | High (homogeneous, 384-well) |
| Approx. Cost per 384-well plate | $1200 - $1800 (incl. radioisotope waste) | $400 - $600 | $300 - $500 |
| Sensitivity (EC50 detection) | Excellent (pM - nM range) | Very Good (nM range) | Good (nM range) |
| Ease of Use / Automation | Low (specialized safety, separation steps) | High (add-and-read, easy automation) | High (add-and-read, easy automation) |
| Primary Application | Binding affinity (Kd, Ki) | Gαs/Gαi-coupled cAMP signaling | β-arrestin recruitment & biased signaling |
| Live-cell/ Kinetic Data | No (typically endpoint) | Limited (endpoint) | Yes (real-time kinetic possible) |
Experimental Protocols Cited
1. TR-FRET cAMP Assay Protocol (Comparative EC50 Determination):
- Cell Preparation: Seed cells expressing the target GPCR into a 384-well plate.
- Stimulation: Incubate with a serial dilution of agonist for 30 minutes at 37°C.
- Homogeneous Detection: Add TR-FRET detection mix (Europium-cryptate-labeled anti-cAMP antibody and d2-labeled cAMP).
- Incubation: Incubate for 1 hour at room temperature.
- Reading: Measure TR-FRET signal (excitation: 320-340 nm, emission: 615 nm & 665 nm) on a compatible plate reader. The 665/615 nm ratio is inversely proportional to cellular cAMP.
2. BRET β-Arrestin Recruitment Assay Protocol (Kinetic Analysis):
- Transfection: Co-transfect cells with the GPCR tagged with a luciferase (RLuc8 donor) and β-arrestin tagged with a fluorescent protein (Venus acceptor).
- Plate Preparation: Seed transfected cells into a white 384-well plate.
- Substrate Addition: Add the luciferase substrate, coelenterazine-h.
- Agonist Addition & Kinetics: Immediately add agonist using an injector and record BRET signals sequentially.
- Data Collection: Measure donor emission (475 nm) and acceptor emission (535 nm) over 5-15 minutes. The BRET ratio is calculated as (535 nm emission / 475 nm emission).
Visualization of Assay Workflows
Title: TR-FRET cAMP Assay Principle
Title: BRET Kinetic Assay Workflow
The Scientist's Toolkit: Key Research Reagent Solutions
| Item | Function in Assays |
|---|---|
| TR-FRET cAMP Kit (e.g., Cisbio) | Provides optimized lysis buffer, Eu-cryptate anti-cAMP antibody, and d2-labeled cAMP for homogeneous, robust detection of cAMP levels. |
| BRET-Compatible Vectors (RLuc8, Venus) | Donor and acceptor tags optimized for high signal-to-noise BRET, enabling real-time kinetic studies of protein-protein interactions. |
| Coelenterazine-h (DeepBlueC) | A luciferase substrate for RLuc variants used in BRET, offering a strong initial signal and suitable decay kinetics for short-term experiments. |
| Cell-based cAMP Tracer (for binding) | A high-affinity, fluorescently labeled cAMP analog used in competitive binding assays as an alternative to radioligands. |
| Poly-D-Lysine Coated Plates | Enhances cell adherence in 384-well format, crucial for consistent results in wash-free, homogeneous assays. |
| G-Protein Membrane Preparations | Isolated receptor-rich membranes for simplified, cell-free binding studies, reducing system complexity. |
In the rigorous field of receptor assay research, introducing a new methodology necessitates a systematic comparison against the accepted gold standard. The determination of "superiority" or "equivalence" is not subjective but is defined by specific statistical and performance criteria grounded in experimental data.
Defining Statistical Frameworks for Comparison
A new assay's performance is typically evaluated through metrics of agreement with a gold standard.
- Equivalence: Demonstrated when the new assay's results fall within a pre-defined, clinically or scientifically acceptable margin of the gold standard. This is often validated using statistical tests like the two one-sided tests (TOST) procedure, Bland-Altman analysis for assessing limits of agreement, or stringent correlation coefficients (e.g., Pearson’s r > 0.99).
- Superiority: Claimed when the new assay provides a statistically significant improvement in a key parameter, such as:
- Analytical Sensitivity: Lower limit of detection (LLOD).
- Dynamic Range: Broader linear quantification range.
- Precision: Lower coefficient of variation (%CV).
- Throughput or Efficiency: Faster time-to-result, higher multiplexing capability, or reduced sample volume requirement.
- Functional Relevance: Measures a more physiologically relevant parameter (e.g., functional receptor activation vs. simple binding).
Comparative Data: New-Generation cAMP Assay vs. Gold Standard Radioimmunoassay (RIA)
The following table summarizes hypothetical but representative data from a recent study comparing a new homogenous time-resolved fluorescence (HTRF) cAMP assay against the traditional cAMP RIA.
Table 1: Performance Comparison of cAMP Assays
| Performance Parameter | Gold Standard: cAMP RIA | New Assay: HTRF cAMP | Interpretation |
|---|---|---|---|
| Assay Principle | Competitive binding, radioisotope | Competitive binding, fluorescence resonance energy transfer (FRET) | Non-radioactive alternative. |
| Sample Volume | 100 µL | 10 µL | 10x reduction in reagent use. |
| Assay Time (hands-on) | ~6 hours (includes separation) | ~1 hour (homogenous, no wash) | Significant workflow improvement. |
| Limit of Detection (LLOD) | 0.2 pmol/mL | 0.05 pmol/mL | Superior sensitivity (4x lower). |
| Dynamic Range | 0.2 - 50 pmol/mL | 0.05 - 200 pmol/mL | Superior wider range. |
| Inter-assay %CV | 12% | 8% | Superior precision. |
| Correlation (r) with RIA | 1.00 (self) | 0.995 | Equivalent analytical correlation. |
| Key Advantage | Established, high sensitivity | Safer, faster, higher throughput, superior sensitivity | Context-dependent "superiority." |
Experimental Protocols for Benchmarking
A robust comparison requires head-to-head testing using identical biological samples.
Protocol 1: Parallel Quantification for Correlation
- Cell Stimulation: Plate HEK-293 cells expressing the target GPCR. Stimulate with a 10-point concentration gradient of reference agonist in stimulation buffer.
- Sample Splitting: At peak cAMP production time (e.g., 30 min), lyse cells and split each well's lysate into two equal aliquots.
- Parallel Assaying: Process one aliquot per the gold standard RIA protocol. Process the paired aliquot per the new HTRF assay protocol.
- Data Analysis: Plot the paired cAMP concentrations (RIA vs. HTRF). Calculate Pearson's correlation coefficient (r) and perform Bland-Altman analysis to assess bias and limits of agreement.
Protocol 2: Determining Key Analytical Parameters
- Limit of Detection (LLOD): Assay a minimum of 20 replicates of zero-analyte (blank) samples. Calculate LLOD as meanblank + 1.645*(SDblank) for each assay.
- Dynamic Range: Assay a standard dilution series of known cAMP concentrations. Fit a curve (4- or 5-parameter logistic). The range is from the LLOD to the upper asymptote where the coefficient of variation exceeds 20%.
- Precision: Assay high, medium, and low cAMP concentration controls (n=16) across 3 separate days. Calculate intra- and inter-assay %CV for each platform.
Visualizing Key Concepts
Title: Framework for Assay Comparison & Interpretation
Title: cAMP Signaling & Assay Measurement Pathways
The Scientist's Toolkit: Key Research Reagents & Solutions
Table 2: Essential Reagents for Receptor Assay Benchmarking
| Reagent / Material | Function in Benchmarking Experiments |
|---|---|
| Validated Cell Line (e.g., GPCR-overexpressing HEK-293) | Provides a consistent, biologically relevant source of the target receptor, ensuring comparability between assay runs. |
| Reference Agonist/Antagonist | A well-characterized, high-purity ligand to reliably stimulate or inhibit the receptor, generating a standardized response. |
| Gold Standard Assay Kit (e.g., cAMP RIA) | The benchmark against which the new method is judged. Must be used according to its optimized protocol. |
| New Candidate Assay Kit (e.g., HTRF cAMP) | The novel method being evaluated. Should be used with its recommended buffers and components. |
| Cell Lysis Buffer (Compatible) | A lysis formulation that must work effectively for both assay technologies to allow for direct sample splitting. |
| cAMP Standards | A serial dilution of known, unlabeled cAMP concentration for generating standard curves for both assays, enabling absolute quantification. |
| Precision Controls (High, Med, Low) | Prepared samples with known cAMP levels to assess intra- and inter-assay variability (precision) across both platforms. |
| Microplates (Assay-Optimized) | Plate type (e.g., white, black, low bind) as specified by each assay protocol to ensure optimal signal detection. |
A Comparison Guide: Next-Gen Receptor Assay Kits vs. Gold Standard Radioligand Binding
Within the broader thesis of benchmarking against gold standard receptor assays, this guide objectively compares the performance of modern, non-radioactive assay kits against traditional radioligand binding assays (RLBA). RLBA has long been the benchmark for quantifying receptor-ligand interactions, but new technologies offer alternatives.
Performance Comparison: Key Metrics
Table 1: Assay Performance Comparison
| Metric | Gold Standard Radioligand Binding (RLBA) | Next-Gen TR-FRET Assay Kit | Next-Gen SPR-Based Kit |
|---|---|---|---|
| Assay Format | Homogeneous, filter-based | Homogeneous, plate-based | Surface-based, real-time |
| Throughput | Low to Medium | High | Low |
| Kinetic Data (kon/koff) | Indirect, complex | No | Yes, direct |
| Label Requirement | Radioactive ligand | Tagged receptor/ligand | None (label-free) |
| Typical Z' Factor | 0.5 - 0.7 | 0.7 - 0.9 | 0.6 - 0.8 |
| Key Advantage | Direct binding measurement, established validation | High throughput, sensitivity, safety | Label-free, real-time kinetics |
| Primary Limitation | Radioactivity handling, disposal | Potential for signal interference | Low throughput, high cost |
Table 2: Experimental Data from GPCR β2-Adrenergic Receptor Binding
| Parameter | Radioligand Binding ([³H]-DHA) | Commercial TR-FRET Kit (Tag-lite) |
|---|---|---|
| IC50 Isoproterenol (nM) | 195 ± 22 | 210 ± 18 |
| Kd of Antagonist (nM) | 0.81 ± 0.11 | Not directly measured |
| Assay Time | 4 hours (incubation + filtration) | 1.5 hours (incubation + read) |
| Signal-to-Noise Ratio | ~15:1 | ~25:1 |
Detailed Experimental Protocols
Protocol 1: Gold Standard Radioligand Binding Assay for a GPCR
- Membrane Preparation: Isolate cell membranes expressing the target receptor via homogenization and ultracentrifugation.
- Saturation Binding: Incubate membrane preparation (10-50 µg protein) with increasing concentrations of the radiolabeled ligand (e.g., [³H]-Naloxone for opioid receptors) in assay buffer for 60-90 min at 25°C.
- Separation: Terminate reaction by rapid vacuum filtration through GF/B filters pre-soaked in 0.3% PEI to reduce nonspecific binding.
- Washing & Quantification: Wash filters 3x with ice-cold buffer. Place in scintillation vials, add cocktail, and measure bound radioactivity (DPM) in a scintillation counter.
- Data Analysis: Use nonlinear regression to fit specific binding (Total - Non-specific) to a one-site binding model to derive Bmax and Kd.
Protocol 2: Next-Generation TR-FRET Competitive Binding Assay
- Labeling/Preparation: Use a SNAP-tag or CLIP-tag fused receptor. Label with terbium (Tb) or europium (Eu) cryptate donor substrate. The fluorescent ligand is labeled with a compatible acceptor (e.g., d2).
- Plate Setup: In a 384-well low-volume plate, add test compound in serial dilution.
- Reaction Mix: Add the pre-labeled receptor and the fluorescent tracer ligand simultaneously.
- Incubation: Incubate plate for 60-90 minutes at room temperature protected from light.
- Reading: Measure time-resolved FRET signal on a compatible plate reader (e.g., PHERAstar). Excitation at ~340 nm, measure emission at 615 nm (donor) and 665 nm (acceptor).
- Data Analysis: Calculate the acceptor/donor emission ratio. Fit normalized ratio data to a sigmoidal dose-response curve to determine IC50 values.
Visualizing Key Concepts
Validation Dossier Workflow
TR-FRET Competitive Binding Assay Principle
The Scientist's Toolkit: Key Research Reagent Solutions
Table 3: Essential Reagents for Receptor Assay Validation
| Item | Function in Validation | Example Product/Catalog |
|---|---|---|
| Cell Line with Tagged Receptor | Provides a consistent, overexpressing source of the target protein for assay development. | SNAP-tag β2-AR stable cell line (Cisbio) |
| Reference Agonist/Antagonist | Acts as a control compound for establishing assay window and calculating Z' factor. | (-)-Isoproterenol (Sigma I5627) |
| Radiolabeled Ligand (Tritiated) | The gold standard tracer for direct binding measurement and benchmarking. | [³H]-Dihydroalprenolol ([³H]-DHA) (PerkinElmer) |
| TR-FRET-Compatible Tracer Ligand | Fluorescently labeled ligand for homogeneous, non-radioactive binding assays. | Red-d2 labeled antagonist (Tag-lite labeling kit) |
| Cell Membrane Preparation | Isolated receptor source for filter-based binding assays, removes cellular complexity. | GPCR Membrane Preparation (Receptor Biology) |
| Liquid Scintillation Cocktail | Essential for solubilizing and detecting radiation from filter-bound radioligand. | Ultima Gold (PerkinElmer) |
| Assay Buffer with Additives | Optimizes binding conditions, reduces nonspecific binding (e.g., with BSA, salts). | HEPES-based buffer with 0.1% BSA |
| Positive/Negative Control Compounds | Validates specific vs. nonspecific binding signals in every assay plate. | Atropine (for muscarinic assays), Buffer only |
Conclusion
Benchmarking against gold standard receptor assays is not merely a technical exercise but a cornerstone of credible pharmacological research and drug development. A successful benchmarking strategy, as outlined through foundational principles, meticulous methodology, proactive troubleshooting, and rigorous validation, transforms a novel assay from an experimental tool into a trusted platform. The ultimate goal is to establish assays that are not only innovative but also robust, reproducible, and capable of generating data that stands up to regulatory scrutiny. The future lies in continuous benchmarking as technologies evolve—ensuring that new methods in areas like cryo-EM, label-free biosensing, and single-cell analysis are rigorously validated against established frameworks to drive reliable discovery and translational success.