Streamlining High-Throughput Glycobiology: A Complete 96-Well Plate Workflow for IgG N-Glycan Analysis
This article provides a comprehensive guide to implementing a robust, high-throughput 96-well plate workflow for the analysis of immunoglobulin G (IgG) N-glycosylation.
Streamlining High-Throughput Glycobiology: A Complete 96-Well Plate Workflow for IgG N-Glycan Analysis
Abstract
This article provides a comprehensive guide to implementing a robust, high-throughput 96-well plate workflow for the analysis of immunoglobulin G (IgG) N-glycosylation. It covers foundational principles linking glycan structures to therapeutic antibody function and disease biomarkers. A detailed, step-by-step methodological protocol from sample preparation to data acquisition is presented, alongside critical troubleshooting and optimization strategies to ensure reproducibility. Finally, the workflow is validated through comparative analysis with traditional methods, highlighting its advantages in throughput, precision, and scalability for drug development and clinical research applications.
The Critical Role of IgG Glycosylation: From Biological Function to Biomarker Discovery
Core IgG N-Glycan Structures and Associated Effector Functions
The N-linked glycans attached to the conserved Asn297 of the IgG Fc domain are critical modulators of antibody effector functions. The core structures and their functional impacts are summarized below.
Table 1: Core IgG Fc N-Glycan Structures and Functional Correlates
| Glycan Feature | Core Structure Example | Impact on Effector Function | Quantitative Change in ADCC/CDC/ Half-life |
|---|---|---|---|
| Afucosylated | G0, G1, G2 (lacking core fucose) | Dramatically enhanced FcγRIIIa (CD16a) binding and ADCC | ADCC potency increased by 10-100x compared to fucosylated variants. |
| Galactosylation | G1 (mono), G2 (di-galactosylated) | Modulates CDC via enhanced C1q binding; may influence anti-inflammatory activity. | G2 forms show ~20-50% increase in C1q binding compared to G0. |
| Bisecting GlcNAc | Addition of β1,4-GlcNAc to core mannose | Enhances ADCC, particularly in combination with afucosylation. | Synergy with afucosylation can increase FcγRIIIa affinity by up to ~40x over fucosylated, non-bisected. |
| Sialylation | α2,6-sialylation on galactose | Promotes an anti-inflammatory phenotype; reduces ADCC/CDC. | Sialylated forms can reduce pro-inflammatory effector functions by >70% in some assays. |
| High Mannose | Man5, Man6, Man7, Man8, Man9 | Generally enhanced ADCP and faster serum clearance. | Man5 shows ~3-5x higher clearance rate in mice compared to complex-type glycans. |
Application Notes: Integration into a 96-Well Plate IgG N-Glycan Analysis Workflow
A high-throughput, 96-well plate-based workflow is essential for screening glycoengineered antibody libraries or profiling clinical samples. This integrated approach allows for parallel sample processing from IgG capture to glycan data interpretation.
Key Advantages of the 96-Well Format:
- Scalability: Enables simultaneous processing of 96 samples (e.g., cell culture supernatants, serum samples, purified antibody variants).
- Reproducibility: Minimizes technical variance through uniform processing steps.
- Automation Compatibility: Ideal for liquid handling robots, increasing throughput and reducing manual labor.
- Data Integration: Facilitates direct correlation of glycan profiles with functional assay data performed in parallel plate formats.
Detailed Protocols
Protocol 1: 96-Well Plate-Based IgG Capture and Denaturation Objective: To isolate and prepare IgG Fc N-glycans from multiple samples in parallel. Materials: 96-well protein A/G affinity plate, PBS (pH 7.4), 100 mM ammonium bicarbonate (AMBIC) buffer, 1M dithiothreitol (DTT), 8M guanidine hydrochloride (GuHCl), vacuum manifold or plate centrifuge.
Procedure:
- IgG Binding: Apply 50-100 µL of sample (culture supernatant, serum diluted 1:100, or purified IgG at 0.1-1 mg/mL) to each well of a protein A/G plate. Incubate for 1 hour at room temperature (RT) with gentle shaking.
- Washing: Apply vacuum or centrifugation to remove liquid. Wash wells 3x with 200 µL PBS.
- Denaturation & Reduction: Add 50 µL of denaturation/reduction solution (8M GuHCl, 10 mM DTT in 100 mM AMBIC) to each well. Seal plate and incubate at 65°C for 30 minutes.
- Alkylation: Cool plate. Add 10 µL of 25 mM iodoacetamide (in 100 mM AMBIC) to each well. Incubate in the dark at RT for 30 minutes.
Protocol 2: On-Plate PNGase F Release and Glycan Cleanup Objective: To enzymatically release N-glycans and prepare them for labeling. Materials: PNGase F (recombinant, glycerol-free), 1% formic acid (FA), hydrophilic interaction liquid chromatography (HILIC) µElution 96-well plate, vacuum manifold, acetonitrile (ACN), water.
Procedure:
- Enzymatic Release: Neutralize the alkylation reaction by adding 10 µL of 1% FA. Add 2 µL (≥5 units) of PNGase F in 48 µL of 100 mM AMBIC to each well. Incubate at 37°C overnight (~16 hours).
- Glycan Binding: Transfer the entire release mixture to a HILIC µElution plate pre-equilibrated with 200 µL 95% ACN/1% FA. Apply vacuum slowly.
- Washing: Wash plate 3x with 100 µL of 95% ACN/1% FA under vacuum.
- Elution: Elute glycans with 2 x 25 µL of ultrapure water into a clean 96-well collection plate. Combine eluates and dry in a centrifugal vacuum concentrator.
Protocol 3: 2-AB Labeling and HILIC-UPLC Analysis Objective: To fluorescently label glycans and separate them by hydrophilicity for profiling. Materials: 2-aminobenzamide (2-AB) labeling kit (e.g., LudgerTag), dimethyl sulfoxide (DMSO), acetic acid, HILIC-UPLC system (e.g., Waters ACQUITY BEH Glycan column).
Procedure:
- Labeling: Reconstitute dried glycans in 5 µL of 2-AB labeling solution (prepared per kit instructions). Incubate at 65°C for 2 hours.
- Cleanup: Use the provided cleanup cartridges or a fresh HILIC µElution plate to remove excess label. Bind glycans in 95% ACN, wash, and elute in water.
- HILIC-UPLC: Inject labeled glycans onto a BEH Glycan column (1.7 µm, 2.1 x 150 mm) at 60°C. Use a gradient from 70% to 53% Buffer B (50 mM ammonium formate, pH 4.5) in Buffer A (100% ACN) over 25 min at 0.4 mL/min.
- Data Analysis: Detect fluorescence (Ex: 330 nm, Em: 420 nm). Identify peaks using a dextran ladder (GU values) and quantitative profile using appropriate software (e.g., Empower, Chromeleon). Express results as relative percentage abundances.
Visualizations
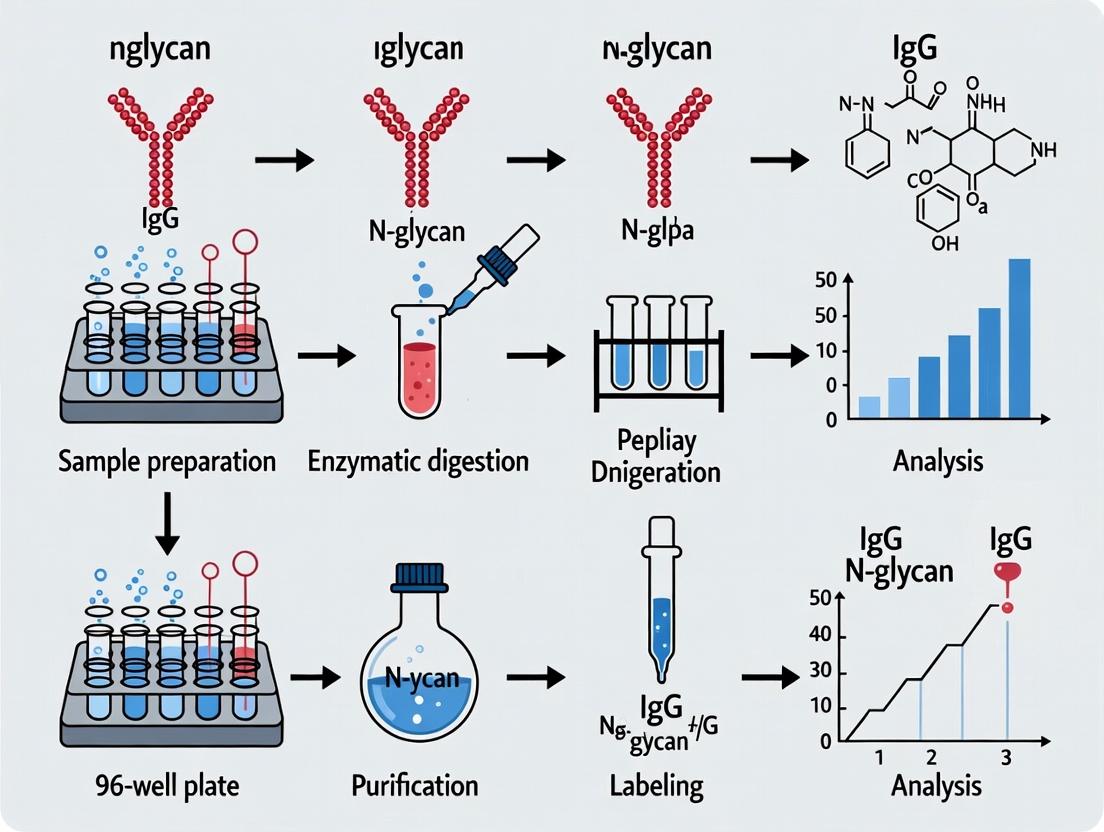
Title: 96-Well IgG N-Glycan Analysis Workflow
Title: IgG N-Glycan Features Drive Effector Functions
The Scientist's Toolkit: Key Research Reagent Solutions
Table 2: Essential Materials for 96-Well Plate IgG N-Glycan Analysis
| Item | Function/Application | Example Vendor/Product |
|---|---|---|
| Protein A/G 96-Well Plate | High-throughput, affinity-based capture of IgG from complex matrices. | Thermo Fisher Pierce Protein A/G Plate. |
| Recombinant PNGase F | Enzymatically cleaves intact N-glycans from IgG Fc for analysis. | Promega, Glyko or New England Biolabs (glycerol-free recommended). |
| HILIC µElution 96-Well Plate | For rapid cleanup and concentration of released glycans prior to labeling. | Waters MassTrak HILIC µElution Plate. |
| 2-AB Labeling Kit | Provides optimized reagents for fluorescent glycan tagging. | LudgerTag 2-AB Labeling Kit. |
| HILIC-UPLC Glycan Column | High-resolution separation of labeled glycans based on hydrophilicity. | Waters ACQUITY UPLC BEH Glycan Column. |
| Glycan Mobility Standard | Dextran ladder for assigning Glucose Unit (GU) values to identify peaks. | Waters MassTrak GU Standard. |
| Glycan Analysis Software | Software for processing, identifying, and quantifying glycan peaks. | Waters Empower or Agilent OpenLab. |
| Automated Liquid Handler | For precise, high-throughput reagent transfer and plate washing. | Beckman Coulter Biomek or Tecan Fluent. |
Glycosylation as a Critical Quality Attribute (CQA) for Therapeutic Monoclonal Antibodies (mAbs)
The glycosylation profile of therapeutic monoclonal antibodies is a Critical Quality Attribute (CQA) with direct impact on efficacy, safety, pharmacokinetics, and immunogenicity. Within the context of a thesis on high-throughput 96-well plate workflows for IgG N-glycan analysis, this document provides detailed application notes and protocols for robust and rapid glycan characterization, essential for upstream process development and downstream Quality Control.
Application Notes: The Impact of Glycosylation on mAb Function
Table 1: Impact of Key IgG Fc Glycan Structures on Therapeutic Function
| Glycan Feature | Effect on Effector Function (ADCC/CDC) | Impact on Pharmacokinetics | Immunogenicity Risk |
|---|---|---|---|
| Core Fucosylation | ↓ ADCC (blocks FcyRIIIA binding) | Minimal effect | Low |
| Terminal Galactose | ↑ CDC (enhances C1q binding) | Minimal effect | Low (non-galactosylated may be immunogenic in some cases) |
| Bisecting GlcNAc | ↑ ADCC (synergistic with afucosylation) | Minimal effect | Low |
| High Mannose | ↑ ADCC (via mannose receptor clearance) | ↓ Serum half-life | Potential risk (may elicit anti-carbohydrate antibodies) |
| Sialylation | ↓ Inflammation (anti-inflammatory activity) | Potential modest effect | Low (can mask immunogenic epitopes) |
Table 2: Common Process Parameters Affecting Glycosylation in Bioreactors
| Process Parameter | Typical Target for Control | Observed Effect on Glycan Profile (e.g., G0F, G1F, G2F) |
|---|---|---|
| pH | 6.8 - 7.2 | Shift outside range can increase high mannose and heterogeneity. |
| Dissolved Oxygen | 20-60% | Lower DO can reduce galactosylation. |
| Temperature | 32-37°C (production) | Lower temp (e.g., 33°C) often ↑ Galactosylation & Sialylation. |
| Ammonium Level | < 5 mM | High ammonium ↓ Glycan branching & processing. |
| Feed Strategy | Optimized bolus/perfusion | Nutrient availability directly impacts nucleotide sugar donor pools. |
Protocols for 96-Well Plate Based N-Glycan Analysis
Protocol 1: High-Throughput IgG Purification and Denaturation (Protein A MagBead Workflow)
Objective: Isolate IgG from cell culture supernatant in a 96-well plate format. Materials: Protein A magnetic beads, 96-well deep well plate, magnetic plate stand, phosphate-buffered saline (PBS), neutralization buffer, denaturation buffer (1-2% SDS). Procedure:
- Equilibration: Transfer 50 µL of Protein A magnetic bead suspension to each well. Place on magnetic stand, discard supernatant. Wash beads twice with 200 µL PBS.
- Binding: Add 100-500 µL of clarified cell culture supernatant to beads. Seal plate and incubate with shaking for 15 min at room temperature.
- Washing: Place plate on magnetic stand. Discard supernatant. Wash beads twice with 200 µL PBS.
- Elution: Add 50 µL of low-pH elution buffer (e.g., 0.1 M Glycine, pH 2.7). Incubate for 2 min. Place on magnet and transfer acidic eluate to a new plate containing 10 µL neutralization buffer (1 M Tris-HCl, pH 9.0).
- Denaturation: Add 10 µL of denaturation buffer (final SDS ~0.5%) to the neutralized eluate. Heat at 65°C for 10 min. Proceed to deglycosylation.
Protocol 2: Enzymatic Release and Fluorescent Labeling of N-Glycans
Objective: Release and label glycans with a fluorescent tag for sensitive detection. Materials: Rapid PNGase F enzyme (in-gel or in-solution), Rapid PNGase F buffer, 96-well PCR plate, fluorescent label (e.g., 2-AA, 2-AB), labeling reagent (sodium cyanoborohydride), non-reductive labeling buffer. Procedure:
- Deglycosylation: Add 5 µL of Rapid PNGase F buffer and 1 µL of Rapid PNGase F to the 60 µL denatured sample from Protocol 1. Mix and incubate in a PCR thermocycler at 50°C for 10-15 min.
- Labeling: Transfer released glycans to a new plate (protein precipitates). Add 25 µL of labeling mixture (2-AB dye in 70:30 DMSO:Glacial Acetic Acid with sodium cyanoborohydride). Seal plate.
- Incubation: Heat at 65°C for 2 hours.
- Clean-up: Using a hydrophilic interaction liquid chromatography (HILIC) µElution plate (e.g., Waters GlycoWorks HILIC µElution plate), purify labeled glycans according to manufacturer's instructions. Elute in 50 µL water or acetonitrile/water for analysis.
Protocol 3: HILIC-UPLC/Fluorescence Profiling and Data Analysis
Objective: Separate and quantify fluorescently labeled N-glycans. Materials: Acquity UPLC BEH Glycan column (1.7 µm, 2.1 x 150 mm), 96-well sample plate compatible with autosampler, HILIC mobile phases (A: 50 mM ammonium formate pH 4.4, B: Acetonitrile). UPLC Method:
- Column Temp: 60°C
- Flow Rate: 0.4 mL/min
- Gradient: 70-53% B over 25 min.
- Detection: Fluorescence (Ex: 330 nm, Em: 420 nm for 2-AB). Data Analysis:
- Integrate all peaks in the chromatogram.
- Identify peaks by comparison to an external glucose unit (GU) ladder derived from hydrolyzed dextran.
- Express the relative percentage of each glycan as (Peak Area / Total Integrated Area) x 100%.
- Report major glycoforms (G0F, G1F, G2F, Man5, etc.) in a summary table.
Visualizations
Diagram 1: 96-Well Plate N-Glycan Analysis Workflow
Diagram 2: mAb Glycosylation CQA Relationships
The Scientist's Toolkit: Research Reagent Solutions
Table 3: Essential Reagents for 96-Well IgG N-Glycan Analysis
| Item | Function in Workflow | Key Consideration |
|---|---|---|
| Protein A Magnetic Beads | High-throughput, plate-based capture and purification of IgG from supernatant. | Choose beads with high binding capacity and compatibility with automation. |
| Rapid PNGase F | Enzymatically cleaves N-glycans from the antibody backbone for analysis. | "Rapid" formulation enables deglycosylation in minutes vs. hours. |
| Fluorescent Dye (2-AB/2-AA) | Labels released glycans for highly sensitive fluorescence detection. | 2-AB is common for UPLC; choice dictates excitation/emission filters. |
| HILIC µElution Plate | Purifies labeled glycans by solid-phase extraction, removing excess dye and salts. | Critical for clean chromatograms and reproducible retention times. |
| BEH Glycan UPLC Column | Separates labeled glycans by hydrophilic interaction liquid chromatography (HILIC). | 1.7 µm particle size provides high-resolution separation. |
| Glucose Unit (GU) Ladder | Standard for calibrating retention times to identify glycan structures. | Typically derived from hydrolyzed dextran, run alongside samples. |
| Reference mAb | Well-characterized antibody with known glycan profile for system suitability. | Used to qualify the entire analytical workflow. |
IgG Glycan Profiles as Biomarkers in Chronic Inflammatory Diseases and Cancer
Immunoglobulin G (IgG) N-glycosylation is a critical post-translational modification that influences antibody structure and effector functions. Proinflammatory and anti-inflammatory states in chronic diseases and cancer are reflected in specific alterations to the IgG glycome. These alterations make IgG glycan profiles promising biomarkers for disease diagnosis, prognosis, and monitoring therapeutic response. This application note details a robust, high-throughput 96-well plate workflow for the analysis of IgG N-glycans, enabling scalable research and clinical applications.
Key Glycan Biomarkers and Associated Diseases
Quantitative changes in specific IgG glycans correlate with disease activity and progression. The table below summarizes key biomarkers.
Table 1: IgG Glycan Biomarkers in Chronic Inflammation and Cancer
| Glycan Feature (Abbreviation) | Change in Disease | Associated Condition(s) | Proposed Biological Role / Correlation |
|---|---|---|---|
| Agalactosylation (G0) | Increase | Rheumatoid Arthritis (RA), Crohn's Disease, Ulcerative Colitis (UC), SLE | Correlates with disease activity; promotes pro-inflammatory IgG effector functions. |
| Galactosylation (G1/G2) | Decrease | RA, IBD, SLE, Cancers (e.g., ovarian, colorectal) | Reduced anti-inflammatory activity; associated with worse prognosis in cancer. |
| Sialylation (S) | Decrease | RA, Juvenile Idiopathic Arthritis, Lupus | Loss of anti-inflammatory activity via reduced engagement of inhibitory sialic acid receptors. |
| Core Fucosylation (F) | Increase | Hepatocellular Carcinoma, Pancreatic Cancer, Melanoma | Modulates Antibody-Dependent Cellular Cytotoxicity (ADCC); impacts efficacy of therapeutic antibodies. |
| Bisecting N-acetylglucosamine (GlcNAc) (B) | Increase | Ovarian Cancer, Glioblastoma | Associated with tumor progression and metastatic potential. |
| High-Mannose Glycans (M5-M9) | Increase | Colorectal Cancer, Autoimmune Diseases | Linked to aberrant cellular processing and endoplasmic reticulum stress. |
96-Well Plate IgG N-Glycan Release, Labeling, and Analysis Protocol
This protocol is designed for the high-throughput analysis of serum or plasma IgG glycans.
Materials & Reagents (The Scientist's Toolkit)
Table 2: Key Research Reagent Solutions for 96-Well IgG N-Glycan Analysis
| Item | Function/Brief Explanation |
|---|---|
| 96-Well Protein A/G Plate | High-affinity capture of IgG from complex biological samples (serum/plasma) in a plate format. |
| PNGase F (Recombinant) | Enzyme that releases N-linked glycans from the IgG Fc region. |
| 2-AB (2-Aminobenzamide) | Fluorescent label for glycan derivatization, enabling sensitive detection by UHPLC/CE-LIF. |
| Hydrophilic Interaction Liquid Chromatography (HILIC) UHPLC Column (e.g., BEH Amide) | Core column chemistry for separating labeled glycans based on hydrophilicity. |
| Glycan Hydrophilic Interaction Liquid Chromatography (HILIC) Eluents | Acetonitrile and volatile ammonium formate buffer for optimal HILIC separation. |
| Glycan Reference Standard (GLYKO or equivalent) | Dextran ladder or known glycan standard for creating a glucose unit (GU) calibration curve. |
| Dimethyl Sulfoxide (DMSO) | Solvent for the 2-AB labeling reaction. |
| Sodium Cyanoborohydride | Reducing agent for the reductive amination labeling reaction. |
Detailed Protocol
Day 1: IgG Capture and Release
- IgG Capture: Pipette 10 µL of serum/plasma (diluted 1:10 in PBS) into each well of a Protein A/G 96-well plate. Seal and incubate with shaking (500 rpm) for 2 hours at room temperature.
- Washing: Aspirate and wash wells 5x with 200 µL PBS using a plate washer.
- On-Plate Denaturation & Release: Add 50 µL of a solution containing 1% SDS (w/v) in PBS to each well. Incubate 10 min at 60°C. Cool to RT. Add 50 µL of a solution containing 2.5% Igepal CA-630 (v/v) and 50 U PNGase F in PBS. Seal plate, incubate overnight (16-18 hours) at 37°C with shaking.
Day 2: Glycan Labeling and Clean-up
- Glycan Collection: Centrifuge plate at 1000 x g for 5 min to collect released glycans into a fresh, labeled 96-well collection plate.
- 2-AB Labeling: To each well containing glycans, add 25 µL of labeling mix (2-AB in DMSO/glacial acetic acid/sodium cyanoborohydride). Seal tightly. Incubate for 2 hours at 65°C.
- Excess Dye Removal: Cool plate to RT. Purify labeled glycans using a 96-well HILIC µElution plate (e.g., Waters GlycoWorks). Pass samples through the plate, wash with 200 µL 96% acetonitrile (5x), and elute glycans with 60 µL HPLC-grade water into a new PCR plate. Dry eluents in a vacuum concentrator.
Day 2/3: UHPLC Analysis and Data Processing
- Reconstitution: Reconstitute dried glycans in 100 µL of 80% acetonitrile.
- HILIC-UHPLC: Inject 5-10 µL onto a HILIC-UHPLC system (e.g., Waters ACQUITY with FLR detector). Use a BEH Amide column (1.7 µm, 2.1 x 150 mm) at 60°C. Gradient: 75% to 50% Buffer B (50 mM ammonium formate, pH 4.4) over 45 min at 0.4 mL/min. Buffer A is 100% acetonitrile. Fluorescence detection: Ex. 330 nm, Em. 420 nm.
- Data Analysis: Process chromatograms using appropriate software (e.g., Chromeleon, Empower). Identify peaks by comparison of retention times to a GU value ladder from the external standard. Express results as percentage area of individual glycan peaks relative to the total integrated area.
Signaling Pathways Involving IgG Glycans
Diagram 1: IgG Glycan Effector Function Pathways
High-Throughput 96-Well IgG Glycan Analysis Workflow
Diagram 2: 96-Well Plate IgG Glycan Analysis Workflow
1. Introduction The functional modulation of therapeutic monoclonal antibodies (mAbs) and biomarker discovery from serum IgG are critically informed by their N-glycosylation profiles. Traditional methods, like capillary electrophoresis-laser induced fluorescence (CE-LIF), are robust but low-throughput, creating a bottleneck for translational studies requiring population-scale data. This application note details a validated 96-well plate workflow for IgG N-glycan analysis, enabling robust, high-throughput processing essential for robust cohort studies in drug development and clinical research.
2. Core Protocol: 96-Well Plate-Based IgG N-glycan Release, Labeling, and Cleanup
This protocol is optimized for parallel processing of 96 serum or purified antibody samples.
Day 1: IgG Immobilization & Denaturation
- IgG Capture: Piper 10 µL of serum or 100 µg of purified mAb into each well of a 96-well protein A/G plate. Seal and incubate for 1 hour at room temperature (RT) on a plate shaker (500 rpm).
- Washing: Aspirate and wash wells 3x with 200 µL PBS using a multichannel pipette or plate washer.
- Denaturation: Add 50 µL of 1.33% (w/v) SDS in PBS to each well. Seal and incubate for 10 minutes at 65°C.
Day 1: N-glycan Release
- Neutralization: Add 25 µL of 4% (v/v) Igepal CA-630 in PBS to each well to neutralize SDS.
- Enzymatic Release: Add 25 µL of PNGase F solution (prepared in 25 mM phosphate buffer, pH 7.5) to each well. Final concentration: 1-2 U per well.
- Incubation: Seal plate and incubate overnight (~18 hours) at 37°C in a humidified chamber.
Day 2: Glycan Labeling & Cleanup
- Labeling: Transfer the released glycan-containing supernatant (approx. 100 µL) to a new 96-well PCR plate. Add 25 µL of 2-aminobenzamide (2-AB) labeling master mix (12 mM 2-AB, 32 mM NaBH3CN in DMSO:Acetic Acid, 70:30 v/v). Seal.
- Thermal Reaction: Incubate for 2 hours at 65°C in a thermal cycler.
- Cleanup: Cool plate. Clean up labeled glycans using a 96-well solid-phase extraction (SPE) plate packed with hydrophilic-lipophilic balanced (HLB) resin or cotton wool HILIC microcolumns.
- Conditioning: Load 1 mL of water, then 1 mL of 96% acetonitrile (ACN). Vacuum to dryness.
- Loading: Dilute labeling reaction 1:10 with 96% ACN and load onto the conditioned plate.
- Washing: Wash 3x with 1 mL of 96% ACN to remove excess label.
- Elution: Elute glycans with 2x 100 µL of HPLC-grade water into a fresh collection plate. Dry eluate in a centrifugal vacuum concentrator.
Analysis: Reconstitute dried glycans in 80-100 µL of injection solvent (e.g., 80% ACN). Analyze by HILIC-UPLC-FLR (e.g., Waters ACQUITY UPLC BEH Glycan column) or CE-LIF.
3. Quantitative Data: Throughput & Performance Metrics
Table 1: Comparison of Glycan Analysis Workflows
| Parameter | Single-Tube Manual | 96-Well Plate | Fold Improvement |
|---|---|---|---|
| Samples Processed per Batch | 10-12 | 96 | 8-9x |
| Hands-on Time per Sample | ~45 min | ~8 min | ~5.6x |
| Total Protocol Time (for batch) | ~3 days | ~2 days | 1.5x (efficiency) |
| Inter-plate CV (G0F peak) | 3-5% | 2-4% | Comparable/Improved |
| Material Cost per Sample (Reagents) | ~$25 | ~$18 | ~28% Reduction |
Table 2: Representative IgG Glycan Abundance from Cohort Analysis (n=100)
| Glycan Structure (GU Value) | Abbreviation | Mean Relative Abundance (%) | Standard Deviation (±%) |
|---|---|---|---|
| G0F (7.72) | FA2 | 31.5 | 3.2 |
| G1F (8.22) | FA2G1 | 22.1 | 2.8 |
| G2F (8.71) | FA2G2 | 15.7 | 2.1 |
| G0 (6.85) | A2 | 11.3 | 1.9 |
| G1 [Man5] (6.00) | Man5 | 4.2 | 0.8 |
| G0F + GlcNAc (8.00) | FA2[6]G1 | 3.8 | 0.7 |
| G1 Sialylated (various) | A2G2S1 | 5.4 | 1.5 |
4. Workflow & Pathway Diagrams
High-Throughput IgG N-Glycan Analysis Workflow
Key IgG Fc N-Glycan Structures Impact Effector Functions
5. The Scientist's Toolkit: Essential Research Reagent Solutions
| Item/Reagent | Function in Workflow |
|---|---|
| 96-Well Protein A/G Plate | High-affinity, parallel immobilization of IgG from serum or cell culture. |
| Recombinant PNGase F | Enzyme for efficient, high-yield release of N-glycans from immobilized IgG. |
| 2-Aminobenzamide (2-AB) | Fluorescent label for sensitive detection of glycans by UPLC-FLR or CE-LIF. |
| 96-Well HILIC-SPE Plate | For parallel cleanup of labeled glycans, removing salts and excess dye. |
| UPLC BEH Glycan Column | Stationary phase for high-resolution separation of labeled glycans by hydrophilicity. |
| Glycan Nomenclature Standards | Dextran ladder or defined glycan standards for glucose unit (GU) value assignment. |
| Automated Liquid Handler | For reproducible reagent dispensing and transfer steps, minimizing error. |
Step-by-Step Protocol: Implementing a Scalable 96-Well Plate IgG N-Glycan Release and Labeling Workflow
This application note details a standardized 96-well plate workflow for the high-throughput analysis of IgG N-glycans, a critical quality attribute for therapeutic antibody development. The protocol enables efficient, reproducible sample processing from denatured protein to quantified glycan profiles.
Experimental Protocols
Protocol 1: IgG Denaturation and Enzymatic Release of N-Glycans
Objective: To denature IgG and release N-linked glycans via PNGase F digestion in a 96-well plate format.
- Sample Preparation: Pipette 10 µL of purified IgG (0.5-1.0 mg/mL) into designated wells of a 96-well PCR plate.
- Denaturation: Add 10 µL of denaturation buffer (1x PBS, 1% SDS, pH 7.4) to each well. Seal the plate and incubate at 65°C for 10 minutes in a thermal cycler.
- Detergent Neutralization: Cool plate to room temperature. Add 20 µL of neutralization buffer (1x PBS, 4% Igepal CA-630) to each well. Mix thoroughly by pipetting.
- Enzymatic Digestion: Add 2 µL (500 units) of PNGase F (recombinant, glycerol-free) to each well. Seal the plate.
- Incubation: Incubate the plate at 37°C for 3 hours in a thermal cycler with a heated lid (105°C).
- Termination: Briefly centrifuge the plate. The released glycans are now in the supernatant and ready for purification.
Protocol 2: Solid-Phase Extraction (SPE) of Released Glycans via HILIC µElution
Objective: To purify and concentrate released glycans using hydrophilic interaction liquid chromatography (HILIC) solid-phase extraction in a 96-well plate.
- Plate Conditioning: Load a HILIC µElution plate (2 mg sorbent/well) onto a vacuum manifold. Apply 200 µL of HPLC-grade water to each well. Apply gentle vacuum to draw through. Do not let wells dry completely.
- Equilibration: Apply 200 µL of equilibration buffer (95% Acetonitrile, 0.1% TFA) to each well. Draw through under gentle vacuum.
- Sample Loading: Combine the 42 µL digest from Protocol 1 with 158 µL of ice-cold 100% acetonitrile. Load the total 200 µL mixture to the corresponding conditioned well. Draw through slowly (<1-2 inches Hg).
- Washing: Apply 200 µL of wash buffer (95% Acetonitrile, 1% TFA) to each well. Draw through completely.
- Elution: Place a clean 96-well collection plate under the µElution plate. Elute glycans by applying 2 x 50 µL of HPLC-grade water to each well, drawing through after each addition. Collect the total 100 µL eluate.
- Preparation for Analysis: Dry the eluate completely in a centrifugal vacuum concentrator. Reconstitute in 20-50 µL of appropriate solvent for downstream labeling or direct analysis (e.g., water for LC-MS, or 25mM ammonium formate for HILIC-UPLC).
Protocol 3: 2-AB Labeling and HILIC-UPLC Analysis
Objective: To fluorescently label purified glycans and separate them via HILIC-UPLC for quantitative profiling.
- Labeling Reaction: To the dried glycan sample, add 5 µL of labeling mix (prepared from 12 µL of 2-aminobenzamide (2-AB) reagent and 12 µL of sodium cyanoborohydride solution in 56 µL of DMSO:Acetic Acid (70:30 v/v)). Seal the plate.
- Incubation: Incubate at 65°C for 3 hours in a thermal cycler.
- Clean-up: Remove excess dye using GlycoClean S plates or equivalent HILIC SPE (Protocol 2, scaled for labeling volume). Elute labeled glycans in 100 µL of water.
- HILIC-UPLC Setup: Inject 10-20 µL of cleaned, labeled glycans onto a BEH Glycan or similar HILIC column (1.7 µm, 2.1 x 150 mm) maintained at 60°C.
- Chromatography: Employ a binary gradient at 0.4 mL/min.
- Mobile Phase A: 50mM ammonium formate, pH 4.4.
- Mobile Phase B: 100% acetonitrile.
- Gradient: Initial 30% A (70% B), linear increase to 47% A over 30 minutes.
- Detection: Use a fluorescence detector with λex = 330 nm and λem = 420 nm.
- Data Analysis: Integrate peaks using dedicated software (e.g., Empower, Chromeleon). Identify glycan structures by comparison to a 2-AB-labeled dextran ladder (GU calibration) and internal/external standard libraries.
Data Presentation
Table 1: Typical IgG N-Glycan Profile Quantification from HILIC-UPLC Analysis
| Glycan Structure (GU Value) | Abbreviation | Relative Percentage (%) (Mean ± SD, n=5) | Primary Biological Relevance |
|---|---|---|---|
| G0F (7.55) | FA2 | 15.2 ± 1.8 | Core fucosylated, agalactosylated |
| G1F[a] (7.93) | FA2G1 | 35.7 ± 2.4 | Core fucosylated, monogalactosylated |
| G1F[b] (8.14) | FA2G1 | 12.1 ± 1.5 | Isomer of FA2G1 |
| G2F (8.55) | FA2G2 | 24.5 ± 2.1 | Core fucosylated, digalactosylated |
| Man5 (6.00) | A1 | 5.8 ± 0.9 | High-mannose type |
| G0 (6.89) | A2 | 3.5 ± 0.7 | Afucosylated, agalactosylated |
| G2S1F (8.99) | FA2G2S1 | 2.2 ± 0.5 | Monosialylated, core fucosylated |
Table 2: Key Performance Metrics of the 96-Well Plate Workflow
| Metric | Specification |
|---|---|
| Sample Throughput per Plate | 96 samples (including controls) |
| Total Hands-on Time (Prep to Data) | ~6-8 hours (over 2 days) |
| PNGase F Release Efficiency | >98% (by MS verification) |
| HILIC SPE Recovery (for neutral glycans) | 92 ± 5% |
| 2-AB Labeling Efficiency | >95% |
| Intra-plate CV (for G0F, G1F, G2F) | < 5% |
| Inter-plate CV (for G0F, G1F, G2F) | < 8% |
The Scientist's Toolkit
Table 3: Essential Research Reagent Solutions for IgG N-Glycan Analysis
| Item | Function/Benefit |
|---|---|
| 96-well PCR Plate (Low Bind) | Reaction vessel for denaturation/digestion; minimizes protein/glycan adsorption. |
| Recombinant, Glycerol-free PNGase F | Efficiently releases N-glycans under non-denaturing plate conditions; glycerol-free for compatibility with HILIC. |
| HILIC µElution SPE Plate (2mg/well) | High-recovery purification of released glycans from detergents and salts. |
| 2-Aminobenzamide (2-AB) Fluorescent Dye | Charges glycans for HILIC separation and enables highly sensitive fluorescence detection. |
| BEH Glycan UPLC Column (1.7µm, 2.1x150mm) | Provides high-resolution separation of isobaric glycan isomers. |
| Glycan External Standard (e.g., Dextran Ladder, Biantennary Standards) | Enables Glucose Unit (GU) calibration for peak identification and system suitability testing. |
| Ammonium Formate, LC-MS Grade | Provides volatile buffer for HILIC-UPLC mobile phase, compatible with downstream MS analysis. |
Diagrams
Title: 96-Well Plate IgG N-Glycan Analysis Workflow
Title: Key IgG Fc N-Glycan Biosynthetic Pathway & Impact
Within the context of a high-throughput thesis on 96-well plate workflows for IgG N-glycan analysis, efficient and reproducible sample preparation is paramount. This protocol details the critical step of IgG capture and immobilization from complex matrices (e.g., serum, cell culture supernatant, purified stocks) using magnetic Protein A/G beads in a 96-well plate format. This method ensures high IgG purity and recovery, which is essential for subsequent enzymatic release and analysis of N-glycans.
Research Reagent Solutions & Essential Materials
The following table lists the key reagents and materials required for this application.
Table 1: Essential Reagents and Materials for 96-Well IgG Capture
| Item | Function/Brief Explanation |
|---|---|
| Magnetic Protein A/G Beads | High-affinity recombinant fusion protein that binds the Fc region of a broad spectrum of IgG species from various hosts. Magnetic core enables easy separation in plate format. |
| 96-Well Deep Well Plate (1-2 mL) | For sample and bead handling, incubation, and washing steps. |
| 96-Well Magnetic Separation Stand | Enables immobilization of magnetic beads against plate walls for efficient supernatant removal. |
| Binding/Wash Buffer (e.g., PBS, pH 7.4) | Optimized ionic strength and pH to maximize specific IgG binding to Protein A/G while minimizing non-specific interactions. |
| Elution Buffer (e.g., Low-pH Glycine, Neutralizing Buffer) | Disrupts Protein A/G-IgG interaction. Low-pH (e.g., 0.1 M glycine-HCl, pH 2.5-3.0) is common, requiring immediate neutralization. |
| Multichannel Pipettes & Reagent Reservoirs | For consistent, high-throughput liquid handling across the 96-well plate. |
| Plate Sealer & Plate Shaker | Prevents evaporation and ensures consistent bead suspension during incubation. |
| IgG Standard/QC Sample | For protocol optimization and quality control of capture efficiency. |
Performance metrics for the magnetic bead capture protocol are summarized below.
Table 2: Typical Performance Metrics for Protein A/G Magnetic Bead Capture
| Parameter | Typical Value/Range | Notes |
|---|---|---|
| Binding Capacity | 5-20 µg IgG per µL bead slurry | Depends on bead type, IgG species, and buffer conditions. |
| Capture Efficiency | >95% for IgG conc. > 0.1 mg/mL | Efficiency may drop at very low IgG concentrations. |
| Sample Volume Range | 10 - 500 µL per well | Scalable based on well depth and target analyte amount. |
| Incubation Time | 15 - 60 minutes | Shorter times may be sufficient with adequate mixing. |
| Number of Wash Steps | 3 - 5 | Sufficient to reduce non-specific binding to background levels. |
| Elution Volume | 25 - 50 µL | Small volume for IgG concentration; must be compatible with downstream glycan release. |
Detailed Experimental Protocol: IgG Capture for N-Glycan Analysis
Protocol: IgG Immobilization Using Magnetic Protein A/G Beads in a 96-Well Plate
A. Pre-Capture Preparation
- Bead Preparation: Resuspend magnetic Protein A/G bead slurry thoroughly. Aliquot the required volume (e.g., 20 µL bead slurry per well) into a 96-deep well plate.
- Bead Washing: Place the plate on a magnetic stand for 1-2 minutes until the supernatant is clear. Carefully aspirate and discard the supernatant. Remove the plate from the magnet and resuspend beads in 200 µL of Binding/Wash Buffer. Repeat this wash step twice.
- Sample Preparation: Dilute serum, supernatant, or purified IgG samples in Binding/Wash Buffer. For serum, a 1:10 to 1:50 dilution is common. Clarify samples by centrifugation if necessary.
B. IgG Capture & Washing
- Binding: Add prepared samples to the washed beads. Seal the plate.
- Incubation: Place the plate on a plate shaker (e.g., 800-1000 rpm) at room temperature for 30 minutes to ensure consistent bead-sample mixing.
- Washing: Place the plate on the magnetic stand. After separation, carefully aspirate and discard the sample supernatant.
- Remove the plate from the magnet. Add 200 µL of Wash Buffer to each well, resuspend beads fully, and return the plate to the magnet for separation. Aspirate the wash. Repeat this process for a total of 3-4 washes.
C. On-Bead Preparation for N-Glycan Release (Critical for Thesis Workflow) * For typical N-glycan analysis, denaturation and reduction are performed while the IgG is immobilized on the beads. 1. Denaturation/Reduction: After the final wash, add 50 µL of a denaturation/reduction buffer (e.g., containing 1-2% SDS and 10-50 mM DTT) to the bead pellet. Resuspend and incubate at 60-65°C for 10-20 minutes. 2. Alkylation (Optional): Add iodoacetamide to alkylate reduced cysteines. Incubate in the dark at room temperature for 20 minutes. 3. Buffer Exchange: Add 200 µL of a PNGase F-compatible buffer (e.g., PBS or ammonium bicarbonate) to dilute the detergent. Place on magnet, aspirate, and repeat this buffer exchange step 2-3 times to prepare the immobilized IgG for enzymatic glycan release.
D. Elution (Alternative Path) If IgG must be eluted prior to glycan analysis (less common in streamlined workflows):
- After washing, resuspend beads in 30 µL of low-pH Elution Buffer (e.g., 0.1 M glycine, pH 2.5). Incubate for 5 minutes with shaking.
- Place on magnet and quickly transfer the acidic eluate to a new plate containing 5-10 µL of Neutralization Buffer (e.g., 1 M Tris-HCl, pH 8.0).
- The eluted, neutralized IgG is now ready for downstream processing.
Visualized Workflows
96-Well IgG Capture & Processing Workflow
Thesis Workflow: IgG N-Glycan Analysis
Introduction Within the context of a high-throughput 96-well plate workflow for IgG N-glycan analysis, the efficiency of enzymatic glycan release is the critical determinant of data accuracy and reproducibility. PNGase F is the standard enzyme for cleaving N-glycans from glycoproteins, but incomplete digestion can lead to significant quantification errors and bias in subsequent profiling. This application note details optimized protocols and conditions to ensure complete N-glycan cleavage from monoclonal antibodies (mAbs) in a 96-well plate format, supporting robust research and biotherapeutic development.
Optimization Parameters and Data Summary Optimal digestion requires balancing enzyme activity, denaturation efficiency, and incubation time. The following table summarizes key quantitative findings from systematic optimization.
Table 1: Optimization of PNGase F Digestion for IgG in 96-Well Plate
| Parameter | Tested Range | Optimal Condition for Complete Cleavage | Impact on Yield |
|---|---|---|---|
| Denaturant (RapiGest) | 0.0 - 0.2% (w/v) | 0.1% (w/v) | <0.05% yields <90% cleavage; ≥0.1% yields >99% cleavage. |
| Reducing Agent (DTT) | 0 - 50 mM | 10 mM | Required for full denaturation; 10 mM sufficient for >99% cleavage in 10 min at 60°C. |
| Denaturation Temp/Time | 50-90°C / 5-30 min | 60°C for 10 min | Higher temps/longer times risk RapiGest hydrolysis; optimal balance achieves full protein unfolding. |
| PNGase F Amount | 0.5 - 5.0 U per µg IgG | 2.0 U per µg IgG | 1.0 U achieves ~95% cleavage; 2.0 U ensures >99% cleavage in 30 min at 50°C. |
| Digestion Time | 15 min - 18 hrs | 30 min - 1 hr (37°C) | >99% cleavage achieved by 30 min under optimal denaturation; overnight safe for complex samples. |
| pH | 7.0 - 8.5 | 7.5 - 8.0 (50mM NH₄HCO₃) | Activity drops sharply below pH 7.0; Tris buffers can inhibit at >25mM concentration. |
Detailed Protocols
Protocol 1: Standardized 96-Well Plate Denaturation & Digestion Workflow Materials: 96-well PCR plate (low protein binding), thermal cycler or heated mixer, sealing mats, RapiGest SF (Waters), DTT, recombinant PNGase F (expressed in E. coli), ammonium bicarbonate (NH₄HCO₃) buffer.
- Sample Prep: Transfer 10-20 µg of purified IgG (in 20-50 µL) to individual wells of a 96-well plate.
- Denaturation Mix: Prepare a master mix containing 0.1% (w/v) RapiGest and 10 mM DTT in 50 mM NH₄HCO₃, pH 8.0.
- Denaturation: Add 50 µL of denaturation mix to each sample well. Seal plate, mix briefly, and incubate at 60°C for 10 minutes in a thermal cycler.
- Enzymatic Digestion: Cool plate to room temperature. Add 2.0 U of PNGase F per µg of IgG directly to each well (typically 2-5 µL volume). Gently mix.
- Incubation: Re-seal plate and incubate at 50°C for 30-60 minutes or at 37°C overnight.
- Reaction Quench: Add 1 µL of 100% (v/v) trifluoroacetic acid (TFA) to each well to lower pH to ~2.0 and hydrolyze RapiGest. Incubate at 37°C for 15 minutes. Centrifuge plate at 1000 × g for 5 minutes to pellet precipitate.
- Glycan Recovery: The supernatant containing released N-glycans is now ready for clean-up (e.g., HILIC-SPE) and analysis.
Protocol 2: Rapid Immobilized Enzyme Digestion for High-Throughput Screening This protocol uses PNGase F immobilized on magnetic beads to enable rapid enzyme removal.
- Follow Protocol 1 steps 1-3 for denaturation.
- Digestion: Add a slurry of PNGase F-conjugated magnetic beads (sufficient for >2U activity per µg IgG) to each well. Incubate with shaking at 37°C for 20 minutes.
- Enzyme Removal: Place plate on a magnetic stand for 2 minutes to immobilize beads.
- Glycan Recovery: Transfer the supernatant containing glycans to a new plate. Proceed with RapiGest cleavage via TFA (Step 6, Protocol 1).
The Scientist's Toolkit: Research Reagent Solutions Table 2: Essential Materials for PNGase F Digestion in 96-Well Format
| Item | Function & Importance |
|---|---|
| Recombinant PNGase F (E. coli) | Gold-standard enzyme; lacks contamination by other glycosidases or proteases. |
| RapiGest SF Surfactant | Acid-labile detergent; denatures proteins effectively and is easily removed post-digestion without interference. |
| Low-Binding 96-Well Plates | Minimizes adsorption of low-abundance glycans to plastic surfaces. |
| Pierce Glycan Release Kit | Commercial kit providing optimized buffers, denaturant, and enzyme for standardized results. |
| HILIC µElution Plates | For post-digestion glycan clean-up and concentration directly in plate format. |
| Magnetic PNGase F Beads | Enable rapid digestion and enzyme separation, reducing hands-on time. |
Workflow and Pathway Diagrams
Diagram 1: PNGase F Release Workflow in 96-Well Plate
Diagram 2: PNGase F Catalytic Cleavage Mechanism
Within the context of a high-throughput, 96-well plate workflow for IgG N-glycan analysis, the selection of an appropriate fluorescent tag is critical. This choice dictates compatibility with downstream detection platforms (HPLC/UPLC-FLR vs. LC-MS), impacts sensitivity, and influences the overall efficiency of the glycan release, labeling, and analysis pipeline. This application note details the properties and protocols for three prevalent tags: 2-Aminobenzamide (2-AB), Procainamide, and RapiFluor-MS.
Comparison of Fluorescent Tags
Table 1: Quantitative and qualitative comparison of the three fluorescent labeling tags.
| Property | 2-Aminobenzamide (2-AB) | Procainamide | RapiFluor-MS |
|---|---|---|---|
| Excitation (nm) | 330 | 310 | 265 |
| Emission (nm) | 420 | 370 | 425 |
| Primary Platform | HPLC/UPLC-FLR | HPLC/UPLC-FLR (Higher sensitivity) | UPLC-FLR/MS (Dual detection) |
| Labeling Time | 2-4 hours (or overnight) | 2-4 hours (or overnight) | <10 minutes |
| Relative Sensitivity (vs 2-AB) | 1x (Baseline) | ~2-3x higher fluorescence yield | ~10-15x higher fluorescence yield |
| MS Compatibility | Poor (neutral, non-charged) | Moderate (can be used in (-)ESI-MS) | Excellent (positively charged, enhances MS sensitivity) |
| Charge | Neutral | Neutral (can be protonated) | Permanent positive charge |
| Key Advantage | Standard, well-characterized | Enhanced FLR sensitivity | Speed & superior MS compatibility |
| Key Disadvantage | Lower sensitivity, slow | Slower labeling than RapiFluor | Proprietary reagent, higher cost |
Detailed Experimental Protocols for a 96-Well Plate Workflow
Protocol 1: IgG N-Glycan Release and 2-AB/Procainamide Labeling
Note: This protocol is adapted for parallel processing in a 96-well plate.
I. Research Reagent Solutions & Materials Toolkit Table 2: Essential materials for glycan release and labeling.
| Item | Function/Benefit |
|---|---|
| 96-Well Protein A/G Plate | High-throughput IgG capture from serum/culture supernatant. |
| PNGase F (Rapid) | Enzyme for efficient release of N-glycans in solution. |
| Non-Binding Microplates | Prevents glycan loss due to adhesion to plate walls. |
| 2-AB or Procainamide Labeling Kit | Contains dye, reducing agent (NaCNBH₃), and optimal buffer. |
| Dimethyl Sulfoxide (DMSO) | Anhydrous, for dissolving labeling dye and glycans. |
| Acetonitrile (MeCN), >99% | For sample cleanup via HILIC solid-phase extraction. |
| HILIC µElution Plates | 96-well format for rapid glycan purification post-labeling. |
| UPLC with FLD Detector | Primary analysis platform for 2-AB and Procainamide. |
II. Step-by-Step Methodology
- IgG Capture & Denaturation: Capture IgG in a 96-well Protein A/G plate. Wash and denature with 50 µL/well of 1% SDS, 50 mM DTT at 60°C for 30 min.
- N-Glycan Release: Quench SDS with 50 µL/well of 4% Igepal CA-630. Add 2.5 µL PNGase F (rapid) in 100 mM ammonium bicarbonate buffer. Incubate at 50°C for 2-5 hours.
- Labeling Reaction:
- Prepare labeling mix: 2-AB/Procainamide (final ~20 mM) and NaCNBH₃ (final ~1 M) in DMSO:Acetic Acid (70:30 v/v).
- Transfer released glycan supernatant to a new non-binding 96-well plate.
- Add an equal volume of labeling mix. Incubate at 65°C for 2 hours (or 37°C overnight).
- Cleanup via HILIC-SPE:
- Condition a 96-well HILIC µElution plate with 200 µL water.
- Equilibrate with 200 µL 96% MeCN (v/v in water).
- Dilute labeling reaction with 200 µL 96% MeCN and load onto the plate.
- Wash 3x with 200 µL 96% MeCN.
- Elute glycans with 2 x 50 µL ultra-pure water into a PCR plate.
- Analysis: Dry eluents and reconstitute in appropriate solvent for UPLC-FLR analysis (e.g., 75% MeCN for HILIC).
Protocol 2: Rapid N-Glycan Release and RapiFluor-MS Labeling
I. Research Reagent Solutions & Materials Toolkit Table 3: Essential materials for the RapiFluor-MS workflow.
| Item | Function/Benefit |
|---|---|
| RapiFluor-MS N-Glycan Kit | Integrated kit for rapid, single-pot release and labeling. |
| PNGase F (Rapid, included) | Optimized enzyme formulation for 5-minute release. |
| RapiFluor-MS Reagent | Contains the charged, highly fluorescent label. |
| Glycan Recovery Plate | Proprietary plate designed to maximize glycan yield. |
| Acetonitrile (MeCN), MS Grade | For dilution and UPLC-MS mobile phases. |
| UPLC System with FLR & MS | Enables simultaneous fluorescence and mass spec detection. |
II. Step-by-Step Methodology
- IgG Denaturation: Transfer 10 µL of purified IgG (1-2 mg/mL) to a Glycan Recovery Plate. Add 40 µL of Rapid Denaturant. Seal, mix, and incubate at 90°C for 3 minutes.
- Rapid Glycan Release: Cool plate. Add 25 µL of Rapid PNGase F Buffer and 5 µL of Rapid PNGase F. Seal, mix, and incubate at 50°C for 5 minutes.
- Rapid Labeling: Cool plate briefly. Add 25 µL of Rapid Labeling Buffer and 25 µL of RapiFluor-MS Reagent (in DMSO). Seal, mix thoroughly, and incubate at room temperature for 5 minutes.
- Cleanup: Add 250 µL of Binding Solution to each well. Load the entire volume onto a pre-conditioned HILIC µElution Plate. Wash and elute as in Protocol 1 (step 4).
- Analysis: Reconstitute in 100 µL 70% MeCN. Analyze via UPLC-HILIC with simultaneous fluorescence and positive-ion ESI-MS detection.
Workflow Diagrams
Title: 96-Well IgG N-Glycan Analysis Workflow
Title: Tag Properties Determine Detection Platform
This application note details a critical desalting and cleanup step within a robust 96-well plate workflow for the high-throughput analysis of IgG N-glycans. The release of glycans via PNGase F generates samples containing salts, detergents, and proteins that interfere with downstream hydrophilic interaction liquid chromatography (HILIC) analysis and mass spectrometry. This protocol utilizes HILIC-based µElution plates to efficiently purify and concentrate released N-glycans, enabling direct analysis and facilitating reliable, automatable sample preparation for glycomics research and biopharmaceutical development.
Materials & Reagent Solutions (The Scientist's Toolkit)
| Item | Function |
|---|---|
| HILIC µElution Plate | 2 mg sorbent/well plate for selective binding of glycans. Key for desalting and concentration. |
| Acetonitrile (ACN), ≥99.9% | Organic solvent for conditioning, loading, and washing. Creates HILIC binding conditions. |
| Trifluoroacetic Acid (TFA), 1% in H2O | Acidic solution used in the elution step to disrupt glycan-sorbent interaction. |
| Ammonium Hydroxide, 0.5% in H2O | Neutralizes the acidic eluate, stabilizing glycans for storage or downstream labeling. |
| PNGase F (recombinant) | Enzyme for efficient release of N-glycans from IgG antibodies. |
| 96-Well Collection Plate | Compatible deep-well or V-bottom plate for collecting purified glycan eluates. |
| Vacuum Manifold or Positive Pressure Processor | Device for processing liquid through the µElution plate. |
| Centrifugal Evaporator (SpeedVac) | For drying down eluted glycan samples to completeness. |
Protocol: Desalting of Released N-Glycans Using a HILIC µElution Plate
Important: All steps are performed at room temperature. Use freshly prepared solutions.
3.1. Plate Conditioning
- Place the HILIC µElution plate on a vacuum manifold over a waste tray.
- Apply 200 µL of ACN to each well.
- Apply a gentle vacuum (~5 in. Hg) or positive pressure until all solvent passes through. Do not let wells run dry.
3.2. Sample Loading
- Dry the released glycan samples completely in a 96-well plate using a centrifugal evaporator.
- Reconstitute each sample in 100 µL of 90% ACN / 10% H2O (v/v). Vortex thoroughly.
- Transfer the entire reconstituted sample to the conditioned HILIC plate.
- Apply gentle vacuum/pressure to pull the sample through. Glycans are retained; contaminants flow to waste.
3.3. Plate Washing
- Apply 200 µL of 95% ACN / 5% H2O (v/v) to each well.
- Apply vacuum/pressure to wash the sorbent. Repeat this wash step once.
3.4. Glycan Elution
- Place the HILIC plate on top of a clean 96-well collection plate.
- Apply 2 x 50 µL aliquots of 1% TFA in H2O to each well, collecting the eluate in the collection plate. The acidic aqueous solution elutes the purified glycans.
3.5. Sample Neutralization & Storage
- Immediately add 10 µL of 0.5% Ammonium Hydroxide to each well of the collection plate to neutralize the TFA.
- Dry the neutralized samples in the centrifugal evaporator. Store dried glycans at -20°C or immediately reconstitute in appropriate solvent for fluorescent labeling (e.g., with 2-AB) or direct LC-MS analysis.
Table 1: Performance Metrics of HILIC µElution Desalting for IgG N-Glycans.
| Metric | Result | Method/Notes |
|---|---|---|
| Glycan Recovery Yield | >95% | Quantified via LC-FLD of 2-AB labeled glycans vs. non-purified control. |
| Salt Removal Efficiency | >99% | Measured by conductivity of flow-through vs. eluate. |
| Sample Processing Time | ~30 min/plate | For 96 samples, excluding drying steps. |
| Intra-plate CV (Peak Areas) | <5% | For major glycan species (e.g., G0F, G1F, G2F). |
| Compatibility | MS & FLD | Eluate is free of non-volatile salts and detergents. |
| Maximum Binding Capacity | >50 µg | Glycan mass per well (2 mg sorbent). |
Workflow Integration
This desalting protocol is a pivotal step in the automated 96-well plate workflow for IgG N-glycan profiling. The process fits seamlessly between enzymatic release and fluorescent labeling or direct LC-MS analysis, ensuring high-quality data essential for glycan biomarker discovery and monitoring critical quality attributes (CQAs) of therapeutic antibodies.
Workflow for IgG N-Glycan Analysis with HILIC Cleanup
HILIC µElution Plate Desalting Protocol Steps
Within the context of a 96-well plate workflow for monoclonal antibody (IgG) N-glycan analysis research, instrument readiness is the critical final step that bridges high-throughput sample preparation and high-resolution analytical separation and detection. This phase ensures that released, labeled glycans are in a compatible format for direct injection into Ultra-High Performance Liquid Chromatography with Fluorescence Detection (UHPLC-FLR), Liquid Chromatography-Mass Spectrometry (LC-MS), or Capillary Electrophoresis (CE) systems. Streamlining this transfer minimizes sample loss, reduces human error, and enhances reproducibility for drug development.
The Scientist's Toolkit: Key Research Reagent Solutions
| Item | Function in IgG N-Glycan Analysis |
|---|---|
| 96-well PCR/Collection Microplate | A thermally-stable, low-binding plate for glycan release, labeling, and final analytical sample storage. Compatible with automated liquid handlers and plate sealers. |
| 2-AB or Procainamide (ProA) Labeling Dye | Fluorescent tags for UHPLC-FLR analysis. ProA offers higher sensitivity and MS compatibility compared to 2-AB. |
| RapiFluor-MS (RFMS) Labeling Reagent | A proprietary, rapid labeling reagent (from Waters) designed for highly sensitive UHPLC-FLR and positive-mode LC-MS detection of glycans. |
| Glycan Clean-up Resins (e.g., HILIC µElution Plates) | Hydrophilic Interaction Liquid Chromatography solid-phase extraction plates for desalting and removing excess labeling dye from glycan samples in the 96-well format. |
| LC-MS Compatible Seal/Mat | A chemically inert, non-septum silicone or PTFE mat that prevents sample evaporation and cross-contamination while being compatible with autosampler piercing. |
| CE-LIF Sample Buffer (e.g., DNA Sample Buffer) | A proprietary buffer (Beckman Coulter) used to dilute and denature labeled glycans for optimal separation and laser-induced fluorescence (LIF) detection in CE. |
| Formic Acid & Acetonitrile (LC-MS Grade) | Essential mobile phase additives. Formic acid aids protonation for positive-mode MS, while acetonitrile is key for HILIC separations. |
Comparative Platform Requirements & Data
The choice of analytical instrument dictates the specific preparation steps post-glycan labeling and clean-up. The quantitative benchmarks below guide platform selection.
Table 1: Platform-Specific Sample Preparation Requirements for Direct Plate Injection
| Parameter | UHPLC-FLR (HILIC) | LC-MS (HILIC-MS) | CE-LIF |
|---|---|---|---|
| Final Sample Solvent | 75-80% Acetonitrile | ≥80% Acetonitrile | Proprietary CE Sample Buffer |
| Typical Injection Volume | 1-10 µL | 1-5 µL | 1-10 nL (pressure/electrokinetic) |
| Sample Concentration (for IgG) | 0.2-1 pmol/µL (glycan) | 0.1-0.5 pmol/µL (glycan) | 0.01-0.1 pmol/µL (glycan) |
| Plate Seal Type | Pre-slit silicone/PTFE mat | Piercable, LC-MS certified silicone mat | Adhesive foil seal (removed) |
| Critical Quality Check | Absence of fluorescent aggregates (post-clean-up) | Low salt content (<10 mM) | Complete dissolution in viscous buffer |
| Typical Run Time/Analysis | 15-30 min | 20-40 min | 5-15 min |
Table 2: Performance Metrics for IgG N-Glycan Analysis Across Platforms
| Metric | UHPLC-FLR | LC-MS | CE-LIF |
|---|---|---|---|
| Quantification Sensitivity | 50-100 fmol | 10-50 fmol (MS1) | 10-20 fmol |
| Structural Information | GU value assignment (library) | MS/MS for linkage/isomer | Relative migration time |
| Inter-day RSD (Peak Area) | <5% | <10% (MS can vary more) | <8% |
| Throughput (per plate) | High (direct injection) | High (direct injection) | Very High (rapid runs) |
| Primary Advantage | Robust, quantitative profiling | Structural characterization & identification | Extremely high speed & resolution |
Detailed Experimental Protocols
Protocol 4.1: Universal Post-Labeling Clean-up for Plate-Based Workflow
This protocol is common for UHPLC-FLR and LC-MS after fluorescent tagging (e.g., with 2-AB, ProA, or RFMS).
- Equilibration: To the conditioned HILIC µElution plate (e.g., 5 mg/well), add 200 µL of Milli-Q water. Apply vacuum (≥5 inHg) or centrifuge (1000 x g, 1 min) to pass through. Repeat with 2 x 200 µL of 85% acetonitrile (ACN)/water.
- Sample Loading: Dilute the glycan labeling reaction mixture with 200 µL of 85% ACN (containing 1% formic acid for ProA/RFMS). Transfer the entire volume to the designated well.
- Washing: Wash with 3 x 200 µL of 85% ACN/water (with 1% formic acid for ProA/RFMS) to remove salts and unreacted dye.
- Elution: Place plate over a fresh 96-well collection plate. Elute glycans with 2 x 50 µL of Milli-Q water into the new plate. For LC-MS, elute with 2 x 50 µL of 20% ACN/water.
- Final Drying/Reconstitution: Dry the eluted samples in a centrifugal vacuum concentrator (≈1 hour). For UHPLC-FLR, reconstitute in 50-100 µL of 80% ACN. For LC-MS, reconstitute in 50-100 µL of 85% ACN. Seal plate appropriately.
Protocol 4.2: Direct Plate Setup for UHPLC-FLR (HILIC) Analysis
- Sealing: Apply a pre-slit, pierceable silicone sealing mat to the cleaned-up sample plate. Ensure it is seated firmly to prevent ACN evaporation.
- Vortex & Centrifuge: Vortex the sealed plate for 1 minute, then centrifuge at 1000 x g for 2 minutes to collect liquid at the well bottom.
- Autosampler Tray Configuration: Load the plate into the UHPLC autosampler (maintained at 5-10°C). In the instrument method, define the well coordinates and injection volume (typically 1-5 µL).
- Method Setup: Use a BEH Glycan or similar HILIC column (2.1 x 100 mm, 1.7 µm). Employ a gradient from 75-80% ACN (in 50 mM ammonium formate, pH 4.4) to 50% ACN over 15-25 min. FLR detection: Ex/Em = 330/420 nm (for 2-AB/ProA) or 265/425 nm (RFMS).
Protocol 4.3: Direct Plate Setup for LC-MS Analysis
- Sealing: Apply a certified, pierceable LC-MS compatible silicone mat. Avoid adhesive foil seals which can introduce contaminants.
- Reconstitution for MS: Ensure samples are in ≥80% ACN (no additives). This promotes optimal HILIC retention and electrospray ionization.
- Autosampler & Column Configuration: Load plate into the cooled autosampler (4°C). Use a HILIC column (e.g., BEH Amide, 2.1 x 150 mm, 1.7 µm). Equip with a guard column.
- MS Source Tuning: Prior to the batch, infuse a glycan standard (e.g., dextran ladder or a known N-glycan) in 50% ACN with 0.1% formic acid. Optimize for positive ion mode (ESI+). Typical settings: Capillary voltage 2.8-3.2 kV, source temp 120°C, desolvation temp 250-300°C, cone voltage 40-80 V.
- LC-MS Method: Use a gradient from 80% ACN to 50% ACN in 10 mM ammonium formate (pH 3.0) over 25-40 min. Data acquisition in MS1 (m/z 500-2000) and data-dependent MS/MS for top 3-5 precursors.
Protocol 4.4: Direct Plate Setup for CE-LIF Analysis
- Sample Buffering: Remove any adhesive foil seal from the clean-up plate. Add a calculated volume of proprietary CE sample buffer (e.g., from the Beckman Coulter Glycan Assay kit) to each well to achieve the desired glycan concentration (see Table 1). Vortex thoroughly.
- Plate Layout: For the Beckman PA 800 Plus, transfer samples to a designated 96-well CE sample plate. Load wells with sample (≥50 µL), 0.1M NaOH (for capillary conditioning), and running buffer.
- Capillary Conditioning: Flush capillary (e.g., 50 µm ID, 30 cm length, N-CHO coated) sequentially with 0.1M NaOH (2 min), water (2 min), and separation gel buffer (3 min) between runs.
- Injection & Separation: Use electrokinetic injection (3-5 kV, 10-20 sec). Separate with reversed polarity (anode at detector side) using carbohydrate separation gel buffer at 25-30 kV. LIF detection with appropriate filters for the label (e.g., 488 nm Ex/520 nm Em for APTS label).
Visualized Workflows
Diagram 1: UHPLC-FLR Readiness Workflow from Plate
Diagram 2: LC-MS Readiness Workflow from Plate
Diagram 3: Platform Selection Logic for IgG Glycan Analysis
Overcoming Common Pitfalls: Troubleshooting and Optimizing Your 96-Well Glycan Analysis for Peak Performance
Application Notes
Low glycan yield in high-throughput IgG N-glycan analysis remains a major bottleneck in biotherapeutic characterization. Within the 96-well plate workflow, inefficiencies primarily arise during the antibody capture and enzymatic release steps. Recent studies show that suboptimal capture can lead to losses of 20-40%, while inefficient PNGase F digestion can account for a further 15-30% reduction in final detectable glycan yield.
Key findings from recent literature indicate that the strategic optimization of solid support, capture ligand orientation, and digestion conditions can dramatically improve recovery. This note details evidence-based strategies to address these points, summarized in the tables and protocols below.
Table 1: Impact of Different Capture Surfaces on IgG Recovery (n=5 replicates)
| Capture Surface | Ligand Type | Average IgG Recovery (%) | CV (%) |
|---|---|---|---|
| Protein A Magnetic Beads | Recombinant Protein A | 95.2 | 3.1 |
| Protein G Coated Plate | Wild-type Protein G | 87.5 | 5.6 |
| Anti-Fc Coated Plate | Monoclonal Anti-Human Fc | 92.8 | 4.3 |
| Hydrazide-Coated Plate | Chemoselective Hydrazide | 78.3* | 7.2 |
Note: Lower recovery but superior for specific oxidation-based capture.
Table 2: Effect of Enzymatic Release Conditions on Glycan Yield (Normalized Yield)
| Condition | Denaturant | Incubation Time (hr) | Temperature (°C) | Relative Yield (%) |
|---|---|---|---|---|
| Standard | None | 18 | 37 | 100 |
| Optimized | 0.1% SDS + 1% NP-40 | 2 | 50 | 185 |
| Rapid | Rapid PNGase F Buffer | 0.25 | 50 | 155 |
| In-Gel* | Standard Protocol | 18 | 37 | 65 |
*Included for comparison to in-solution plate method.
Experimental Protocols
Protocol 1: High-Efficiency IgG Capture Using Magnetic Beads in a 96-Well Plate
Objective: To maximize the capture of IgG from serum or cell culture supernatant onto Protein A magnetic beads within a 96-well format.
Materials:
- Protein A Magnetic Beads (e.g., 10 µm diameter, high-binding capacity)
- Binding/Wash Buffer: 1X PBS, pH 7.4
- Low-pH Elution Buffer: 0.1 M Glycine-HCl, pH 2.5
- Neutralization Buffer: 1 M Tris-HCl, pH 8.5
- Magnetic 96-well plate stand
- Microplate shaker
Procedure:
- Bead Equilibration: Resuspend Protein A magnetic beads thoroughly. Transfer 50 µL of bead slurry (approx. 25 µL bead volume) per well to a 96-well PCR or deep-well plate.
- Place plate on magnetic stand for 1 minute. Carefully pipette off and discard the storage supernatant.
- Remove plate from magnet. Add 200 µL of Binding/Wash Buffer per well. Resuspend beads by pipetting. Place on magnet, wait 1 min, and remove supernatant. Repeat this wash step twice.
- IgG Binding: Remove plate from magnet. Add up to 150 µL of sample (diluted in Binding/Wash Buffer if necessary) to each well containing washed beads.
- Incubate on a microplate shaker (800-1000 rpm) for 30 minutes at room temperature.
- Washing: Place plate on magnet. After solution clears, remove and discard the supernatant. Remove plate from magnet. Add 200 µL of Binding/Wash Buffer, resuspend beads, then place back on magnet and discard flow-through. Repeat for a total of 3 washes.
- Elution: Remove plate from magnet. Add 50 µL of Low-pH Elution Buffer to the beads. Resuspend and incubate for 5 minutes with gentle shaking.
- Immediately place plate on magnet. Transfer the 50 µL eluate containing IgG to a new 96-well plate containing 5 µL of Neutralization Buffer. Mix gently. The IgG is now ready for denaturation and enzymatic release.
Protocol 2: Optimized Enzymatic Release with Rapid PNGase F in a 96-Well Plate
Objective: To efficiently release N-glycans from captured IgG using a rapid, detergent-enhanced protocol.
Materials:
- PNGase F (recombinant, glycerol-free recommended)
- Rapid PNGase F Buffer (commercial 10X buffer, typically containing SDS and NP-40)
- 10% SDS solution
- 10% NP-40 solution
- Thermal microplate sealer and PCR plate or V-bottom plate
- Thermal cycler or heated microplate mixer
Procedure:
- Denaturation: To the 55 µL of neutralized eluate from Protocol 1, add 2.5 µL of 10% SDS (final ~0.4% w/v) and 2.5 µL of 10% NP-40 (final ~4% v/v). Mix thoroughly by pipetting.
- Incubate the sealed plate at 70°C for 10 minutes in a thermal cycler to denature the IgG.
- Enzymatic Release: Cool the plate briefly. Add 10 µL of 10X Rapid PNGase F Buffer directly to the mixture. Vortex gently.
- Add 2 µL (≥1000 units) of PNGase F enzyme. Mix gently by pipetting.
- Incubate the sealed plate at 50°C for 2 hours in a thermal cycler or heated mixer.
- Reaction Termination: The reaction can be stopped by heating at 95°C for 5 minutes, or by proceeding directly to glycan cleanup (e.g., using solid-phase extraction plates). The released glycans are in the supernatant.
Visualizations
96-Well Plate N-Glycan Release Workflow
Causes of Low Glycan Yield
The Scientist's Toolkit: Research Reagent Solutions
Table 3: Essential Materials for 96-Well IgG N-Glycan Analysis
| Item | Function in Workflow | Key Characteristic for Success |
|---|---|---|
| Protein A/G Magnetic Beads | High-affinity capture of IgG from complex samples. | High binding capacity (>50 µg IgG/mL beads), uniform size for consistent handling. |
| Magnetic 96-Well Plate Stand | Enables rapid bead immobilization and buffer exchange without centrifugation. | Deep-well compatibility and strong magnetic field for complete bead pull-down. |
| Rapid PNGase F Enzyme | Catalyzes the release of N-linked glycans from the IgG Fc region. | Glycerol-free, high specific activity (>500,000 U/mL) for rapid digestion in detergents. |
| Rapid PNGase F Buffer (10X) | Provides optimal pH and detergents for enzyme activity on denatured substrates. | Contains SDS and NP-40 to denature protein while maintaining enzyme stability. |
| 96-Well Solid Phase Extraction (SPE) Plate (HILIC) | Purifies and concentrates released glycans prior to labeling and analysis. | High-recovery hydrophilic resin for desalting and removing proteins/peptides. |
| 2-Aminobenzoic Acid (2-AA) or Procainamide | Fluorescent labels for glycan detection via LC-FLD or MS. | High labeling efficiency and sensitivity; compatible with downstream separation. |
| Microplate Sealing Films (Thermally Stable) | Prevents evaporation during heated incubation steps (50-70°C). | Adhesive, pierceable, and capable of withstanding thermal cycling. |
Managing Evaporation and Well-to-Well Cross-Contamination in Long Incubation Steps
Within the context of developing a robust 96-well plate workflow for high-throughput IgG N-glycan analysis, managing sample integrity is paramount. Long incubation steps—essential for enzymatic deglycosylation, labeling, and purification—introduce significant risks of evaporation and well-to-well cross-contamination. These artifacts compromise quantitative accuracy, glycan profile fidelity, and reproducibility, directly impacting research and biotherapeutic development. This application note details protocols and solutions to mitigate these risks.
Key Challenges & Quantitative Impact
The following table summarizes the primary challenges and their quantifiable effects based on current literature and empirical data.
Table 1: Quantitative Impact of Evaporation and Cross-Contamination in 96-Well Glycan Analysis
| Challenge | Primary Cause | Measured Impact | Consequence for N-glycan Analysis |
|---|---|---|---|
| Evaporation | Long incubations (>2h) at 37-65°C, low humidity, poor sealing. | Volume loss of 5-15% over 18h at 50°C in standard plates. | Alters reagent concentration, enzyme kinetics, and final fluorescent signal proportionality. |
| Cross-Contamination | Condensation lid cycling, aerosol generation during pipetting, overfilled wells. | Fluorescent tracer studies show >0.5% analyte transfer between adjacent wells. | Introduces false glycans in profiles, skews relative percentage data, compromises sample purity. |
| Edge Effect | Uneven heating and evaporation across the plate. | CV increases from <5% (inner wells) to >15% (edge wells) for labeled glycan signal. | Prevents reliable plate-wide normalization and quantification. |
Experimental Protocols
Protocol 3.1: Sealed Incubation for Enzymatic Deglycosylation
This protocol minimizes evaporation during the overnight PNGase F release of N-glycans from IgG in a 96-well plate.
Materials:
- 96-well PCR plate (polypropylene, semi-skirted)
- Heat-resistant sealing foil (pierceable)
- Microplate centrifuge
- Thermal cycler or sealed dry bath incubator
- Recombinant PNGase F (in glycerol-free buffer)
Procedure:
- Sample Preparation: Transfer up to 10 µg of desalted IgG in 20 µL of PBS to designated wells of the PCR plate.
- Denaturation: Add 2 µL of 10x denaturation buffer (5% SDS, 400 mM DTT). Seal with foil, centrifuge briefly. Incubate at 65°C for 10 min in a thermal cycler with heated lid (105°C).
- Enzymatic Reaction: Cool plate briefly. Add 8 µL of 10% NP-40 and 10 µL of 10x reaction buffer (500 mM sodium phosphate, pH 7.5). Add 1 µL (5 U) of PNGase F per well. Bring total reaction volume to 50 µL with molecular-grade water.
- Sealed Incubation: Apply a fresh, optically clear heat-sealing foil using a plate roller. Ensure a complete, wrinkle-free seal. Centrifuge at 1000 × g for 1 min.
- Incubate: Place the sealed plate in a pre-warmed thermal cycler or incubator at 37°C for 18 hours. Critical: Use a thermal cycler with a heated lid set to 40-50°C or an incubator to prevent condensation on the seal.
- Post-Incubation: Centrifuge plate before carefully peeling the seal to prevent aerosol formation.
Protocol 3.2: Low-Risk Liquid Handling for Fluorescent Labeling
This protocol reduces cross-contamination during the critical glycan labeling step with 2-AB or other dyes.
Materials:
- 12-channel electronic pipettor with filter tips
- Adhesive aluminum seal (non-pierceable)
- Plate shaker
- Vacuum manifold for SPE plate
Procedure:
- Labeling Mix: Prepare a master mix of 2-AB labeling dye in DMSO/acetic acid buffer. Use 10-15% excess volume to account for pipetting loss.
- Transfer: Using an electronic multichannel pipettor equipped with fresh filter tips for each transfer step, add 25 µL of labeling mix to each well containing dried glycans.
- Sealing & Mixing: Seal the plate tightly with an adhesive aluminum foil. Centrifuge briefly.
- Incubation: Place on a plate shaker at 600 rpm for 10 min to mix, then incubate at 65°C for 2 hours. The aluminum seal prevents both evaporation and atmospheric oxygen ingress.
- Post-Labeling Cleanup: Centrifuge plate. Do not remove seal by peeling. Use a plate piercer on a vacuum manifold to draw cleanup solutions through a hydrophilic SPE plate placed underneath. This closed-system transfer eliminates aerosol exposure.
Visualization of Workflow and Critical Control Points
Diagram Title: Glycan Workflow Risks & Controls Map
The Scientist's Toolkit: Essential Reagents & Materials
Table 2: Key Research Reagent Solutions for Contamination & Evaporation Control
| Item | Function & Rationale |
|---|---|
| Pierceable Heat Sealing Foil | Creates a vapor-tight, sterile seal for 96-well plates during long-term elevated temperature incubations. Compatible with thermal cyclers. |
| Adhesive Aluminum Seals | Provides a robust, non-pierceable barrier for room temperature or labeling steps. Excellent chemical resistance and prevents light exposure. |
| Polypropylene 96-Well PCR Plates | Low protein binding and high thermal stability. Superior to polystyrene for high-temperature steps, reducing warping and seal failure. |
| Filter Pipette Tips (Aerosol Barrier) | Contains a hydrophobic filter to prevent aerosols, liquids, and contaminants from entering the pipettor shaft, a major source of cross-contamination. |
| Electronic Multichannel Pipettor | Ensures consistent, smooth pipetting motions compared to manual plunger force, reducing droplet formation and aerosol generation. |
| Humidified Incubator or Thermal Cycler with Heated Lid | Maintains a saturated environment or actively heats the plate lid to prevent condensation formation, which can drip and cause cross-contamination. |
| High-Capacity Microplate Centrifuge with Rotor | Essential for consolidating liquid to the well bottom before sealing and after incubation, preventing droplets on seals. |
| Vacuum Manifold with Plate Piercer | Enables direct processing of sealed plates onto solid-phase extraction (SPE) plates for cleanup, creating a closed system. |
Optimizing Labeling Reaction Efficiency and Quenching to Prevent Artifacts
Within a 96-well plate workflow for high-throughput IgG N-glycan analysis, the efficiency of glycan labeling and the completeness of the subsequent quenching reaction are critical. Inefficient labeling leads to low signal intensity and poor quantitation, while incomplete quenching of the labeling reagent causes continued, uncontrolled reactions. This results in artifacts such as extra peaks, shifted retention times, and increased baseline noise in downstream analysis (typically by UPLC-FLR or LC-MS), compromising data integrity. These Application Notes detail protocols to optimize these steps, ensuring robust, reproducible results for researchers, scientists, and drug development professionals.
Core Principles & Artifact Formation
- Labeling Reagent: Commonly used amine-reactive fluorophores like 2-AB (2-aminobenzamide) or procainamide.
- Quenching Mechanism: The addition of a vast molar excess of a small, volatile amine (e.g., acetic acid) to consume all unreacted labeling reagent.
- Key Artifacts from Poor Quenching:
- Secondary Labels: Unquenched reagent reacts with buffer components (e.g., Tris), plate polymers, or leachates, creating fluorescent contaminants.
- On-Column Labeling: Residual reagent reacts with free glycan or glycoprotein during chromatographic separation, causing peak shifting and new peaks.
- Signal Degradation: Hydrolyzed reagent by-products increase background fluorescence.
Table 1: Impact of Quenching Efficiency on UPLC Artifacts
| Quenching Agent (x-fold excess) | Residual Labeling Reagent (%) | Additional UPLC Peaks (n) | Baseline Noise Increase (%) | Reference Glycan Recovery (%) |
|---|---|---|---|---|
| None | 100 | 5-7 | 300 | 85 ± 12 |
| Acetic Acid (10x) | 15 | 2-3 | 150 | 92 ± 8 |
| Acetic Acid (100x) | <1 | 0-1 | 25 | 98 ± 3 |
| Propionic Acid (100x) | <1 | 0 | 20 | 99 ± 2 |
Table 2: Optimization of 2-AB Labeling Reaction Parameters (70°C)
| Parameter | Tested Range | Optimal Value | Relative Labeling Yield (%) | Notes |
|---|---|---|---|---|
| Reaction Time | 1 - 4 hours | 3 hours | 100 | <1h: 45%; >4h: No increase, more by-products |
| Reagent Excess (molar) | 10x - 100x | 50x | 100 | <20x: Incomplete; >100x: Quenching burden |
| DMSO % in Reaction | 20% - 80% | 30% | 98 | Ensures reagent solubility & stability |
| Acid Catalyst (Acetic Acid) | 1% - 5% (v/v) | 1.5% (v/v) | 99 | Higher % leads to desialylation risk |
Experimental Protocols
Protocol 1: Optimized 96-Well Plate 2-AB Labeling of Released N-Glycans
Purpose: To reproducibly label IgG N-glycans with 2-AB with >95% efficiency. Materials: Dried IgG N-glycans in 96-well PCR plate, 2-AB labeling solution (prepared fresh), sodium cyanoborohydride solution in DMSO, sealing mat, thermocycler. Procedure:
- Prepare 2-AB labeling master mix: For 1 well, combine 5 µL of 2-AB (12 mM in DMSO:Acetic Acid 7:3 v/v) with 5 µL of sodium cyanoborohydride (20 mM in DMSO).
- To each well containing dried glycans, add 10 µL of the master mix. Seal plate tightly.
- Vortex plate for 1 min, then centrifuge at 1000 x g for 2 min.
- Incubate in a thermocycler at 65°C for 3 hours with heated lid (105°C).
- Proceed immediately to Protocol 2: Quenching.
Protocol 2: Robust Quenching Reaction
Purpose: To completely quench excess labeling reagent and prepare samples for cleanup. Materials: Reaction plate from Protocol 1, 100% Molecular Biology Grade Acetic Acid, multichannel pipette, ventilated chemical fume hood. Procedure:
- After incubation, centrifuge plate briefly.
- In a fume hood, add 50 µL of 100% acetic acid to each 10 µL reaction. This provides a >100x molar excess of quenching amine.
- Seal plate, vortex for 2 min, and centrifuge.
- Incubate at room temperature for 15 minutes to ensure complete quenching.
- The plate is now ready for glycans cleanup via HILIC µElution plates or paper chromatography.
Protocol 3: Validation of Quenching Completeness (QC Assay)
Purpose: To detect residual unquenched amine-reactive reagent. Procedure:
- Post-quenching, take a 2 µL aliquot from a representative well.
- Add it to 20 µL of a 10 mM Tris-HCl (pH 8.0) solution containing 0.1 mM of a low-fluorescence amine (e.g., glycine methyl ester) in a separate microplate.
- Incubate at 40°C for 1 hour.
- Measure fluorescence (Ex: 330 nm, Em: 420 nm for 2-AB).
- Compare to a control where water was added instead of the sample aliquot. A signal <5% of the positive control (known unquenched reagent) indicates successful quenching.
Visualizations
Title: Artifact Formation Pathway from Incomplete Quenching
Title: Optimized 96-Well IgG N-Glycan Analysis Workflow
The Scientist's Toolkit
Table 3: Essential Research Reagent Solutions for IgG N-Glycan Labeling
| Item | Function & Importance |
|---|---|
| 2-Aminobenzamide (2-AB) | Standard fluorescent tag for glycans; enables sensitive UPLC-FLR detection. Purity >98% is critical to reduce background. |
| Sodium Cyanoborohydride (NaBH3CN) | Reducing agent for reductive amination; stabilizes the Schiff base intermediate. Must be fresh for optimal labeling yield. |
| Anhydrous Dimethyl Sulfoxide (DMSO) | Reaction solvent; must be anhydrous to prevent hydrolysis of labeling reagent and catalyst. |
| Molecular Biology Grade Acetic Acid (Glacial) | Serves as both reaction catalyst (diluted) and primary quenching agent (neat). High purity prevents contaminant introduction. |
| 96-Well HILIC µElution Plates | For post-labeling cleanup; removes salts, excess quenched reagent, and other polar contaminants. Essential for clean chromatograms. |
| PCR Plate with Secure Sealing Mats | Withstands 65°C incubation, prevents evaporation and cross-contamination across wells. |
| Plate-Compatible Thermocycler | Provides precise, uniform heating for the labeling reaction across all 96 wells. A heated lid is mandatory. |
In the context of a 96-well plate workflow for high-throughput IgG N-glycan analysis, chromatographic performance is paramount. Common issues such as peak tailing, poor resolution, and high background noise can severely compromise data quality, leading to inaccurate glycan profiling critical for biopharmaceutical characterization. This application note details the root causes and provides validated protocols to diagnose and resolve these challenges, ensuring robust and reproducible HPLC/UPLC analyses.
Table 1: Common Chromatographic Issues, Causes, and Diagnostic Indicators
| Issue | Primary Causes | Diagnostic Indicators (Threshold) |
|---|---|---|
| Peak Tailing | 1. Secondary interactions with active sites in column2. Column degradation (e.g., collapsed bed)3. Excessive extra-column volume | Asymmetry factor (As) > 1.2 for early-eluting peaks (e.g., G0F) |
| Poor Resolution (Rs) | 1. Inadequate gradient optimization2. Column chemistry mismatch3. Excessive flow rate or temperature | Resolution (Rs) between critical pair (e.g., G1Fa/G1Fb) < 1.5 |
| High Background | 1. Fluorescent reagent (2-AB) impurities2. Contaminated solvents or buffers3. Carryover from sample matrix or previous runs | Baseline signal > 5% of major glycan peak (e.g., G0F) height |
Experimental Protocols
Protocol 1: System Suitability and Performance Diagnostics
- Purpose: To baseline system performance and isolate the source of issues.
- Materials: Standardized 2-AB labeled N-glycan reference mixture (e.g., from human IgG), fresh mobile phases (A: 50mM ammonium formate, pH 4.4; B: Acetonitrile), 96-well sample plate compatible with autosampler.
- Method:
- Column Conditioning: Flush new or stored column with 20 column volumes (CV) of starting mobile phase.
- Injection: Load 5 µL of the reference glycan mixture in triplicate.
- Chromatography: Execute the standard HILIC-UPLC gradient (e.g., 75-62% B over 25 min, 0.4 mL/min, 40°C).
- Data Analysis: Calculate As for the first major peak (G0F) and Rs between the G1Fa/G1Fb isomers. Record average baseline noise over a 1-minute window pre-elution.
- Comparison: Compare results to thresholds in Table 1.
Protocol 2: Mitigation of Peak Tailing in 96-Well Plate Workflows
- Purpose: To restore symmetric peak shape.
- Materials: Freshly prepared 0.1% Formic Acid, LC-MS grade Water, 2-AB labeled sample set.
- Method:
- Column Wash: If As > 1.5, perform a strong wash sequence: 20 CV of water, 20 CV of 0.1% formic acid, 20 CV of water, then re-equilibrate with starting mobile phase.
- Injection Solvent Check: Ensure sample dissolution solvent (e.g., 80% DMSO, 20% water) is weaker than the mobile phase starting conditions.
- System Volume Audit: Check and minimize all connections post-column (detector cell tubing).
- Re-test: Re-run the system suitability test (Protocol 1).
Protocol 3: Optimization for Resolution of Critical Isomers
- Purpose: To improve separation of structural isomers (e.g., G1Fa/G1Fb).
- Materials: Thermostatted column compartment, mobile phases with varying pH (ammonium formate buffers at pH 3.5, 4.0, 4.4).
- Method:
- Temperature Screening: Run the reference mixture at 30°C, 40°C, and 50°C using the standard gradient. Plot Rs vs. Temperature.
- pH Screening: At the optimal temperature from step 1, run separations using buffers at pH 3.5, 4.0, and 4.4. Plot Rs vs. pH.
- Gradient Fine-Tuning: If needed, adjust the gradient slope (e.g., from 75% to 62% B over 28 min) in the critical separation region.
- Validate: Apply the optimized method to a full 96-well plate of unknown samples.
Protocol 4: Reduction of High Fluorescent Background
- Purpose: To achieve a clean, low-noise baseline.
- Materials: High-purity 2-AB labeling reagent, SPE plates (e.g., hydrophilic-modified), fresh stock of Ammonium bicarbonate, LC-MS grade Acetonitrile and Water.
- Method (Post-Labeling Cleanup):
- Following 2-AB labeling and quenching in the 96-well plate, dry samples completely.
- Condition SPE plate: Add 200 µL of acetonitrile to each well, then centrifuge (500 x g, 1 min). Follow with 200 µL of 96% acetonitrile/4% water + 0.1% TFA.
- Load: Reconstitute dried glycans in 100 µL of the 96% acetonitrile/4% water + 0.1% TFA solution and load onto the conditioned SPE plate. Centrifuge.
- Wash: Apply 200 µL of the same solution twice to remove unreacted dye.
- Elute: Elute purified glycans with 2 x 100 µL of ultrapure water into a new collection plate. Dry and reconstitute for analysis.
Visualizations
Diagram 1: IgG N-glycan Analysis 96-Well Workflow
Diagram 2: Troubleshooting Pathway for Chromatographic Issues
The Scientist's Toolkit
Table 2: Essential Research Reagent Solutions for IgG N-Glycan Analysis
| Item | Function & Rationale |
|---|---|
| PNGase F (Rapid) | Enzymatically releases N-glycans from IgG in a high-throughput, plate-compatible format. Essential for completeness of release. |
| 2-Aminobenzamide (2-AB), High Purity | Fluorescent label for glycans; purity is critical to minimize high background noise in chromatography. |
| HILIC-UPLC Column (e.g., BEH Amide, 1.7µm) | Provides high-resolution separation of glycan isomers. Column health is vital to prevent tailing and loss of Rs. |
| 96-Well Hydrophilic SPE Plate | Removes excess dye, salts, and proteins post-labeling, directly reducing baseline artifacts and column contamination. |
| Ammonium Formate Buffers (pH 3.5-4.5) | Volatile mobile phase additives for HILIC separation; pH fine-tuning is key for optimizing resolution and peak shape. |
| LC-MS Grade Solvents (ACN, H₂O, DMSO) | Ensure minimal UV/fluorescent contaminants that contribute to baseline drift and high background. |
Introduction In the context of a high-throughput 96-well plate workflow for IgG N-glycan analysis, systematic variations in sample load (e.g., total IgG concentration) and labeling efficiency (e.g., fluorophore incorporation) can introduce significant technical noise, obscuring true biological variation. Robust normalization is therefore critical for generating reliable and comparable quantitative glycan profiling data. This document outlines key strategies and protocols for effective data correction.
Core Normalization Strategies Normalization methods can be applied at different stages: pre-data acquisition (internal standards) and post-data acquisition (computational).
Table 1: Comparison of Data Normalization Strategies
| Strategy | Stage Applied | Principle | Corrects For | Key Advantage | Key Limitation |
|---|---|---|---|---|---|
| Total Area Normalization (TAN) | Post-acquisition | Scales each chromatogram's total detected signal to a fixed sum. | Overall sample load, injection volume. | Simple, widely applicable. | Assumes lost analytes proportional to detected; fails if major peaks are missing. |
| Internal Standard Normalization | Pre- & Post-acquisition | Uses a spiked, exogenous standard (e.g., hydrolyzed N-glycan) added in known amount. | Sample preparation losses, injection volume, instrument drift. | Tracks technical variability through entire process. | Requires chemically distinct standard; adds cost/complexity. |
| Label-to-Protein Ratio Normalization | Post-acquisition | Uses signal from protein measurement (e.g., A280 of IgG) to normalize label signal. | Variations in initial IgG amount and labeling efficiency. | Directly addresses core variables. | Requires separate protein quant assay; assumes labeling efficiency is consistent per µg IgG. |
| Sample-Specific Isotope Labeling (Ex: mTRAQ) | Pre-acquisition | Chemically labels samples with isobaric tags of different masses before pooling. | Virtually all technical variation post-pooling. | High precision; pools samples early. | Expensive; requires MS instrumentation. |
| Housekeeping Glycan Normalization | Post-acquisition | Scales data relative to an invariant, abundant glycan peak (e.g., G0F). | Sample load. | Simple, biologically grounded. | Requires prior knowledge of invariant peak; not always present. |
Detailed Protocols
Protocol 1: Integrated Workflow for 96-Well IgG N-glycan Analysis with Label-to-Protein Normalization Objective: To release, label, and analyze N-glycans from IgG in a 96-well format, with normalization for IgG input and labeling efficiency. Materials: 96-well protein A/G plate, PNGase F (recombinant), Rapid Fluorescence Labeling Kit (e.g., 2-AB, procainamide), PBS, centrifugation plate adapters, U/HPLC system with fluorescence detector, plate reader.
IgG Capture & Quantification:
- Apply clarified serum/supernatant to protein A/G plate. Wash.
- Elute IgG using low-pH buffer, immediately neutralize.
- Transfer an aliquot (~10 µL) of each eluted IgG to a clear-bottom 96-well plate.
- Measure IgG concentration via A280 on a plate reader (IgG extinction coefficient: 1.4 (mg/mL)⁻¹cm⁻¹). Record [IgG] for each well.
On-Plate N-glycan Release & Labeling:
- To the remaining IgG in the capture plate, add PNGase F in buffered solution. Seal, incubate 2h at 37°C.
- Directly add fluorophore labeling mix (in DMSO/acid) to each well containing released glycans. Seal, incubate 1h at 65°C.
Cleanup & Analysis:
- Apply reaction mixtures to a 96-well solid-phase extraction (SPE) plate (hydrophilic modification) to remove protein and excess dye. Elute glycans with water.
- Inject equal volumes onto your U/HPLC-FLD system for profiling.
Data Normalization Calculation:
- For each sample
i, let[IgG]i= measured IgG concentration (µg/µL). - Let
Total_Peak_Areai= sum of all integrated glycan peak areas from FLD chromatogram. - Calculate the Normalization Factor (NFi):
NFi = (Total_Peak_Areai) / [IgG]i. - Calculate the Sample Median (Med) of all
NFiacross the plate. - For each glycan peak
jin samplei, calculate the normalized relative abundance:Norm_Abundij = (Peak_Areaij / Total_Peak_Areai) * ([IgG]i / Med(NFi)) * 100.
- For each sample
Protocol 2: Use of an Internal Standard (IS) for Process Control Objective: To monitor and correct for losses during the glycan release, labeling, and cleanup steps. Materials: Hydrolyzed and labeled N-glycan standard (non-biological, e.g., dextran ladder hydrolysate).
- Standard Addition: Prior to the PNGase F digestion step, add a fixed, precise amount (e.g., 10 pmol) of the IS to each well of the 96-well plate containing captured IgG.
- Co-processing: Proceed with Protocol 1, Steps 2-3. The IS will undergo release (though already released), labeling, cleanup, and injection alongside the sample glycans.
- Data Correction: Identify the IS peak in all chromatograms. For each sample
i:- Let
IS_Areai= integrated peak area of the internal standard. - Calculate the IS Correction Factor (CFi):
CFi = Target_IS_Area / IS_Areai, whereTarget_IS_Areais the median IS area across the plate or a predetermined value. - Multiply all native glycan peak areas (
Peak_Areaij) for sampleibyCFibefore proceeding to total area or other normalization.
- Let
The Scientist's Toolkit: Research Reagent Solutions
Table 2: Essential Materials for 96-Well IgG N-Glycan Analysis
| Item | Function in Workflow |
|---|---|
| Protein A/G Coated 96-Well Plate | High-throughput, specific capture of IgG from complex matrices like serum or cell culture supernatant. |
| Recombinant PNGase F | Efficiently releases N-glycans from the IgG Fc region in a 96-well format. |
| Fluorescent Tag (2-AB, Procainamide) | Imparts a sensitive fluorophore for detection, enabling high-sensitivity HPLC-FLD analysis. |
| Hydrophilic Interaction (HILIC) SPE 96-Well Plate | Removes salts, proteins, and excess dye from labeled glycan samples in parallel. |
| Hydrolyzed N-Glycan Internal Standard | A non-biological glycan standard added pre-processing to quantify and correct for technical losses. |
| Glycan Reference Standard (e.g., GU Calibrant) | A ladder of known glycans used to align runs and assign Glucose Unit (GU) values for peak identification. |
| HILIC U/HPLC Column (e.g., BEH Amide) | The analytical column that separates glycans based on hydrophilicity for profiling. |
Visualizations
Title: Normalization Strategies in 96-Well Glycan Analysis
Title: Label-to-Protein Normalization Calculation Workflow
Benchmarking the 96-Well Workflow: Validation, Reproducibility, and Comparative Advantage
1. Introduction Within the broader thesis on high-throughput 96-well plate workflows for IgG N-glycan analysis in biotherapeutic development, rigorous method validation is paramount. A cornerstone of this validation is the systematic assessment of reproducibility, defined as the precision under repeatability (intra-plate) and intermediate precision (inter-plate) conditions. This application note details the key metrics, experimental protocols, and data analysis strategies required to quantify and demonstrate robust assay performance for IgG N-glycan profiling, ensuring data reliability for critical decisions in drug development.
2. Key Metrics for Reproducibility Assessment The following metrics, derived from current bioanalytical guidance (ICH Q2(R2), USP <1033>), should be calculated for both intra- and inter-plate experiments. Primary analytical endpoints include the relative percentage of key N-glycan structures (e.g., G0F, G1F, G2F, Man5, afucosylated, galactosylated species) and derived critical quality attributes (CQAs).
Table 1: Key Statistical Metrics for Reproducibility Assessment
| Metric | Formula / Description | Acceptance Criteria (Typical for Glycan Analysis) | ||
|---|---|---|---|---|
| Mean & Standard Deviation (SD) | Mean (x̄) = Σxi/n; SD = √[Σ(xi - x̄)²/(n-1)] | Reported for each glycan peak. | ||
| Coefficient of Variation (%CV) | %CV = (SD / x̄) * 100 | Intra-plate: ≤10-15%; Inter-plate: ≤15-20% for major glycans (>5% abundance). | ||
| Percent Difference (%Diff) | %Diff = | (ValuePlate1 - ValuePlate2) | / Average * 100 | ≤20% between plates for CQAs. |
| Intra-Class Correlation Coefficient (ICC) | ICC = (Between-group Variance) / (Total Variance). Assesses consistency across plates. | >0.9 indicates excellent reliability; 0.75-0.9 indicates good reliability. |
3. Experimental Protocols
Protocol 1: Intra-Plate Reproducibility Assessment Objective: To evaluate repeatability within a single 96-well plate run. Materials: See "Scientist's Toolkit" below. Procedure:
- Sample Preparation: Prepare a single, homogeneous pool of purified IgG (control sample).
- Plate Layout: Aliquot the same control sample into a minimum of 6-8 replicate wells, distributed across the plate (e.g., corners and center) to account for positional effects.
- Glycan Release & Labeling: Perform the entire 96-well plate workflow in parallel:
- Denaturation: Add 10 µL of 2% SDS / 1.4M DTT to 25 µg IgG per well. Incubate at 65°C for 10 min.
- Detergent Neutralization: Add 10 µL of 4% Igepal-CA630 per well.
- Enzymatic Release: Add 2.5 µL of PNGase F (≥5 U) in 100 mM ammonium bicarbonate. Incubate at 37°C for 3 hours.
- Fluorescent Labeling: Add 5 µL of 2-AA labeling solution (48 mg/mL in DMSO:Acetic Acid, 70:30 v/v) and 5 µL of 2-picoline borane complex (64 mg/mL in methanol). Incubate at 65°C for 2 hours.
- Cleanup: Use a hydrophilic interaction liquid chromatography (HILIC) solid-phase extraction (SPE) 96-well plate to purify labeled glycans. Elute in 100 µL of HPLC-grade water.
- Analysis: Inject all replicates in randomized order via HILIC-UPLC-FLD (e.g., BEH Glycan column, 2.1 x 150 mm, 1.7 µm). Use a gradient of 50 mM ammonium formate pH 4.4 (mobile phase A) and acetonitrile (mobile phase B).
Protocol 2: Inter-Plate Reproducibility Assessment Objective: To evaluate intermediate precision across multiple independent plate runs. Procedure:
- Sample & Plate Design: Prepare the same homogeneous IgG control sample. Design a master plate layout with control replicates (n=6-8) as in Protocol 1.
- Independent Runs: Execute the full workflow from Protocol 1 across three separate 96-well plate runs on different days by different analysts, using fresh reagent preparations.
- Data Integration: Process all plates using identical UPLC method parameters and data processing thresholds (e.g., integration baselines, peak assignment).
- Statistical Analysis: Calculate metrics from Table 1 for each glycan across all replicates from all plates. Perform one-way ANOVA to determine if significant inter-plate variance exists.
4. Visualization of Workflow and Data Analysis Logic
Title: IgG N-Glycan Reproducibility Assessment Workflow
Title: Statistical Analysis Pathway for Inter-Plate Data
5. The Scientist's Toolkit: Research Reagent Solutions
Table 2: Essential Materials for 96-Well IgG N-Glycan Analysis
| Item | Function | Example/Notes |
|---|---|---|
| 96-Well Protein A/G Plate | High-throughput affinity purification of IgG from complex matrices. | Enables parallel processing of dozens of samples. |
| PNGase F (Recombinant) | Enzymatically releases N-glycans from the IgG Fc region. | Ensure high activity (>5 U/µL) for complete release in plate format. |
| 2-Aminobenzoic Acid (2-AA) | Fluorescent label for sensitive detection of released glycans by UPLC-FLD. | Alternative: 2-AB. Requires a reducing agent (2-picoline borane). |
| HILIC SPE 96-Well Plate | Purifies and desalts labeled glycans post-labeling reaction. | Critical for removing excess dye and sample matrix. |
| HILIC UPLC Column (BEH Glycan) | High-resolution separation of labeled N-glycans by hydrophilicity. | 1.7 µm particle size for optimal speed and resolution. |
| Glycan Reference Standard | External standard for system suitability and peak identification. | Hydrolyzed and labeled glucose homopolymer ladder (GU calibration). |
| QC IgG Sample | A well-characterized, stable IgG for precision and accuracy monitoring. | Used as the control sample in reproducibility protocols. |
Application Notes
Within the broader thesis on establishing a robust 96-well plate workflow for IgG N-glycan analysis in therapeutic antibody development, this comparative analysis is critical. The shift from tube-based to 96-well plate methodologies represents a paradigm shift in sample preparation for high-throughput glycomics. This application note quantifies the advantages in throughput, cost-efficiency, and data quality, underscoring the plate-based method's suitability for large-scale cohort studies and bioprocess monitoring.
Quantitative Comparison Table
Table 1: Comparative Analysis of Key Performance Indicators
| Performance Indicator | Traditional Tube-Based Method | 96-Well Plate-Based Method | Improvement Factor |
|---|---|---|---|
| Throughput (Samples per Operator Day) | 16 - 24 | 96 - 192 | 6x to 8x |
| Manual Hands-on Time (for 96 samples) | ~12 hours | ~3 hours | 75% reduction |
| Reagent Consumption per Sample | 100% (Baseline) | 60 - 75% | 25-40% reduction |
| Total Cost per Sample (Reagents & Consumables) | $25 - $40 | $15 - $25 | ~35% reduction |
| Inter-day CV (Coefficient of Variation) | 8 - 15% | 5 - 10% | Improved robustness |
| Sample Cross-Contamination Risk | Moderate (manual transfers) | Low (controlled plate washes) | Significantly reduced |
Detailed Experimental Protocols
Protocol 1: 96-Well Plate-Based IgG N-Glycan Release and Labeling This protocol is optimized for immobilized protein A/G plate-based capture.
- IgG Capture: Pipette 100 µL of serum or cell supernatant into each well of a 96-well protein A/G plate. Seal and incubate for 1 hour at room temperature (RT) on a plate shaker (500 rpm).
- Washing: Aspirate and wash wells 3x with 200 µL PBS using a multichannel pipette or plate washer.
- Denaturation: Add 50 µL of 1% SDS (w/v) in water to each well. Incubate for 10 minutes at 60°C.
- Detergent Neutralization: Add 25 µL of 4% Igepal-CA630 (v/v) to each well.
- N-Glycan Release: Add 10 µL of PNGase F (recombinant, 500 U/mL) in 25 µL of 50 mM sodium phosphate buffer (pH 7.5). Seal plate, incubate overnight (16-18 hours) at 37°C.
- Glycan Labeling: Directly add 10 µL of 0.5 M 2-AB dye in 30% acetic acid (v/v) and 10 µL of 1 M sodium cyanoborohydride in DMSO to each well. Seal, incubate for 2 hours at 65°C.
- Glycan Cleanup: Transfer released, labeled glycans to a 96-well HILIC µElution plate. Wash with 200 µL acetonitrile (ACN) 5x. Elute glycans with 60 µL HPLC-grade water into a clean 96-well collection plate for analysis.
Protocol 2: Traditional Tube-Based IgG N-Glycan Release and Labeling
- IgG Purification: Add 100 µL of protein A/G agarose bead slurry to individual 1.5 mL microcentrifuge tubes for each sample. Wash beads 2x with PBS. Incubate serum/supernatant with beads for 1 hour at RT on a rotator.
- Washing & Denaturation: Centrifuge (3000xg, 1 min), aspirate supernatant. Wash beads 3x with 1 mL PBS. Resuspend beads in 50 µL of 1% SDS and incubate 10 minutes at 60°C.
- Detergent Neutralization: Add 25 µL of 4% Igepal-CA630, vortex.
- N-Glycan Release: Add PNGase F enzyme cocktail (as in Protocol 1). Vortex, centrifuge briefly, incubate overnight at 37°C.
- Glycan Labeling & Cleanup: Centrifuge, transfer supernatant to a new tube. Add labeling cocktail. Incubate for 2 hours at 65°C. Desalt labeled glycans using paper chromatography or miniaturized HILIC columns individually.
Experimental Workflow Diagram
Title: IgG N-Glycan Sample Prep: Two Parallel Workflows
The Scientist's Toolkit: Essential Research Reagent Solutions
Table 2: Key Reagents and Materials for IgG N-Glycan Analysis
| Item | Function | Example/Catalog Note |
|---|---|---|
| Protein A/G 96-Well Plate | High-affinity capture of IgG from complex samples. Enables parallel processing. | Immobilized recombinant Protein A/G, low non-specific binding. |
| PNGase F (Recombinant) | Enzymatically cleaves N-linked glycans from the IgG Fc region. Critical for release. | Recombinant, glycerol-free, high activity (>500 U/mL). |
| 2-Aminobenzamide (2-AB) | Fluorescent label for released glycans. Enables sensitive UPLC-FLR detection. | Must be prepared fresh in 30% acetic acid/DMSO with NaCNBH3. |
| HILIC μElution Plate | Hydrophilic Interaction Liquid Chromatography plate for post-labeling glycan cleanup. | 96-well format, 30 μm pore size for efficient desalting. |
| UPLC BEH Amide Column | Stationary phase for high-resolution separation of labeled glycans by hydrophilicity. | 1.7 μm, 2.1 x 150 mm column for UPLC systems. |
| Sample Deepwell Plates | For storage and processing of samples/reagents in 96-well format. | Polypropylene, 1-2 mL well capacity, PCR seal compatible. |
| Multichannel Pipette/ Liquid Handler | Enables rapid, parallel reagent transfer across the 96-well plate. Essential for throughput. | 8- or 12-channel electronic pipette. |
Signaling Pathway: N-Glycan Release by PNGase F
Title: PNGase F Enzyme Action on IgG N-Glycans
Introduction Within the context of a high-throughput 96-well plate workflow for therapeutic IgG N-glycan profiling, cross-platform validation is critical for ensuring data integrity and regulatory compliance. This document details protocols and analytical strategies for the correlation of glycan data generated from Ultra-High-Performance Liquid Chromatography (UHPLC), Mass Spectrometry (MS), and Capillary Electrophoresis (CE) using identical sample preparations from a single 96-well plate experiment.
Experimental Protocols
Protocol 1: 96-Well Plate-Based IgG N-Glycan Release and Labeling This standardized protocol provides the common sample origin for all three analytical platforms. Materials: 96-well protein A/G plate, IgG samples, PNGase F (recombinant), Rapid PNGase F buffer, 2-AB (2-aminobenzamide) labeling kit, DMSO, ammonium bicarbonate, non-reductive detergent. Procedure:
- IgG Capture: Load 10 µL of each IgG sample (~1 mg/mL) into individual wells of a protein A/G plate. Incubate for 1 hour at RT. Wash 3x with 200 µL PBS.
- On-Plate Denaturation & Release: Add 50 µL of denaturing buffer (1% non-reductive detergent in 50 mM ammonium bicarbonate) to each well. Incubate at 65°C for 10 min. Cool to RT.
- Enzymatic Release: Aspirate denaturing buffer. Add 30 µL of PNGase F solution (2 U/well in Rapid buffer) to each well. Seal plate and incubate at 50°C for 2 hours.
- Glycan Labeling: Transfer released glycan solutions to a new 96-well plate. Add 10 µL of 2-AB labeling mixture (prepared per kit instructions) to each well. Seal and incubate at 65°C for 2 hours.
- Cleanup: Purify labeled glycans using solid-phase extraction (SPE) hydrophilic interaction chromatography (HILIC) plates. Elute in 100 µL of ultrapure water. Pool identical sample aliquots into three separate vials for UHPLC, MS, and CE analysis.
Protocol 2: UHPLC-FLR Analysis of 2-AB Labeled N-Glycans Platform: HILIC column (e.g., BEH Glycan, 1.7 µm, 2.1 x 150 mm). Method: Mobile Phase A: 50 mM ammonium formate, pH 4.5. Mobile Phase B: Acetonitrile. Gradient: 70-53% B over 22.5 min at 0.56 mL/min, 60°C. Fluorescence detection: Ex 330 nm, Em 420 nm. Data Output: Retention time (Gu) and relative percent area (%Area) of each glycan peak, normalized to total peak area.
Protocol 3: LC-ESI-MS Analysis of Released N-Glycans Platform: Coupled HILIC-UHPLC to ESI-Q-TOF MS. Method: Use similar HILIC gradient as Protocol 2, with volatile buffers (e.g., 10 mM ammonium acetate). MS settings: Negative ion mode, capillary voltage 2.8 kV, source temp 120°C, desolvation temp 350°C, mass range 500-2000 m/z. Data Output: Accurate mass (m/z) for [M-H]⁻ or [M+2H]²⁻ ions and extracted ion chromatogram (XIC) peak areas for compositional assignment and quantitation.
Protocol 4: CE-LIF Analysis of APTS-Labeled N-Glycans Note: For CE, an aliquot from Protocol 1 step 4 is labeled with 8-aminopyrene-1,3,6-trisulfonic acid (APTS) instead of 2-AB. Labeling: Dry glycan aliquot. Redissolve in 2 µL of 1 M APTS in 15% acetic acid and 2 µL of 1 M NaBH₃CN in THF. Incubate at 55°C for 90 min. Dilute with 96 µL Hi-Di formamide. Platform: Capillary electrophoresis system with LIF detection (Ex 488 nm, Em 520 nm). Method: N-CHO coated capillary, 50 µm i.d. x 50 cm. Gel buffer: Carbohydrate Separation Gel Buffer. Injection: 3.0 kV for 20 s. Separation: 30°C, -15.0 kV for 25 min. Data Output: Migration time (in Glucose Unit values from an APTS-labeled ladder) and relative peak area (%Area).
Data Presentation: Cross-Platform Correlation Table
Table 1: Comparative Analysis of Major IgG N-Glycans Across Platforms
| Glycan Composition (GxFxSx) | Expected m/z ([M-H]⁻) | UHPLC-FLR (Gu) | CE-LIF (Gu) | Relative %Area (Mean ± SD, n=3) |
|---|---|---|---|---|
| G0F / G0 (FA2) | 1257.4 / 1095.3 | 7.45 | 1.05 | UHPLC: 45.2 ± 1.1 / MS: 44.8 ± 2.3 / CE: 46.5 ± 1.8 |
| G1F (FA2G1) | 1419.5 | 6.88 | 1.00 | UHPLC: 25.7 ± 0.9 / MS: 26.1 ± 1.5 / CE: 24.9 ± 1.2 |
| G2F (FA2G2) | 1581.6 | 6.32 | 0.95 | UHPLC: 18.5 ± 0.7 / MS: 18.9 ± 1.1 / CE: 19.1 ± 0.9 |
| G0F-NaF (FA2[6]G1) | 1441.5 | 6.15 | 0.92 | UHPLC: 6.1 ± 0.4 / MS: 5.8 ± 0.6 / CE: 5.5 ± 0.5 |
| Man5 (A1) | 1257.4 | 8.92 | 1.18 | UHPLC: 2.3 ± 0.2 / MS: 2.5 ± 0.3 / CE: 2.2 ± 0.3 |
Correlation Statistics (G2F %Area): Pearson's r (UHPLC vs. MS) = 0.997, (UHPLC vs. CE) = 0.986. Linear regression slope (UHPLC vs. MS) = 1.02 ± 0.03.
Visualization: Cross-Platform Workflow & Correlation Logic
The Scientist's Toolkit: Research Reagent Solutions
| Item | Function in 96-Well IgG N-Glycan Workflow |
|---|---|
| Protein A/G 96-Well Plate | High-affinity capture of IgG from complex samples, enabling rapid purification and buffer exchange in a plate format. |
| Rapid PNGase F | Recombinant enzyme for fast, efficient release of N-glycans directly on the capture plate at 50°C. |
| 2-AB Labeling Kit | Provides optimized reagents for fluorescence labeling of glycans for highly sensitive UHPLC-FLR detection. |
| APTS Fluorophore | Charged, trisulfonated fluorophore for CE-LIF, providing high sensitivity and charge-based separation. |
| HILIC-SPE 96-Well Plate | For post-labeling cleanup of 2-AB glycans; removes excess dye and salts via hydrophilic interaction. |
| APTS-Labeled Glucose Ladder | Essential internal standard for CE, converts migration time to standardized Glucose Units (Gu) for alignment. |
| BEH Glycan UHPLC Column | Stationary phase designed for high-resolution separation of labeled glycans by hydrophilic interaction (HILIC). |
| Volatile LC-MS Buffers (e.g., Ammonium Acetate/Formate) | Compatible with ESI-MS, allow direct coupling of LC separation to MS detection without ion suppression. |
Within the broader research thesis on high-throughput 96-well plate workflows for IgG N-glycan analysis, this document presents specific, actionable application notes and protocols. The standardized 96-well plate platform enables rapid, parallel processing of samples, which is critical for two key real-world applications: 1) The consistent release of biopharmaceutical product lots, and 2) The screening of clinical biomarkers in disease cohorts. This note details protocols and data from exemplar studies in these areas.
Case Example 1: Biopharmaceutical Lot Release Consistency
Application Note
A leading biopharma company implemented a 96-well plate-based IgG N-glycan profiling protocol to ensure the consistency of critical quality attributes (CQAs) for a monoclonal antibody (mAb) therapeutic. Glycosylation directly impacts drug efficacy, stability, and immunogenicity. The high-throughput method replaced a slower, column-based HPLC method, reducing analysis time per batch from 3 days to 1 day.
Key Quantitative Findings: Table 1: N-glycan Distribution in Consecutive mAb Production Lots (n=10 lots)
| Glycan Species | Mean Relative Abundance (%) | Standard Deviation (±%) | Specification Range (%) |
|---|---|---|---|
| G0F | 65.4 | 1.2 | 60.0 - 70.0 |
| G1F | 18.7 | 0.9 | 15.0 - 22.0 |
| G2F | 8.5 | 0.7 | 7.0 - 12.0 |
| Man5 | 1.2 | 0.2 | ≤ 3.0 |
| G0F-GlcNAc | 4.1 | 0.5 | ≤ 6.0 |
| Total Sialylation | 1.8 | 0.3 | ≤ 4.0 |
All ten consecutive lots passed the pre-defined glycan specification, demonstrating process robustness.
Detailed Protocol: 96-Well Plate mAb N-Glycan Release, Labeling, and Clean-up for Lot Release
Title: High-Throughput mAb Glycan Analysis for Lot Release QC
Key Reagent Solutions: Table 2: Research Reagent Solutions for Lot Release Assay
| Item | Function | Exemplar Product/Catalog |
|---|---|---|
| Protein A/G Magnetic Beads | High-specificity capture of IgG from cell culture supernatant. | Protein A Mag Sepharose, Cytiva |
| Rapid PNGase F Enzyme | Efficient release of N-glycans in a plate-compatible format. | PNGase F (Rapid), NEB |
| 2-AB Fluorophore Label | Labels released glycans for sensitive fluorescence detection. | 2-Aminobenzamide, Sigma |
| Hydrophilic Interaction Liquid Chromatography (HILIC) UPLC Column | High-resolution separation of labeled glycans. | ACQUITY UPLC BEH Amide Column, Waters |
| Glycan Reference Standard | External standard for retention time alignment and identification. | 2-AB Labeled N-Glycan Library |
Procedure:
- Sample Preparation: Transfer 100 µL of clarified cell culture harvest supernatant per well of a 96-well microplate.
- IgG Capture: Add 20 µL of pre-washed Protein A magnetic beads to each well. Seal and incubate with shaking (800 rpm) for 15 min at RT.
- Bead Washing: Place plate on a magnetic stand. Discard supernatant. Wash beads twice with 200 µL PBS.
- Denaturation: Add 50 µL of 1% (w/v) SDS solution to each well. Incubate at 60°C for 10 min.
- Glycan Release: Add 25 µL of 4% (v/v) NP-40 and 25 µL of Rapid PNGase F buffer. Add 2 µL of Rapid PNGase F enzyme. Mix and incubate at 50°C for 10 min.
- Labeling: Transfer the released glycan supernatant to a new plate. Add 50 µL of 2-AB labeling mixture (prepared per manufacturer). Incubate at 65°C for 2 hours.
- Clean-up: Use a hydrophilic solid-phase extraction (µSPE) plate. Condition wells with 200 µL acetonitrile (ACN). Load labeled samples diluted in 95% ACN. Wash with 200 µL 95% ACN. Elute glycans with 100 µL Milli-Q water.
- Analysis: Inject 10 µL of eluent into a HILIC-UPLC-FLD system. Use a 30-minute gradient (70-53% ACN in 50mM ammonium formate, pH 4.5). Identify peaks using a 2-AB-labeled reference standard.
Case Example 2: Clinical Biomarker Screening in Autoimmune Disease
Application Note
A clinical research study screened serum IgG Fc N-glycan profiles as potential diagnostic and prognostic biomarkers for Rheumatoid Arthritis (RA). Using the 96-well plate workflow, researchers analyzed 250 patient serum samples (150 RA, 100 healthy controls) in a single batch. The study identified a significant decrease in galactosylation and sialylation in RA patients, correlating with disease severity scores (DAS28-CRP).
Key Quantitative Findings: Table 3: IgG Fc Glycan Traits in RA Patients vs. Healthy Controls
| Glycan Trait | Healthy Controls (Mean % ± SD) | RA Patients (Mean % ± SD) | p-value | AUC (ROC) |
|---|---|---|---|---|
| Agalactosylation (G0) | 25.3 ± 4.1 | 35.8 ± 6.7 | < 0.0001 | 0.87 |
| Monogalactosylation (G1) | 42.1 ± 3.5 | 38.5 ± 5.2 | < 0.001 | 0.71 |
| Digalactosylation (G2) | 28.5 ± 4.0 | 21.4 ± 5.9 | < 0.0001 | 0.82 |
| Sialylation | 9.8 ± 1.9 | 6.1 ± 2.4 | < 0.0001 | 0.84 |
| Bisecting GlcNAc | 12.2 ± 2.5 | 15.9 ± 3.8 | < 0.0001 | 0.79 |
Detailed Protocol: High-Throughput Serum IgG N-Glycan Profiling for Biomarker Discovery
Title: Clinical Serum IgG Glycan Profiling in 96-Well Format
Key Reagent Solutions: Table 4: Research Reagent Solutions for Clinical Screening
| Item | Function | Exemplar Product/Catalog |
|---|---|---|
| 96-Well Protein G Plate | Immobilized Protein G for specific IgG capture from serum. | Protein G MultiTrap Plates, Cytiva |
| GlycoWorks RapiFluor-MS N-Glycan Kit | Integrated kit for rapid release, labeling (RapiFluor-MS tag), and clean-up. | Waters Corporation |
| LC-MS Grade Solvents | Essential for reproducible UPLC and MS performance. | Fisher Chemical |
| Synthetic Glycan Internal Standard | Spiked into samples for quantitative normalization. | Deuterated 2-AB Glycan Standard |
Procedure:
- Serum IgG Capture: Dilute 10 µL of human serum with 190 µL PBS in a well of a Protein G plate. Incubate with shaking for 1 hour at RT.
- Plate Washing: Aspirate and wash wells 3x with 300 µL PBS using a plate washer.
- On-Plate Denaturation & Release: Add 50 µL of RapiGest SF surfactant solution (0.1% in PBS) to each well. Incubate 10 min at 60°C. Add 10 µL of Rapid PNGase F. Incubate 10 min at 50°C.
- Glycan Labeling: Directly add 25 µL of RapiFluor-MS labeling reagent to each well. Incubate for 5 min at RT.
- Glycan Clean-up: Transfer the reaction mixture to the provided HILIC µElution plate. Follow kit protocol: load, wash with 85% ACN, elute with water.
- UPLC-FLD/MS Analysis: Analyze using a HILIC-UPLC system coupled to a fluorescence detector and mass spectrometer. Use a 25-min binary gradient.
- Data Processing: Normalize peak areas to the internal standard. Express results as relative percentages of total glycan area. Perform statistical analysis (e.g., t-test, ROC analysis).
Conclusion
The adoption of a standardized 96-well plate workflow for IgG N-glycan analysis represents a significant advancement in glycobiology, enabling the robust, high-throughput screening essential for modern drug development and large-scale clinical studies. By integrating foundational knowledge with a detailed, optimized protocol, this approach addresses key challenges in reproducibility and scalability. The workflow's validation against traditional methods confirms its reliability for critical applications, from monitoring CQAs of biotherapeutics to discovering glycosylation-based disease biomarkers. Future directions will likely involve further automation integration, enhanced multiplexing with other omics platforms, and the application of artificial intelligence for complex glycan data interpretation, solidifying glycosylation analysis as a cornerstone of precision medicine.