Optimized HILIC-UPLC Protocol for IgG N-Glycan Analysis from Plasma: A Step-by-Step Guide for Biomarker Research
This article provides a comprehensive guide for researchers and biopharma professionals on implementing a robust HILIC-UPLC method for analyzing IgG N-glycans from plasma.
Optimized HILIC-UPLC Protocol for IgG N-Glycan Analysis from Plasma: A Step-by-Step Guide for Biomarker Research
Abstract
This article provides a comprehensive guide for researchers and biopharma professionals on implementing a robust HILIC-UPLC method for analyzing IgG N-glycans from plasma. We begin by exploring the critical role of IgG glycosylation as a biomarker for diseases like cancer and autoimmune disorders. A detailed, optimized protocol from sample preparation (release, labeling, cleanup) to chromatographic separation is presented. The guide addresses common troubleshooting and optimization challenges for peak resolution and reproducibility. Finally, we cover method validation strategies and compare HILIC-UPLC performance to alternative techniques like CE-LIF and MALDI-TOF-MS. This end-to-end resource enables reliable glycan profiling for clinical and biopharmaceutical applications.
Why IgG N-Glycans Matter: Plasma Biomarkers and the HILIC-UPLC Advantage
1. Introduction Within the context of a thesis on HILIC-UPLC protocol for IgG N-glycan analysis from plasma, this application note details the critical role of Immunoglobulin G (IgG) glycosylation as a biomarker. The Fc-linked N-glycan at Asn297 modulates IgG structure and effector functions, including antibody-dependent cellular cytotoxicity (ADCC) and complement-dependent cytotoxicity (CDC). Aberrant glycosylation patterns, such as decreased galactosylation and sialylation or increased fucosylation, are hallmarks of autoimmune diseases, cancers, and inflammatory disorders. This document provides detailed protocols for IgG isolation and glycan analysis, supporting research and therapeutic development.
2. Key Applications and Quantitative Data Table 1: Disease-Associated IgG N-Glycan Alterations
| Disease Category | Specific Condition | Key Glycosylation Shift (vs. Healthy) | Reported Change (Approx.) | Potential Functional Impact |
|---|---|---|---|---|
| Autoimmunity | Rheumatoid Arthritis (RA) | Decreased G2 (digalactosylated) | G2: ↓ 40-50% | Increased pro-inflammatory activity |
| Autoimmunity | Inflammatory Bowel Disease (Crohn's) | Decreased Galactosylation | Agalactosylated (G0): ↑ 15-25% | Enhanced complement activation |
| Oncology | Metastatic Colorectal Cancer | Increased Core Fucosylation | Fucosylation: ↑ 10-20% | Attenuated ADCC, immune evasion |
| Infectious Disease | Severe COVID-19 | Decreased Sialylation & Galactosylation | Sialylation: ↓ ~30% | Enhanced FcγR binding, cytokine storm |
| Immunotherapy | Anti-TNFα (Infliximab) Response in RA | Increased Sialylation Post-Therapy | Sialylation: ↑ in responders | Associated with anti-inflammatory effects |
3. Detailed Experimental Protocols
Protocol 3.1: IgG Isolation from Human Plasma via Protein G Affinity Chromatography Objective: To purify IgG from plasma/serum for subsequent glycan analysis. Materials: Protein G Sepharose 4 Fast Flow, Binding/Wash Buffer (20 mM Sodium Phosphate, pH 7.0), Elution Buffer (0.1 M Glycine-HCl, pH 2.7), Neutralization Buffer (1 M Tris-HCl, pH 9.0), PD-10 Desalting Columns (or equivalent). Procedure:
- Equilibrate 1 mL of Protein G resin with 10 column volumes (CV) of Binding Buffer.
- Dilute 100-200 µL of human plasma 1:10 with Binding Buffer. Centrifuge at 10,000 x g for 5 min to remove particulates.
- Load the diluted plasma onto the column. Collect flow-through for efficiency analysis.
- Wash with 10 CV of Binding Buffer to remove unbound proteins.
- Elute IgG with 5 CV of Elution Buffer, collecting 1 mL fractions into tubes containing 100 µL Neutralization Buffer.
- Measure absorbance at 280 nm. Pool IgG-containing fractions.
- Desalt into water or ammonium bicarbonate buffer using a PD-10 column. Lyophilize or concentrate for downstream use.
Protocol 3.2: HILIC-UPLC Analysis of Released and Labeled IgG N-Glycans Objective: To profile IgG N-glycan structures based on hydrophilic interaction. Materials: PNGase F (Roche), 2-AB (2-aminobenzamide) fluorescent label, Sodium cyanoborohydride, Dimethyl sulfoxide (DMSO), Acetonitrile (ACN, UPLC grade), 100 mM ammonium formate, pH 4.5, HILIC-UPLC column (e.g., Waters ACQUITY UPLC BEH Glycan, 1.7 µm, 2.1 x 150 mm). Procedure: A. N-Glycan Release and Labeling:
- Denature 50 µg of purified IgG in 20 µL of 1% SDS / 50 mM DTT at 60°C for 10 min.
- Add 30 µL of 4% Igepal CA-630 and 50 µL of 50 mM sodium phosphate, pH 7.5.
- Add 2 µL (1000 U) of PNGase F. Incubate at 37°C for 18 hours.
- Label released glycans with 2-AB by adding 25 µL of labeling mix (0.35 M 2-AB, 1 M NaCNBH3 in DMSO:Acetic Acid 70:30 v/v).
- Incubate at 65°C for 2 hours.
- Purify labeled glycans using HILIC solid-phase extraction (e.g., with packed cotton wool or commercial microplates). B. HILIC-UPLC Analysis:
- Reconstitute glycans in 100 µL of 70% ACN.
- Set column temperature to 40°C. Use a gradient of 100 mM ammonium formate, pH 4.5 (B) and 100% ACN (A).
- Run gradient: 75% A to 50% A over 40 min at 0.4 mL/min.
- Detect fluorescence (Ex: 330 nm, Em: 420 nm).
- Identify peaks by comparison to known glucose unit (GU) values from external standards (2-AB labeled dextran ladder) and reference chromatograms. Use software (e.g., Empower) for peak integration and relative percentage quantification.
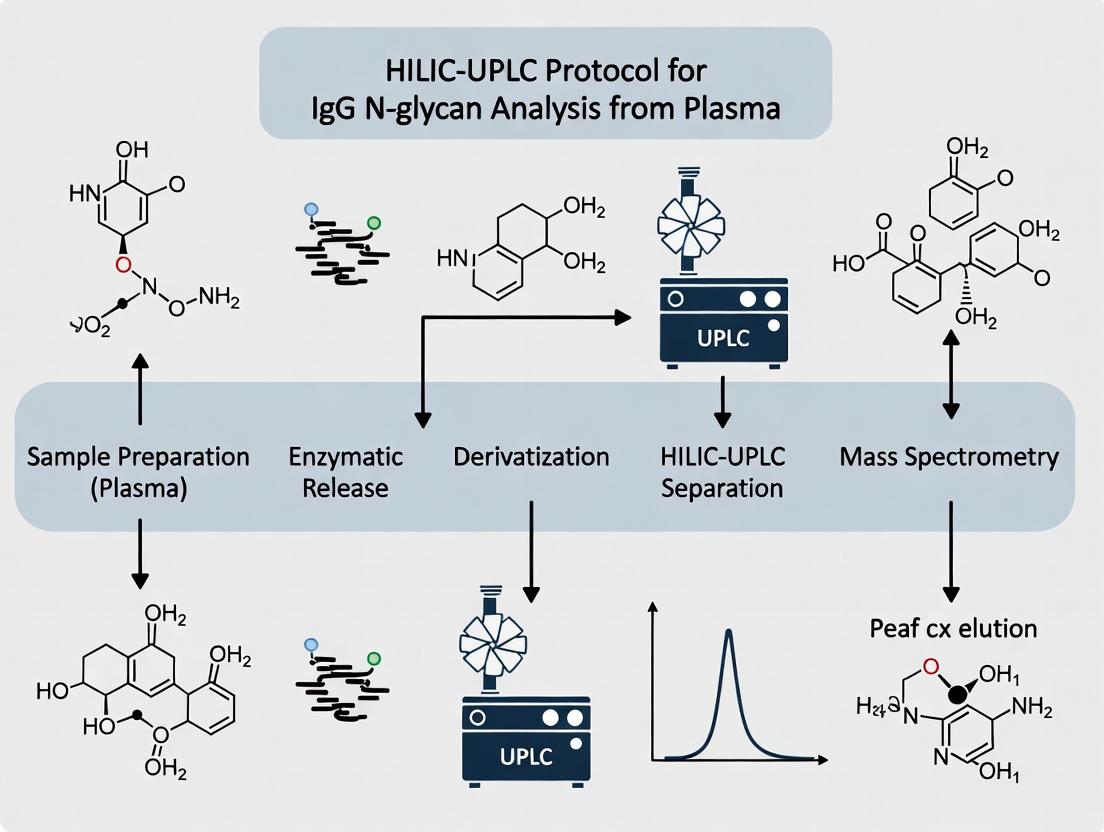
4. Visualizations
Title: HILIC-UPLC IgG N-Glycan Analysis Workflow
Title: Low Galactosylation Reduces ADCC
Title: Sialylated IgG Anti-Inflammatory Pathway
5. The Scientist's Toolkit Table 2: Essential Research Reagent Solutions for IgG Glycosylation Analysis
| Item | Function/Application | Key Considerations |
|---|---|---|
| Protein G Sepharose | High-affinity capture of IgG from serum/plasma/cell culture. | Prefer Fast Flow for rapid processing. Protein A may be used for specific subclasses. |
| Recombinant PNGase F | Enzyme cleaving N-glycans from glycoproteins for analysis. | Ensure recombinant (glycerol-free) for direct use in labeling buffers. |
| 2-Aminobenzamide (2-AB) | Fluorescent label for glycan derivatization enabling UPLC/FLR detection. | Standard, stable label offering good sensitivity and commercial GU databases. |
| BEH Glycan UPLC Column | HILIC stationary phase for high-resolution separation of labeled glycans. | 1.7 µm, 2.1 x 150 mm standard. Requires high-quality acetonitrile and buffers. |
| Dextran Hydrolysis Ladder (2-AB) | External standard for assigning Glucose Unit (GU) values to unknown peaks. | Essential for peak identification based on hydrodynamic volume. |
| 100mM Ammonium Formate, pH 4.5 | Volatile mobile phase buffer for HILIC-UPLC, compatible with MS detection. | pH is critical for separation reproducibility and sialic acid retention. |
| Acetonitrile (UPLC/MS Grade) | Primary organic mobile phase for HILIC. | Solvent purity is paramount for baseline stability and sensitivity. |
The N-glycosylation of Immunoglobulin G (IgG) is a critical post-translational modification that directly modulates its inflammatory activity. Within a broader thesis on HILIC-UPLC protocol for IgG N-glycan analysis from plasma, this work establishes the clinical relevance of specific glycan features as non-invasive biomarkers for disease diagnosis, prognosis, and therapeutic monitoring. Aberrant IgG glycan profiles are hallmark features of pathological states. Agalactosylated (G0) and asialylated glycans are associated with pro-inflammatory IgG effector functions, prevalent in autoimmune diseases and cancer. Conversely, sialylated glycans are linked to anti-inflammatory activity. The quantitative profiling of these glycans via robust, high-throughput HILIC-UPLC provides a powerful tool for stratifying patients and understanding disease mechanisms.
Key Quantitative Findings: Disease-Associated Glycan Traits
Table 1: Summary of Clinically Relevant IgG N-Glycan Traits
| Disease Category | Key Glycan Feature (Abbreviation) | Reported Change vs. Healthy Controls | Proposed Functional/Clinical Relevance |
|---|---|---|---|
| Autoimmunity (e.g., Rheumatoid Arthritis, SLE) | Agalactosylation (G0) | Significantly Increased | Enhances complement activation and FcγRIIIa binding, driving inflammation. Correlates with disease severity. |
| Inflammation (Chronic/ Acute) | Core Fucosylation | Often Decreased | Increased ADCC potential; biomarker for inflammatory burden. |
| Cancer (Various carcinomas) | α1,6-core Fucosylation (Total) | Frequently Increased | Promotes tumor immune evasion by reducing ADCC. Potential therapeutic target. |
| Cancer & Advanced Disease | Branching (Tri-, Tetra-antennary) | Increased | Associated with metastasis, poor prognosis, and immunosuppression. |
| Anti-inflammatory / Remission | Terminal Sialylation (especially α2,6) | Decreased in active disease; increases with therapy. | Induces an anti-inflammatory conformational shift, signaling through specific lectin receptors (e.g., DC-SIGN). |
Table 2: Example Quantitative HILIC-UPLC Data (% of Total Glycans)
| Glycan Structure (Abbr.) | Healthy Cohort (Mean ± SD) | Rheumatoid Arthritis Active (Mean ± SD) | Colorectal Cancer Stage III (Mean ± SD) |
|---|---|---|---|
| FA2G0 | 22.5 ± 3.1 | 31.8 ± 5.2* | 25.1 ± 4.0 |
| FA2G1 | 35.2 ± 4.0 | 33.1 ± 4.5 | 32.4 ± 3.8 |
| FA2G2 | 25.1 ± 3.5 | 18.3 ± 4.1* | 20.9 ± 3.9* |
| FA2G2S1 | 10.5 ± 2.2 | 6.9 ± 2.5* | 8.1 ± 2.4 |
| FA2[6]G1S1 | 3.8 ± 1.5 | 2.1 ± 1.1* | 2.5 ± 1.2 |
| A2G2S2 | 1.2 ± 0.6 | 0.5 ± 0.3* | 0.8 ± 0.4 |
*Indicates statistically significant difference (p<0.05) from healthy controls. Data is illustrative based on recent literature.
Detailed Experimental Protocol: HILIC-UPLC for IgG N-Glycan Profiling from Plasma
Title: Protocol for IgG N-Glycan Release, Labeling, and HILIC-UPLC Analysis
I. Materials & Reagents
- Protein G Sepharose 4FF: For IgG affinity purification from plasma/serum.
- PNGase F (Rapid or recombinant): Enzyme for enzymatic release of N-glycans.
- 2-AB (2-Aminobenzamide) or Procainamide: Fluorescent labeling reagents.
- Dimethyl sulfoxide (DMSO), Sodium cyanoborohydride (NaBH₃CN): For labeling reaction.
- Acetonitrile (ACN), HPLC-grade Water, 100mM Ammonium formate (pH 4.4): Mobile phases for HILIC.
- HILIC Column: e.g., Waters ACQUITY UPLC BEH Amide, 1.7 µm, 2.1 x 150 mm.
- UPLC System with FLD: Equipped with a fluorescence detector (excitation/emission: 330/420 nm for 2-AB).
II. Step-by-Step Procedure
- IgG Isolation: Dilute 50 µL of plasma with 200 µL PBS. Apply to a pre-equilibrated Protein G spin column. Wash with PBS. Elute IgG with 0.1 M formic acid. Neutralize eluate with 1 M ammonium bicarbonate. Dry using a vacuum concentrator.
- N-Glycan Release: Redissolve dried IgG in 50 µL of PBS. Add 1.0 µL PNGase F (≥500 units). Incubate at 37°C for 18 hours (or per rapid protocol).
- Fluorescent Labeling: Dry released glycans. Prepare labeling solution: 2-AB (19.2 mg/mL) and NaBH₃CN (31.2 mg/mL) in DMSO:Acetic acid (70:30, v/v). Add 25 µL to dried glycans. Incubate at 65°C for 2 hours.
- Clean-up: Remove excess label using hydrophilic interaction solid-phase extraction (e.g., PhyNexus hydrophilic cartridges). Elute glycans with HPLC-grade water and dry.
- HILIC-UPLC Analysis:
- Column Temperature: 60°C.
- Sample Solvent: Redissolve in 80% ACN.
- Mobile Phase: A = 50 mM ammonium formate, pH 4.4; B = 100% ACN.
- Gradient: Start at 25% A. Linear gradient to 45% A over 25 min. Return to initial conditions.
- Flow Rate: 0.4 mL/min. Detection: Fluorescence.
- Data Processing: Integrate peaks using dedicated software (e.g., Empower, Chromeleon). Express results as percentage of total integrated area (% area). Assign structures using a dextran ladder external standard (GU calibration) and internal 2-AB labeled standard library.
Visualizing Glycan-Disease Mechanisms
Title: Glycan Features Drive Disease Pathophysiology
The Scientist's Toolkit: Essential Research Reagents & Materials
Table 3: Key Reagent Solutions for IgG N-Glycan Analysis
| Item | Function & Explanation | Example Vendor/Product |
|---|---|---|
| Protein G Affinity Resin | Selective capture of IgG from complex biological fluids (plasma/serum) prior to analysis, ensuring glycan profile is IgG-specific. | Cytiva Protein G Sepharose 4 Fast Flow |
| PNGase F (Glycoamidase) | The critical enzyme that cleaves N-linked glycans from the IgG Fc region between the asparagine and innermost GlcNAc, releasing intact glycans for analysis. | Promega PNGase F (Rapid) |
| Fluorescent Label (2-AB) | Tags released glycans with a fluorophore, enabling highly sensitive detection by UPLC-FLD. Essential for quantification. | Sigma-Aldrich 2-Aminobenzamide |
| HILIC UPLC Column | Stationary phase for glycan separation based on hydrophilicity. BEH Amide chemistry provides robust, high-resolution peaks. | Waters ACQUITY UPLC BEH Amide Column |
| Glycan External Standard (Dextran Ladder) | A mixture of hydrolyzed glucose polymers used to create a retention time index (Glucose Units, GU) for glycan peak assignment. | Waters Glycan Performance Check Standard |
| Acetonitrile (HPLC Grade) | Primary organic mobile phase component in HILIC. Purity is critical for baseline stability and reproducible retention times. | Fisher Chemical HiPerSolv CHROMANORM |
| Ammonium Formate Buffer | A volatile salt buffer used as the aqueous mobile phase for HILIC. Compatible with MS detection if used. | Prepare from ammonium formate and formic acid. |
| Hydrophilic SPE Cartridges | For post-labeling cleanup to remove excess dye and salts, reducing background noise and protecting the UPLC column. | PhyNexus Hydrophilic SPE Tips |
Hydrophilic Interaction Liquid Chromatography (HILIC) is a chromatographic technique ideally suited for the separation of highly polar and hydrophilic analytes, such as glycans. For the analysis of IgG N-glycans from plasma—a critical focus in biotherapeutic development and biomarker discovery—HILIC provides robust separation based on glycan polarity and size.
The fundamental separation mechanism in HILIC is a complex partition process between a water-enriched layer immobilized on the surface of a polar stationary phase and a relatively hydrophobic mobile phase (typically acetonitrile-rich). Glycans are retained based on their hydrophilicity: more polar glycans (e.g., those with more sialic acids or polar hydroxyl groups) partition more strongly into the aqueous layer and are retained longer. Retention follows the order of increasing hydrophilicity, allowing for high-resolution separation of isobaric and structurally similar glycan species. This principle is leveraged in HILIC-UPLC for high-throughput, reproducible profiling of released and labeled N-glycans.
Application Notes for HILIC-UPLC of Plasma IgG N-glycans
Key Advantages for Glycan Analysis
- Resolution: Excellent separation of constitutional isomers (e.g., galactose isomers).
- Compatibility: Direct compatibility with mass spectrometry (ESI-MS) due to volatile buffers.
- Sensitivity: Enhanced sensitivity for fluorescently labeled glycans due to the desalting effect of the organic mobile phase.
- Reproducibility: High inter- and intra-day reproducibility of retention times, crucial for large cohort studies.
Table 1: Typical HILIC-UPLC Conditions for 2-AB Labeled N-glycans
| Parameter | Specification |
|---|---|
| Stationary Phase | Ethyl-bridged hybrid (BEH) amide (e.g., Waters ACQUITY UPLC BEH Amide, 1.7 µm) |
| Column Dimensions | 2.1 x 150 mm |
| Temperature | 60 °C |
| Mobile Phase A | 50 mM ammonium formate, pH 4.4 (aqueous) |
| Mobile Phase B | 100% Acetonitrile |
| Gradient | Linear, 70-53% B over 25 min |
| Flow Rate | 0.4 mL/min |
| Detection | Fluorescence (Ex: 330 nm, Em: 420 nm) |
| Injection Volume | 5-10 µL (partial loop) |
Table 2: Representative Relative Retention Times (RRT) and Percentages of Major IgG N-glycans
| Peak Assignment | Structure | Relative Retention Time (RRT) | Typical Relative % Area (Healthy Plasma IgG) |
|---|---|---|---|
| G0 | FA2 | 1.000 (Reference) | 20-30% |
| G0F | FA2G0 | ~1.05 | 5-15% |
| G1 | FA2G1 | ~1.10 | 10-20% |
| G1F | FA2G1[6]F / FA2G1[3]F | ~1.15 / ~1.17 | 15-25% |
| G2 | FA2G2 | ~1.22 | 15-25% |
| G2F | FA2G2F | ~1.28 | <5% |
RRT is normalized to the G0 (FA2) peak. Actual values are column and gradient dependent.
Detailed Experimental Protocol
Protocol: HILIC-UPLC Analysis of 2-AB Labeled Plasma-Derived IgG N-glycans
I. Sample Preparation: IgG Isolation and N-glycan Release
- IgG Capture: Use protein G monolithic plates or spin columns. Apply 10 µL of plasma, wash with PBS, and elute IgG with 0.1 M formic acid. Neutralize immediately with 1 M ammonium bicarbonate.
- Denaturation & Deglycosylation: Dry eluted IgG in vacuo. Redissolve in 50 µL of PBS with 0.1% SDS. Denature at 65°C for 10 min. Add 10 µL of 10% Igepal CA-630. Use 2.5 mU of PNGase F per sample. Incubate at 37°C for 18 hours.
- Glycan Cleanup & Labeling: Purify released glycans using solid-phase extraction (Graphite Carbon Cartridges) or ethanol precipitation. Dry purified glycans. Label with 2-aminobenzamide (2-AB) labeling reagent (5 µL label + 5 µL reducing agent) at 65°C for 2 hours.
- Excess Dye Removal: Purify labeled glycans using HILIC-packed microplates (e.g., Whatman filter plates packed with cotton or commercial HILIC media). Wash with acetonitrile, elute glycans with water, and dry.
II. HILIC-UPLC Analysis
- Reconstitution: Reconstitute dried, labeled glycan samples in 100 µL of 80% acetonitrile.
- System Equilibration: Equilibrate the UPLC system with BEH Amide column at 70% mobile phase B for at least 10 column volumes.
- Injection & Separation: Inject 5 µL. Run the gradient specified in Table 1.
- Data Processing: Integrate peaks using chromatography software (e.g., Empower, Chromeleon). Normalize peak areas to the total integrated area to obtain relative percent abundances. Assign peaks using external dextran ladder (for GU calibration) and confirmed with exoglycosidase digests or MS.
The Scientist's Toolkit: Key Research Reagent Solutions
Table 3: Essential Materials for HILIC-based Glycan Analysis
| Item | Function/Description | Example Vendor/Product |
|---|---|---|
| Protein G Solid Support | High-affinity capture of IgG from complex biological fluids like plasma. | Cytiva HiTrap Protein G HP; ThermoFisher Pierce Protein G Plates |
| PNGase F | Enzyme that cleaves N-linked glycans from the glycoprotein backbone. | ProZyme PNGase F (GKE-5006); New England Biolabs (P0704) |
| 2-AB Labeling Kit | Fluorescent tag for sensitive detection of released glycans by UPLC-FLR. | ProZyme GlykoPrep 2-AB Labeling Kit; LudgerTag 2-AB Kit |
| BEH Amide UPLC Column | Polar, robust stationary phase for high-resolution HILIC separation. | Waters ACQUITY UPLC BEH Amide, 1.7 µm, 2.1 x 150 mm |
| Ammonium Formate | Volatile salt for mobile phase preparation; provides consistent pH and ionic strength. | Sigma-Aldrich (≥99% purity) |
| Acetonitrile (HPLC Grade) | Primary organic constituent of the HILIC mobile phase. | Fisher Scientific Optima LC/MS Grade |
| Glycan Release Aid | Non-ionic detergent (Igepal CA-630) to maintain enzyme activity in presence of SDS. | Sigma-Aldrich Igepal CA-630 |
| HILIC Purification Media | For post-labeling cleanup to remove excess fluorescent dye. | LudgerClean S-Cartridge; Cotton threads in filter plates |
Visualization of Workflows and Principles
HILIC Glycan Analysis Workflow
HILIC Separation Mechanism
Why UPLC? The Speed, Resolution, and Sensitivity Benefits for Glycomics
Within a comprehensive thesis on HILIC-UPLC protocol for IgG N-glycan analysis from plasma, the selection of Ultra-Performance Liquid Chromatography (UPLC) over traditional High-Performance Liquid Chromatography (HPLC) is foundational. This application note details the quantitative benefits of UPLC technology for glycomic profiling, emphasizing gains in speed, resolution, and sensitivity that are critical for high-throughput biomarker discovery and biotherapeutic characterization in drug development.
Quantitative Benefits of UPLC vs. HPLC for Glycomics
The core advantages of UPLC stem from the use of sub-2µm chromatographic particles, which operate at significantly higher pressures (∼15,000 psi), compared to the 3-5µm particles and lower pressures (∼6,000 psi) typical of HPLC systems. This fundamental difference translates into measurable improvements in analytical performance.
Table 1: Comparative Performance Metrics for N-Glycan Separations
| Parameter | Traditional HPLC (5µm column) | UPLC (1.7µm column) | Improvement Factor |
|---|---|---|---|
| Analysis Time | 60-120 minutes | 10-25 minutes | 4-6x faster |
| Peak Capacity | ~100-150 | ~200-400 | ~2-3x higher |
| Theoretical Plates | ~10,000-15,000 N/m | ~20,000-40,000 N/m | ~2-3x higher |
| Sensitivity (S/N) | Baseline (1x) | 3-5x increase | 3-5x higher |
| Sample Consumption | 5-10 µL injection | 1-2 µL injection | ~5x lower |
| Solvent Consumption | 10-20 mL per run | 2-5 mL per run | ~4-5x lower |
Detailed HILIC-UPLC Protocol for IgG N-glycan Analysis from Plasma
This protocol is optimized for the release, labeling, and separation of N-glycans from immunoglobulin G (IgG) purified from human plasma.
Protocol 1: IgG Purification and N-Glycan Release
Materials: Protein G Sepharose, Binding/Wash Buffer (20 mM Na₂HPO₄, pH 7.0), Elution Buffer (0.1 M glycine-HCl, pH 2.7), Neutralization Buffer (1 M Tris-HCl, pH 9.0), PNGase F (Roche), Rapid PNGase F (NEB).
- IgG Purification: Dilute 10 µL of plasma 1:10 with Binding Buffer. Load onto a pre-equilibrated Protein G spin column. Wash with 5 column volumes of Binding Buffer. Elute IgG with 3 x 1 mL of Elution Buffer into collection tubes pre-filled with 100 µL Neutralization Buffer.
- Denaturation and Release: Combine and dry the eluted IgG using a vacuum concentrator. Redissolve in 50 µL of Milli-Q water and denature by adding 25 µL of 1% SDS and heating at 65°C for 10 minutes. Cool, then add 25 µL of 4% Igepal CA-630 to neutralize SDS.
- Enzymatic Release: Add 10 µL of 10x phosphate buffer (pH 7.5) and 1 µL (≥5 units) of PNGase F. Incubate at 37°C for 18 hours (or use Rapid PNGase F at 50°C for 10 minutes).
Protocol 2: Glycan Labeling and Clean-up
Materials: 2-aminobenzamide (2-AB), Sodium cyanoborohydride, Dimethyl sulfoxide (DMSO), Acetonitrile (ACN), Glycan clean-up cartridges (Waters).
- Labeling: Dry the released glycans. Prepare labeling solution: 4.5 mg/mL 2-AB and 8 mg/mL sodium cyanoborohydride in a 70:30 (v/v) DMSO:Acetic Acid mix. Add 25 µL to dried glycans, vortex, and incubate at 65°C for 2 hours.
- Clean-up: Apply the labeling mixture to a pre-washed (with water and 96% ACN) glycan clean-up cartridge. Wash with 10 mL of 96% ACN to remove excess dye. Elute labeled glycans with 2 x 1 mL of Milli-Q water into a low-protein-binding tube. Dry for subsequent UPLC analysis.
Protocol 3: HILIC-UPLC Separation and Analysis
Materials: ACQUITY UPLC H-Class PLUS system (Waters), ACQUITY UPLC BEH Amide Column (1.7 µm, 2.1 x 150 mm), 50 mM Ammonium formate (pH 4.4), Acetonitrile (LC-MS grade).
- System Configuration: Equip system with a quaternary solvent manager, sample manager FTN, and fluorescence (FLR) detector (λex=330 nm, λem=420 nm for 2-AB).
- Mobile Phase: Prepare Mobile Phase A: 50 mM ammonium formate, pH 4.4. Mobile Phase B: 100% Acetonitrile.
- Chromatographic Method:
- Column Temperature: 60°C
- Sample Temperature: 10°C
- Injection Volume: 1-5 µL (partial loop mode)
- Flow Rate: 0.4 mL/min
- Gradient: 0-2 min: 75% B (isocratic), 2-48 min: 75% → 62% B (linear), 48-50 min: 62% → 0% B (linear), 50-52 min: 0% B (wash), 52-55 min: 0% → 75% B (re-equilibration), 55-60 min: 75% B (re-equilibration).
- Data Analysis: Use dedicated software (e.g., Waters Empower) for integration. Identify peaks by comparison with a hydrolyzed and labeled glucose homopolymer (GHP) ladder for GU value calibration and an external 2-AB-labeled N-glycan standard library.
Visualizing the Workflow and Data
HILIC-UPLC IgG N-Glycan Analysis Workflow
UPLC vs HPLC Core Technology Comparison
The Scientist's Toolkit: Essential Research Reagents & Materials
Table 2: Key Reagent Solutions for HILIC-UPLC Glycan Analysis
| Item | Function & Rationale | Example/Supplier |
|---|---|---|
| Protein G Sepharose | Affinity purification of IgG from complex biological fluids like plasma. High specificity and yield. | Cytiva |
| Recombinant PNGase F | Enzymatically cleaves N-linked glycans from the protein backbone under non-denaturing or denaturing conditions. Essential for release. | Roche, New England Biolabs (NEB) |
| 2-Aminobenzamide (2-AB) | Fluorescent label for glycans. Introduces a chromophore for sensitive FLR detection without significantly altering glycan hydrophilicity for HILIC. | Sigma-Aldrich |
| ACQUITY UPLC BEH Amide Column | Stationary phase for HILIC separation. 1.7µm ethylene-bridged hybrid (BEH) particles provide high resolution and stability at high pressures. | Waters Corporation |
| Ammonium Formate Buffer (pH 4.4) | Volatile salt buffer for mobile phase A. Provides consistent ionization and peak shape in HILIC; compatible with downstream MS analysis. | Prepare in-house or LC-MS grade suppliers |
| Glucose Homopolymer (GHP) Ladder | Dextran hydrolysate used as an internal standard to calibrate the chromatogram to Glucose Unit (GU) values, enabling peak identification. | ProZyme |
| Glycan Clean-up Cartridges | Hydrophilic interaction-based solid-phase extraction to remove excess labeling reagents and salts from the glycan sample prior to UPLC. | Waters (GlycoWorks), Sigma-Aldrich |
The choice between using plasma/serum or purified IgG as the sample source for N-glycan analysis is critical in biotherapeutic development and biomarker research. Within the context of a broader thesis on HILIC-UPLC protocol development for IgG N-glycan analysis, this choice dictates pre-analytical workflows, data interpretation, and biological relevance. This note details the comparative considerations and provides protocols for both sample types.
Table 1: Key Characteristics of Plasma vs. Purified IgG for N-glycan Analysis
| Characteristic | Plasma/Serum (Total IgG) | Purified IgG |
|---|---|---|
| Sample Complexity | High (all plasma proteins present) | Low (isolated IgG fraction) |
| Pre-analytical Processing | Minimal for separation; complex for analysis. | Requires purification step (≥2 hours). |
| Typical IgG Yield | ~10 mg IgG per mL of plasma. | Typically >90% pure from purification. |
| Glycan Profile Representation | Reflects systemic, circulating IgG pool. | Represents isolated antibody fraction. |
| Risk of Interference | High (e.g., transferrin, albumin glycans). | Low, if purification is effective. |
| Throughput Potential | High for direct denaturation, but data deconvolution is complex. | Lower due to purification step, but cleaner data. |
| Primary Application | Clinical biomarker studies, large cohort screening. | Biopharmaceutical characterization, mechanistic studies. |
Table 2: Impact on HILIC-UPLC Results (Hypothetical Data from Recent Literature)
| Glycan Feature (Relative % Abundance) | Plasma IgG Mean (SD) | Purified IgG Mean (SD) | Notes / Probable Cause of Discrepancy |
|---|---|---|---|
| G0F / G0 | 28.5 (4.2) | 30.1 (3.1) | Minor, potentially due to co-eluting plasma glycans. |
| G1F | 34.1 (3.8) | 35.8 (2.9) | Consistent when purification is efficient. |
| G2F | 20.2 (3.5) | 22.5 (2.0) | Lower in plasma, possible matrix suppression. |
| Sialylated Glycans | 5.5 (1.8) | 8.1 (1.2) | Significant difference. Protease/esterase activity in plasma. |
| Galactosylation Index | 1.05 (0.15) | 1.25 (0.10) | Plasma may underreport due to interference. |
Detailed Experimental Protocols
Protocol A: Purification of IgG from Human Plasma/Serum for N-glycan Analysis
This protocol uses Protein G affinity chromatography for high-purity IgG isolation.
Materials: Human plasma/serum, Protein G Spin Columns or 96-well plates, Binding/Wash Buffer (e.g., PBS, pH 7.4), Elution Buffer (0.1 M Glycine-HCl, pH 2.7), Neutralization Buffer (1 M Tris-HCl, pH 9.0), Microcentrifuge, Vacuum Manifold (for plates).
Procedure:
- Equilibration: Condition the Protein G resin with 3 column volumes (CV) of Binding Buffer.
- Sample Loading: Dilute plasma/serum 1:1 with Binding Buffer. Apply diluted sample to the column. Incubate for 5 minutes at RT for binding.
- Washing: Wash column with 10 CV of Binding Buffer to remove unbound proteins.
- Elution: Apply 5 CV of Elution Buffer to collect IgG. Immediately collect eluate into a tube containing 1/10th volume of Neutralization Buffer.
- Buffer Exchange & Concentration: Desalt the purified IgG into 50 mM ammonium bicarbonate using centrifugal filter devices (10kDa MWCO). Concentrate to >1 mg/mL.
- Quantification: Measure IgG concentration via absorbance at 280 nm (extinction coefficient ~1.4).
Protocol B: Direct Release of N-glycans from Plasma IgG and Purified IgG via HILIC-UPLC Workflow
This core protocol follows the denaturation, release, labeling, and analysis steps.
Materials: Purified IgG or plasma, Rapigest SF Surfactant, PNGase F, 2-AB labeling reagent, LudgerTag 2-AB labeling kit components, ACQUITY UPLC BEH Amide Column (1.7 µm, 2.1 x 150 mm), 0.1% Formic acid in water, 0.1% Formic acid in acetonitrile.
Procedure:
- Denaturation:
- For Purified IgG: Dilute 20 µg of IgG in 50 µL of 50 mM ammonium bicarbonate.
- For Plasma: Use a volume containing ~20 µg of total IgG (typically ~2 µL plasma). Add to 50 µL of 50 mM ammonium bicarbonate.
- Add 1 µL of 1% Rapigest. Heat at 60°C for 10 min.
Enzymatic Release:
- Cool samples. Add 1 µL (≥500 units) of PNGase F.
- Incubate at 50°C for 3 hours (or overnight at 37°C for plasma).
Glycan Labeling with 2-AB:
- Follow commercial kit protocol (e.g., LudgerTag).
- Add 5 µL of labeling dye (2-AB) and 5 µL of reducing agent (NaBH3CN) to released glycans.
- Incubate at 65°C for 2 hours.
Clean-up:
- Purify labeled glycans using HILIC solid-phase extraction (SPE) microplates (e.g., LudgerClean S).
- Elute glycans in 80% acetonitrile.
HILIC-UPLC Analysis:
- Column: BEH Amide, 1.7 µm, 2.1 x 150 mm.
- Temp: 60°C.
- Mobile Phase: A = 50 mM ammonium formate, pH 4.5; B = Acetonitrile.
- Gradient: 75-62% B over 25 min.
- Detection: Fluorescence (Ex: 330 nm, Em: 420 nm).
- Data Analysis: Process using Glycobase or equivalent software for peak assignment and relative quantification.
Visualizations
Diagram 1: Sample Decision Pathway for IgG Glycan Analysis
Diagram 2: HILIC-UPLC IgG N-glycan Analysis Workflow
The Scientist's Toolkit: Research Reagent Solutions
| Item | Function in Protocol |
|---|---|
| Protein G Affinity Resin | Captures IgG Fc region with high specificity and purity from complex matrices like plasma. |
| Rapigest SF Surfactant | Acid-labile surfactant that denatures IgG for efficient PNGase F access, without interfering with downstream steps. |
| Recombinant PNGase F | Enzyme that cleaves N-linked glycans from the protein backbone between asparagine and GlcNAc. |
| 2-Aminobenzamide (2-AB) | Fluorescent label conjugated to the reducing end of released glycans for sensitive UPLC detection. |
| BEH Amide HILIC Column | Stationary phase providing high-resolution separation of hydrophilic glycan isomers based on hydrophilicity. |
| HILIC µElution SPE Plates | For efficient desalting and removal of excess dye from labeled glycan samples prior to UPLC. |
| Ammonium Formate Buffer | Volatile mobile phase additive for HILIC-UPLC, compatible with mass spectrometry if needed. |
Step-by-Step Protocol: From Plasma to Glycan Profile with HILIC-UPLC
This application note details a standardized sample preparation workflow for the analysis of IgG N-glycans from human plasma using Hydrophilic Interaction Liquid Chromatography coupled with Ultra-Performance Liquid Chromatography (HILIC-UPLC). This protocol is integral to a broader thesis investigating glycan biomarkers in autoimmune diseases and therapeutic monoclonal antibody development. The workflow ensures robust deglycosylation, clean-up, and fluorescent labeling of N-glycans for high-resolution profiling.
Key Research Reagent Solutions
| Reagent/Material | Function & Specification |
|---|---|
| Protein G Sepharose | Immunoaffinity medium for specific IgG capture from complex plasma matrices. |
| PNGase F (Glycerol-free) | Recombinant enzyme for efficient release of N-linked glycans from the IgG Fc region. |
| 2-AB Fluorophore (2-Aminobenzamide) | Fluorescent label for glycan derivatization, enabling sensitive UPLC detection with fluorescence. |
| Dimethyl Sulfoxide (DMSO) | Anhydrous grade solvent used as reaction medium for 2-AB labeling. |
| Sodium Cyanoborohydride | Reducing agent used in the reductive amination labeling reaction. |
| HILIC-UPLC BEH Amide Column (1.7 µm, 2.1 x 150 mm) | Stationary phase for high-resolution separation of labeled glycans based on hydrophilicity. |
| Acetonitrile (ACN), LC-MS Grade | Primary organic mobile phase component for HILIC separation. |
| Ammonium Formate, LC-MS Grade (e.g., 50mM, pH 4.4) | Aqueous buffer additive to control mobile phase ionic strength and pH for optimal HILIC separation. |
| Non-porous Graphitized Carbon (PGC) Spin Columns | Solid-phase extraction cartridges for desalting and purification of labeled glycans prior to UPLC. |
Experimental Workflow & Diagram
The core sample preparation procedure is summarized in the following workflow diagram.
Detailed Protocol
IgG Capture from Plasma
- Materials: Protein G Sepharose 4 Fast Flow spin columns, 100 mM phosphate-buffered saline (PBS), pH 7.4.
- Protocol:
- Condition Protein G column with 3 x 500 µL PBS.
- Load 100 µL of clarified human plasma onto the column. Incubate at RT for 10 min.
- Centrifuge at 1,000 x g for 1 min. Discard flow-through.
- Wash with 3 x 500 µL PBS. Centrifuge after each wash.
- Elute IgG with 3 x 200 µL of 100 mM formic acid (pH ~2.5) into a 1.5 mL LoBind tube pre-filled with 30 µL 1 M ammonium bicarbonate for immediate neutralization (final pH ~7-8).
- Dry the eluate in a vacuum concentrator (≤ 40°C).
N-Glycan Release with PNGase F
- Materials: Dried IgG pellet, PNGase F (≥500 U), 100 mM ammonium bicarbonate buffer, 10% SDS.
- Protocol:
- Redissolve dried IgG in 20 µL of 100 mM ammonium bicarbonate.
- Add 2 µL of 10% SDS. Denature at 95°C for 5 min. Cool to RT.
- Add 4 µL of 10% Nonidet P-40 (or 2% Triton X-100) to sequester SDS.
- Add 2 µL (500 U) of PNGase F. Vortex and spin down.
- Incubate at 37°C for 18 hours in a thermomixer.
Glycan Clean-up & 2-AB Labeling
- Materials: Released glycans, 2-AB labeling mix (2-AB in DMSO/Glacial Acetic Acid, Sodium cyanoborohydride), Non-porous graphitized carbon (PGC) spin columns.
- Protocol:
- Pre-labeling Clean-up: Pass the digestion mixture through a C18 SPE cartridge (pre-conditioned with ACN and water) to remove proteins. Wash with 5% ACN. Collect the flow-through and washes containing free glycans. Dry.
- Labeling Reaction: Reconstitute dried glycans in 10 µL of 2-AB labeling mix (0.35 M 2-AB, 1 M NaBH3CN in DMSO/Glacial Acetic Acid, 70:30 v/v).
- Incubate at 65°C for 2 hours.
- Post-labeling Clean-up: Dilute the reaction mixture with 1 mL of 80% ACN / 0.1% TFA. Load onto a pre-conditioned PGC spin column.
- Wash with 3 x 1 mL of 80% ACN / 0.1% TFA.
- Elute labeled glycans with 3 x 200 µL of 20% ACN / 0.1% TFA. Dry the eluate completely.
HILIC-UPLC Sample Reconstitution
- Materials: Dried 2-AB labeled glycans, LC-MS Grade Acetonitrile.
- Protocol:
- Reconstitute the dried, labeled glycans in 50-100 µL of 75% LC-MS grade acetonitrile.
- Vortex vigorously for 1 min and sonicate for 5 min.
- Centrifuge at 14,000 x g for 5 min before transferring supernatant to a UPLC vial with insert.
HILIC-UPLC Analytical Conditions & Reference Data
Standard chromatographic conditions and expected relative retention times (Gu values) for major human plasma IgG N-glycans are provided below.
| Glycan Structure (Symbolic) | Abbreviation | Approx. GU Value (BEH Amide) | Relative % Area (Healthy Donor Range)* |
|---|---|---|---|
| FA2 | G0 | 5.70 ± 0.05 | 20 - 30% |
| FA2G1 | G1 | 6.20 ± 0.05 | 25 - 35% |
| FA2[6]G1 | G1(6) | 6.10 ± 0.05 | 10 - 20% |
| FA2G2 | G2 | 6.70 ± 0.05 | 10 - 20% |
| FA2B | G0F | 6.90 ± 0.10 | 5 - 15% |
| FA2G1S1 | G1S | 7.50 ± 0.10 | 1 - 8% |
| FA2G2S1 | G2S | 8.20 ± 0.10 | 1 - 5% |
Note: Percentage ranges are illustrative and subject to biological variation. Internal dextran ladder calibration is mandatory for assigning Glucose Unit (GU) values.
Chromatographic Conditions:
- Column: ACQUITY UPLC BEH Glycan, 1.7 µm, 2.1 x 150 mm.
- Mobile Phase A: 50 mM Ammonium formate, pH 4.4.
- Mobile Phase B: Acetonitrile (100%).
- Gradient: 75-62% B over 25 min at 0.56 mL/min, 40°C.
- Detection: Fluorescence (λex=330 nm, λem=420 nm).
- Injection Volume: 5-10 µL.
Application Notes
This protocol details the initial, critical step for the high-throughput purification of Immunoglobulin G (IgG) from human plasma or serum, utilizing magnetic beads conjugated with recombinant Protein A/G. This step is foundational for downstream HILIC-UPLC analysis of IgG N-glycan profiles, a key methodology in biotherapeutic development, biomarker discovery, and glycomics research. Efficient and reproducible capture is paramount, as contamination or low yield directly compromises subsequent glycan release, labeling, and chromatographic separation. The use of affinity tips with magnetic beads enables rapid processing of multiple samples with minimal hands-on time, enhancing reproducibility for large cohort studies common in clinical research.
Protocol: IgG Capture Using Protein A/G Magnetic Beads in Affinity Tips
Research Reagent Solutions & Essential Materials
| Item | Function |
|---|---|
| Recombinant Protein A/G Magnetic Beads | Binds the Fc region of IgG from multiple species with high affinity and specificity. |
| 96-Well Magnetic Stand | Enables separation of beads from supernatant in a plate format. |
| Liquid Handling Robot (or Manual Multichannel Pipette) | For high-throughput, reproducible transfer of plasma and buffers. |
| Affinity Tips (or standard pipette tips with barrier) | Prevents bead aspiration and cross-contamination during liquid handling. |
| Phosphate-Buffered Saline (PBS), pH 7.4 | Washing and binding buffer to maintain neutral pH and ionic strength. |
| Low-PH Elution Buffer (e.g., 0.1 M Glycine-HCl, pH 2.5-3.0) | Disrupts IgG-Protein A/G interaction to release purified IgG. |
| Neutralization Buffer (e.g., 1 M Tris-HCl, pH 8.5) | Quickly neutralizes acidic eluate to preserve IgG integrity and activity. |
| Plasma or Serum Sample | Biological source containing polyclonal IgG. |
Detailed Methodology
Principle: IgG binds to Protein A/G on magnetic beads in a neutral buffer. Impurities are removed by washing, and pure IgG is eluted under acidic conditions.
Pre-Capture Steps:
- Bead Preparation: Vortex Protein A/G magnetic bead stock. Aliquot 10 µL of bead suspension per sample into a 96-well plate.
- Bead Washing: Place plate on a magnetic stand for 1 minute. Discard supernatant. Remove from magnet and resuspend beads in 150 µL PBS. Repeat wash twice.
IgG Capture:
- Plasma Binding: Dilute 5 µL of human plasma with 145 µL PBS. Add the 150 µL diluted plasma to the washed beads. Seal plate.
- Incubation: Mix on a plate shaker (600-800 rpm) for 15 minutes at room temperature.
- Washing: Place plate on magnetic stand. Discard supernatant. Perform three sequential washes with 150 µL PBS. Ensure complete bead pelleting and supernatant removal each time.
IgG Elution & Preparation for HILIC-UPLC:
- Acidic Elution: Add 50 µL of 0.1 M Glycine-HCl (pH 2.5) to beads. Mix on shaker for 3 minutes.
- Collection: Place plate on magnet. Transfer the acidic eluate (containing IgG) to a new 96-well plate containing 10 µL of 1 M Tris-HCl (pH 8.5) for immediate neutralization (final pH ~7-8).
- Bead Regeneration (Optional): Beads can be regenerated with 100 µL Glycine (pH 2.5), then equilibrated in PBS for reuse.
- Sample Storage: Eluted, neutralized IgG can be stored at -20°C or processed immediately for N-glycan release (Step 2 of the overall thesis workflow).
Table 1: Typical Yield and Purity from 5 µL Plasma Input (n=6 replicates)
| Metric | Mean Value | CV (%) |
|---|---|---|
| IgG Yield (µg) | 58.2 µg | 4.8% |
| Purity (by SDS-PAGE) | >95% | - |
| Process Time (for 96 samples) | ~90 minutes | - |
Table 2: Comparison of Affinity Ligand Binding Specificity
| Ligand | Human IgG1 | Human IgG2 | Human IgG3 | Human IgG4 | Serum Albumin |
|---|---|---|---|---|---|
| Protein A | Strong | Strong | Weak | Strong | None |
| Protein G | Strong | Strong | Strong | Strong | Weak |
| Protein A/G | Strong | Strong | Strong | Strong | None |
Workflow Diagram
Diagram Title: IgG Capture Workflow for HILIC-UPLC Sample Prep
Signaling/Logical Pathway Diagram
Diagram Title: Logic of IgG Capture Quality Impact on HILIC-UPLC
This application note details the optimized protocol for the enzymatic release of N-glycans from purified immunoglobulin G (IgG) as a critical preparatory step for HILIC-UPLC analysis within a thesis focused on glycan biomarker discovery from plasma. Efficient and complete release is paramount for accurate profiling.
1. Principle and Rationale Peptide-N-Glycosidase F (PNGase F) is an amidase that catalyzes the cleavage of the asparagine-linked (N-linked) glycan from the polypeptide backbone between the innermost GlcNAc and the asparagine residue. This releases the intact glycan, converting asparagine to aspartic acid. For IgG glycans, which are exclusively N-linked to the Fc region, PNGase F ensures comprehensive release under non-denaturing conditions when IgG is correctly purified.
2. Research Reagent Solutions Toolkit
| Reagent/Material | Function in Protocol |
|---|---|
| Recombinant PNGase F (e.g., glycerol-free) | The core enzyme for specific hydrolysis of N-glycans. Glycerol-free is preferred for downstream HILIC analysis. |
| IgG Sample (Purified from plasma) | Substrate. Must be purified via Protein A/G or specific IgG purification kits to remove other glycoproteins and free glycans. |
| Ammonium Bicarbonate Buffer (100-200 mM, pH 7.5-8.5) | Optimal buffer for PNGase F activity, providing appropriate pH (7.5-8.5) and ionic strength. Volatile for easy lyophilization. |
| Denaturant (e.g., 2% SDS, 8M Urea) | Optional. Used for denaturing glycoproteins with complex structures; must be neutralized with non-ionic detergent (NP-40/Triton X-100) before adding PNGase F. |
| Non-ionic Detergent (10% NP-40 or Triton X-100) | Neutralizes SDS denaturant if used, as SDS inhibits PNGase F. A 10:1 ratio of detergent to SDS is standard. |
| Incubation Equipment (Thermomixer) | Provides consistent 37°C temperature with optional agitation for efficient enzymatic reaction over 18 hours. |
3. Detailed Experimental Protocol
A. Standard Release from Purified IgG
- Sample Preparation: Transfer up to 50 µg of purified IgG (in water or a compatible buffer) into a low-protein-binding microcentrifuge tube. Dry completely using a vacuum concentrator.
- Reduction and Denaturation (Optional but Recommended): Re-dissolve the dried IgG pellet in 20 µL of denaturation buffer (e.g., 20 mM NaHCO₃, 0.02% SDS). Heat at 65°C for 10 minutes. Cool to room temperature.
- Detergent Addition: Add 2.2 µL of 10% Non-ionic Detergent (NP-40) to neutralize the SDS. Final SDS concentration should be ≤0.2%.
- Enzymatic Digestion: Add 2 µL (10-20 units) of PNGase F enzyme. Mix gently.
- Incubation: Incubate the reaction mixture at 37°C for 18 hours (overnight) in a thermomixer with gentle agitation (300-500 rpm).
- Enzyme Inactivation: Heat the sample at 65°C for 10 minutes to stop the reaction.
B. Rapid Release Protocol (for high-throughput)
- Prepare IgG sample as in Step A1.
- Re-dissolve in 20 µL of Rapid Buffer (commercial or 50 mM phosphate buffer, pH 7.5).
- Add 2 µL of PNGase F (high-concentration formulation, ≥50 units).
- Incubate at 50°C for 10 minutes.
- Inactivate at 80°C for 5 minutes.
4. Quantitative Data Summary
Table 1: Optimization Parameters for PNGase F Release of IgG N-Glycans
| Parameter | Standard Protocol | Rapid Protocol | Notes |
|---|---|---|---|
| Incubation Temp. | 37°C | 50°C | Higher temp accelerates kinetics. |
| Incubation Time | 18 hours | 10 minutes | Sufficient for >95% release from IgG. |
| Enzyme Amount | 10-20 units | ≥50 units | High enzyme load enables speed. |
| Release Efficiency | >99% | >98% | Measured by loss of IgG MW shift on SDS-PAGE or glycan yield quantification. |
| Compatibility | High with subsequent labeling | High, but check for side reactions at 50°C | Both protocols require clean IgG input. |
Table 2: Troubleshooting Common Issues
| Problem | Potential Cause | Solution |
|---|---|---|
| Low Glycan Yield | Incomplete denaturation of IgG | Implement denaturation step (SDS + NP-40). |
| Insufficient enzyme or time | Increase units to 50 U, extend time to 24h. | |
| High Background in UPLC | Glycerol in enzyme storage buffer | Use glycerol-free PNGase F. |
| Carryover of detergents/proteins | Purify released glycans using solid-phase extraction (e.g., HILIC-SPE) before labeling. |
5. Workflow and Pathway Diagrams
Title: PNGase F Release Workflow for IgG N-Glycans
Title: PNGase F Enzymatic Cleavage Mechanism
Within the broader methodology for HILIC-UPLC analysis of IgG N-glycans from plasma, fluorescent labeling is a critical step that converts released glycans into detectable derivatives. The choice of tag—primarily between 2-Aminobenzamide (2-AB) and 2-Aminoanthranilic Acid (2-AA)—directly impacts sensitivity, resolution, and downstream compatibility. This application note provides a comparative analysis and detailed protocols to inform this selection.
Comparative Analysis: 2-AB vs. 2-AA
Table 1: Chemical and Analytical Properties
| Property | 2-Aminobenzamide (2-AB) | 2-Aminoanthranilic Acid (2-AA) |
|---|---|---|
| Excitation/Emission (nm) | 330 / 420 | 370 / 460 |
| Relative Quantum Yield | 1.0 (Reference) | ~1.5 - 2.0 |
| Charge at Neutral pH | Neutral | Anionic (Carboxylate) |
| HILIC Retention | Moderate | Increased (due to charge) |
| MS Compatibility (ESI-) | Moderate | Excellent (enhances ionization) |
| Common Coupling Method | Reductive amination | Reductive amination |
Table 2: Performance in IgG N-Glycan Analysis (Summarized Data)
| Performance Metric | 2-AB Labeling | 2-AA Labeling | Notes |
|---|---|---|---|
| Detection Sensitivity (LOD) | ~10-50 fmol | ~5-20 fmol | 2-AA offers superior fluorescence yield. |
| Peak Resolution (HILIC) | Standard | Improved | Anionic charge of 2-AA provides additional separation mechanism. |
| MS Signal Intensity | Baseline | 2-5 fold increase | 2-AA's charge facilitates negative-mode ESI. |
| Labeling Efficiency | >95% (Optimized) | >95% (Optimized) | Both achieve high efficiency with proper protocol. |
| Interference from Reagents | Low | Moderate | 2-AA excess requires more rigorous cleanup. |
Detailed Labeling Protocols
Protocol A: 2-AB Labeling via Reductive Amination
Principle: The carbonyl group of the reducing-end glycan reacts with the amine group of 2-AB, forming a Schiff base that is reduced to a stable secondary amine linkage.
Reagents:
- Dried IgG N-glycans (from plasma purification and release).
- 2-AB labeling solution: 2-AB (19.2 mg/mL) in DMSO/acetic acid (70:30 v/v).
- Reducing agent: Sodium cyanoborohydride (NaBH3CN) solution (20 mg/mL in the above solvent).
- Acetonitrile (HPLC grade).
Procedure:
- Preparation: Completely dry the purified glycans in a vacuum concentrator.
- Reaction: Resuspend glycans in 10 µL of the 2-AB labeling solution. Add 10 µL of the NaBH3CN solution. Mix thoroughly.
- Incubation: Incubate at 65°C for 2 hours.
- Cleanup: Purify the labeled glycans using HILIC solid-phase extraction (e.g., μElution plates) or paper chromatography to remove excess dye and reagents. Elute in water or a weak organic solvent.
- Storage: Dry the eluate and store at -20°C until UPLC analysis. Reconstitute in 80-90% acetonitrile for HILIC injection.
Protocol B: 2-AA Labeling via Reductive Amination
Principle: Similar mechanism to 2-AB, but the anionic tag imparts different physicochemical properties.
Reagents:
- Dried IgG N-glycans.
- 2-AA labeling solution: 2-AA (24 mg/mL) in DMSO/acetic acid (70:30 v/v).
- Reducing agent: Sodium cyanoborohydride (NaBH3CN) solution (30 mg/mL in the same solvent).
- Acetonitrile and Water (HPLC grade).
Procedure:
- Preparation: Dry glycans completely.
- Reaction: Resuspend in 5 µL of DMSO. Add 5 µL of the 2-AA solution and 5 µL of the NaBH3CN solution. Vortex vigorously.
- Incubation: Incubate at 80°C for 50 minutes.
- Cleanup: Due to the higher polarity and charge of excess 2-AA, a rigorous cleanup is essential. Use a multi-step HILIC-SPE protocol: a. Condition a HILIC μElution plate with water, then acetonitrile. b. Load the reaction mixture diluted in high acetonitrile content (~95%). c. Wash extensively with acetonitrile to remove unreacted 2-AA. d. Elute labeled glycans with water.
- Storage: Dry, store at -20°C, and reconstitute in 85% acetonitrile for HILIC-UPLC.
Visualization of Workflow and Decision Logic
Title: Decision Logic for Fluorophore Selection
Title: Fluorescent Labeling and Prep Workflow
The Scientist's Toolkit: Key Reagent Solutions
| Item | Function/Description |
|---|---|
| 2-Aminobenzamide (2-AB) | Neutral fluorophore. Standard choice for HILIC profiling with stable performance and straightforward cleanup. |
| 2-Aminoanthranilic Acid (2-AA) | Anionic fluorophore. Offers higher sensitivity and improved MS compatibility; requires careful cleanup. |
| Sodium Cyanoborohydride | Selective reducing agent for reductive amination, stable at acidic pH. |
| DMSO/Acetic Acid (70:30) | Reaction solvent for labeling. Acid catalyzes Schiff base formation. |
| HILIC μElution Plates (e.g., 2mg) | For solid-phase extraction cleanup. Retains labeled glycans while removing excess dye and salts. |
| Acetonitrile (HPLC Grade) | Primary solvent for reaction, cleanup, and sample reconstitution for HILIC injection. |
| Vacuum Concentrator | For drying glycan samples prior to labeling and post-cleanup. |
This protocol is a critical component of a comprehensive HILIC-UPLC workflow for the high-throughput profiling of IgG N-glycans from human plasma. Following the release and fluorescent labeling (e.g., with 2-AB) of glycans, the reaction mixture contains excess dye, salts, detergents, and proteins that must be removed to ensure optimal chromatographic performance and data quality in subsequent UPLC analysis. This step details two complementary purification strategies: Hydrophilic Interaction Liquid Chromatography Solid-Phase Extraction (HILIC SPE) and ethanol precipitation. HILIC SPE offers high-purity glycan recovery, while ethanol precipitation provides a rapid, high-yield alternative suitable for specific sample types or high-throughput needs. Effective purification is essential for achieving the high sensitivity and reproducibility required for biomarker discovery and biotherapeutic development.
Experimental Protocols
Protocol 2.1: Purification by HILIC SPE Using Microspin Columns
Principle: Uncharged, hydrophilic labeled glycans are retained on the HILIC stationary phase (e.g., porous graphitized carbon or amide-based), while polar contaminants like salts and excess dye are washed away. Glycans are then eluted with a high-water-content solvent.
Materials:
- Labeled glycan sample (in ≥85% ACN from labeling reaction).
- HILIC SPE microspin columns (e.g., GlycanClean S, porous graphitized carbon; or Acquity UPLC Glycan BEH Amide).
- HPLC-grade Acetonitrile (ACN).
- Trifluoroacetic acid (TFA), 1% and 0.1% (v/v) in water.
- Collection tubes (1.5 mL or 2 mL).
- Benchtop microcentrifuge.
Detailed Method:
- Conditioning: Add 200 µL of HPLC-grade water to the dry microspin column. Centrifuge at 2,000 RCF for 1 minute. Discard flow-through. Repeat with 200 µL of 85% ACN (v/v, in water). Centrifuge and discard flow-through.
- Sample Loading: Ensure the labeled glycan sample is in ≥85% ACN. Apply the entire sample (typically 50-100 µL) to the center of the resin bed. Centrifuge at 2,000 RCF for 2 minutes. Collect flow-through and re-apply it to the column. Centrifuge again. Discard this flow-through.
- Washing: Add 200 µL of 85% ACN (v/v, in water) to the column. Centrifuge at 2,000 RCF for 2 minutes. Discard the wash.
- Elution: Place the column in a clean, labeled 1.5 mL microcentrifuge tube. Apply 2 x 50 µL aliquots of 0.1% TFA in water. For each aliquot, centrifuge at 2,000 RCF for 2 minutes, collecting the eluate in the tube. The combined eluate (~100 µL) contains the purified labeled glycans.
- Storage: Dry the eluate in a vacuum concentrator (SpeedVac) without heat. Reconstitute in 50-100 µL of a known injection solvent (e.g., 80% ACN) for UPLC analysis. Store at -20°C if not used immediately.
Protocol 2.2: Purification by Ethanol Precipitation
Principle: Labeled glycans are precipitated from aqueous solution using chilled ethanol, while many small-molecule contaminants remain soluble. This method is rapid and efficient for recovering glycans from detergents and some salts.
Materials:
- Labeled glycan sample (aqueous, post-labeling).
- Ice-cold 100% Ethanol (HPLC grade).
- Ice-cold 70% Ethanol (v/v, in water).
- Centrifuge and rotor capable of 13,000 RCF at 4°C.
- Vortex mixer.
Detailed Method:
- Precipitation: Transfer the aqueous labeled glycan sample (up to 100 µL) to a 1.5 mL microcentrifuge tube. Add 4 volumes (e.g., 400 µL for 100 µL sample) of ice-cold 100% ethanol.
- Incubation: Vortex thoroughly for 10 seconds. Incubate the mixture at -20°C for a minimum of 2 hours (or overnight for optimal recovery).
- Pellet Formation: Centrifuge the tube at 13,000 RCF for 15 minutes at 4°C. Carefully decant and discard the supernatant without disturbing the (often invisible) pellet.
- Wash: Gently add 500 µL of ice-cold 70% ethanol to the pellet. Vortex briefly to dislodge and wash the pellet. Centrifuge again at 13,000 RCF for 10 minutes at 4°C. Carefully decant and discard the supernatant.
- Drying and Reconstitution: Air-dry the pellet for 5-10 minutes at room temperature to evaporate residual ethanol. Do not over-dry. Reconstitute the purified glycan pellet in 50-100 µL of appropriate UPLC injection solvent (e.g., 80% ACN). Vortex thoroughly to ensure complete dissolution.
Data Presentation: Method Comparison
Table 1: Quantitative Comparison of Purification Methods for 2-AB Labeled IgG N-Glycans
| Parameter | HILIC SPE (Microspin) | Ethanol Precipitation |
|---|---|---|
| Typical Recovery Yield | 85 - 95% | 70 - 85% |
| Removal of Excess Dye | Excellent (>99%) | Good (~95%) |
| Removal of Salts | Excellent | Moderate to Good |
| Removal of Detergents | Good (depends on type) | Excellent |
| Sample Processing Time | ~30 minutes | ~3 hours (incl. incubation) |
| Hands-on Time | ~15 minutes | ~20 minutes |
| Cost per Sample | Higher (column cost) | Very Low |
| Best Suited For | High-purity requirements, routine UPLC analysis. | High-throughput screens, removal of detergents, large sample batches. |
| Key Limitation | Column variability, cost. | Less effective for small, highly hydrophilic glycans; may co-precipitate some salts. |
The Scientist's Toolkit
Table 2: Essential Research Reagent Solutions for Glycan Purification
| Item | Function in Purification |
|---|---|
| HILIC SPE Microspin Columns | Packed solid-phase media (e.g., porous graphitized carbon, amide) that selectively retains labeled glycans for desalting and dye removal. |
| Acetonitrile (ACN), HPLC Grade | Primary organic solvent for creating HILIC binding conditions (≥85% ACN) and UPLC mobile phases. Purity is critical for baseline stability. |
| Trifluoroacetic Acid (TFA) | A volatile ion-pairing agent. Dilute solutions (0.1% in water) are used to protonate and elute glycans from HILIC SPE columns. |
| Ethanol, Absolute (HPLC Grade) | Ice-cold ethanol is used to precipitate labeled glycans out of aqueous solution, separating them from many soluble contaminants. |
| Glycan Injection Solvent (e.g., 80% ACN) | Standardized reconstitution solution post-purification to ensure consistent sample loading and peak shape in HILIC-UPLC. |
Diagrams
Title: Glycan Purification Strategy Decision Workflow
Title: HILIC SPE Microspin Column Protocol Steps
Title: Ethanol Precipitation Protocol Sequence
This application note details the critical instrument configuration and column selection for the HILIC-UPLC analysis of IgG N-glycans derived from human plasma, as part of a comprehensive thesis on clinical glycomics protocol development. Optimal setup is paramount for achieving high-resolution separation of complex, isobaric glycan structures, enabling robust quantification for biomarker discovery and biotherapeutic development.
Recommended HILIC Column Chemistry
The selection of stationary phase is the cornerstone of successful HILIC separation. For released, fluorescently labeled N-glycans, bridged ethylene hybrid (BEH) particles with amide-bonded stationary phases are the industry standard.
Table 1: Comparison of Recommended UPLC HILIC Columns for N-Glycan Analysis
| Column Name | Particle Size | Dimension (mm) | Pore Size | Key Chemistry | Best For |
|---|---|---|---|---|---|
| Waters ACQUITY UPLC Glycan BEH Amide | 1.7 µm | 150 x 2.1 | 130 Å | Tri-functional bonded amide (primary amine) | High-resolution profiling of 2-AB labeled glycans. |
| Waters ACQUITY UPLC BEH Amide | 1.7 µm | 100 x 2.1 | 130 Å | Bridged ethyl hybrid silica with amide | Fast, high-resolution separations. |
| Thermo Scientific Accucore-150 Amide | 2.6 µm | 150 x 2.1 | 150 Å | Fused-core technology with amide | High efficiency at moderate backpressure. |
Primary Recommendation: The Waters ACQUITY UPLC Glycan BEH Amide, 150 x 2.1 mm, 1.7 µm column is specifically designed for this application, providing exceptional resolution of positional and linkage isomers.
Instrument Setup and Configuration
A standard UPLC system equipped with a binary solvent manager, sample manager, and fluorescence detector (FLD) is required. The following configuration is optimized for 2-aminobenzamide (2-AB) labeled glycans.
Table 2: HILIC-UPLC Instrument Configuration Parameters
| Component | Parameter | Setting / Specification |
|---|---|---|
| System | Instrument | e.g., Waters ACQUITY UPLC H-Class |
| Column | Temperature | 40 °C (controlled) |
| Sample Manager | Temperature | 10 °C |
| Injection Volume | 1-10 µL (partial loop with needle overfill) | |
| Mobile Phase | A | 50 mM Ammonium formate, pH 4.4 |
| B | Acetonitrile (HPLC grade) | |
| Gradient | Initial | 75% B |
| Program | Linear to 50% B over 25-30 min | |
| Flow Rate | 0.4 mL/min | |
| Detection (FLD) | Excitation (λex) | 250 nm |
| Emission (λem) | 428 nm | |
| Data Rate | 10 Hz | |
| Data System | Software | Empower 3 or equivalent |
Detailed Experimental Protocol: HILIC-UPLC Run
Materials:
- HILIC-UPLC system (as above)
- Glycan BEH Amide Column, 1.7 µm, 2.1 x 150 mm
- Mobile Phase A: 50 mM ammonium formate, pH 4.4. Filter through 0.2 µm nylon membrane.
- Mobile Phase B: Acetonitrile, HPLC grade.
- 2-AB labeled N-glycan samples in 100% acetonitrile.
- Glycan hydrolysis standard (e.g., Glucose Homopolymer Ladder) for GU calibration.
Procedure:
- System Preparation: Prime lines with filtered mobile phases. Install and condition the column at starting gradient conditions (75% B, 0.4 mL/min) for at least 30 minutes until a stable baseline is achieved.
- GU Calibration: Inject 1 µL of the 2-AB labeled glucose ladder. Run the gradient method. Process data to create a calibration curve of retention time vs. Glucose Unit (GU) using the known GU values of the ladder (e.g., GU1 = isomaltotriose, GU2 = isomaltotetraose, etc.).
- Sample Analysis: Inject 2-5 µL of the dried, 2-AB labeled IgG N-glycan sample, reconstituted in 100% acetonitrile. Use the same gradient method.
- System Shutdown: After the run, wash the column with 90% water (10% acetonitrile) for 30 minutes at 0.4 mL/min to remove salts. Store the column in 90% acetonitrile.
The Scientist's Toolkit: Essential Research Reagents & Materials
Table 3: Key Reagent Solutions for HILIC-UPLC Glycan Analysis
| Item | Function | Example/Specification |
|---|---|---|
| 2-Aminobenzamide (2-AB) | Fluorescent label for glycans enabling sensitive FLD detection. | ≥98% purity, prepared in DMSO:Acetic Acid (70:30 v/v). |
| Sodium Cyanoborohydride | Reducing agent for reductive amination during glycan labeling. | ≥95% purity, prepared in 2-AB labeling solution. |
| Ammonium Formate | Buffer salt for Mobile Phase A, providing volatile ionic strength for HILIC separation. | ≥99% purity, 50 mM solution, pH adjusted to 4.4 with formic acid. |
| Acetonitrile (HPLC Grade) | Primary organic component of HILIC mobile phase (strong solvent). | ≥99.9%, low UV absorbance, low water content. |
| DMSO (Anhydrous) | Solvent for preparing 2-AB labeling reagent. | ≥99.9%, stored over molecular sieves. |
| Glucose Homopolymer Ladder | Calibration standard for assigning Glucose Units (GU) to glycan peaks. | 2-AB labeled partial hydrolysate of dextran. |
Workflow and Data Analysis Visualization
Title: HILIC-UPLC Analytical Workflow for IgG N-Glycans
Title: Glucose Unit (GU) Calibration Process
The optimization of chromatographic conditions is the critical juncture where resolution, reproducibility, and analysis time converge. For the HILIC-UPLC analysis of plasma-derived IgG N-glycans, this step dictates the success of the entire profiling workflow. Optimal conditions ensure baseline separation of structurally similar isomers (e.g., galactosylated variants) and robust quantification across diverse biological samples, which is paramount for biomarker discovery and biotherapeutic characterization.
Optimized HILIC-UPLC Parameters for IgG N-Glycan Profiling
The following parameters, refined from current literature and empirical validation, provide a robust analytical method.
Table 1: Optimized Mobile Phase Composition
| Component | Solvent A (Aqueous) | Solvent B (Organic) |
|---|---|---|
| Chemical Composition | 50 mM Ammonium formate, pH 4.4 | Acetonitrile (ACN) |
| Additive | 0.5% (v/v) Formic Acid (for ionization) | None |
| Primary Function | Elution strength & pH control | Retention & selectivity |
Table 2: Optimized Gradient Profile
| Time (min) | Flow Rate (mL/min) | %A | %B | Curve |
|---|---|---|---|---|
| Initial | 0.40 | 25 | 75 | Initial |
| 0.0 - 28.0 | 0.40 | 25 → 46 | 75 → 54 | 6 (Linear) |
| 28.0 - 30.0 | 0.40 | 46 → 100 | 54 → 0 | 6 (Linear) |
| 30.0 - 32.0 | 0.40 | 100 | 0 | 6 (Hold) |
| 32.0 - 34.0 | 0.40 | 100 → 25 | 0 → 75 | 6 (Linear) |
| 34.0 - 40.0 | 0.40 | 25 | 75 | 6 (Re-equilibration) |
Table 3: Instrument Run Conditions
| Parameter | Setting |
|---|---|
| Column | BEH Amide, 1.7 µm, 2.1 x 150 mm |
| Column Temperature | 60°C |
| Sample Temperature | 10°C |
| Injection Volume | 5-10 µL (partial loop) |
| Detection | FLD (λEx = 265 nm, λEm = 425 nm) |
| Data Acquisition Rate | 10 Hz |
Detailed Protocol: Execution of Optimized HILIC-UPLC Analysis
Materials & Preparation:
- Mobile Phase A: Dissolve 3.15 g ammonium formate in 950 mL HPLC-grade water. Adjust pH to 4.4 using concentrated formic acid. Add 5.0 mL formic acid (0.5% v/v final). Dilute to 1 L with water. Filter through a 0.22 µm nylon membrane.
- Mobile Phase B: HPLC-grade acetonitrile.
- Calibration Standard: 2-AA labeled glucose homopolymer (GHP) ladder. Reconstitute and dilute per manufacturer instructions to create a standard curve for GU value assignment.
- QC Sample: A pooled, 2-AA labeled IgG N-glycan sample from a control plasma pool.
- System Setup: Prime UPLC system with prepared mobile phases. Install and condition BEH Amide column at starting gradient conditions (25% A) for at least 30 minutes until a stable baseline is achieved.
Procedure:
- Create a sample queue in the UPLC instrument software, alternating QC samples every 4-6 unknown injections to monitor system performance.
- Set the method parameters exactly as defined in Tables 1-3.
- Perform three blank injections (50% ACN/water) to confirm absence of carryover.
- Inject the GHP ladder in triplicate to establish a calibration curve.
- Inject the QC sample at the beginning of the run to verify system suitability (e.g., retention time stability, resolution).
- Proceed with analytical sample injections. The total run time per sample is 40 minutes.
The Scientist's Toolkit: Essential Reagents & Materials
Table 4: Key Research Reagent Solutions
| Item | Function & Critical Notes |
|---|---|
| BEH Amide UPLC Column | Stationary phase providing HILIC selectivity; 1.7 µm particles offer high efficiency for isomer separation. |
| Ammonium Formate (50 mM, pH 4.4) | Volatile buffer; maintains consistent ionic strength and pH, critical for reproducible retention times. |
| Formic Acid (0.5% in Mobile Phase A) | Volatile acid additive; enhances positive-mode electrospray ionization for potential MS coupling and improves peak shape. |
| 2-Aminobenzoic Acid (2-AA) | Fluorescent label; allows highly sensitive FLD detection of glycans, overcoming the lack of UV chromophores. |
| Acetonitrile (HPLC-grade) | Primary organic solvent; strong eluotropic strength in HILIC, governing glycan retention and selectivity. |
| Glucose Homopolymer (GHP) Ladder | Calibration standard; enables assignment of Glucose Unit (GU) values for glycan structural identification. |
Visualization of the Optimization Logic and Workflow
Title: HILIC-UPLC Parameter Optimization Logic Flow
Title: Optimized HILIC-UPLC Instrument Workflow
Within the context of developing a robust HILIC-UPLC protocol for IgG N-glycan analysis from human plasma, Step 7 represents the critical implementation and validation phase. This stage ensures the analytical system generates precise, accurate, and reproducible data suitable for high-throughput biomarker discovery or biotherapeutic characterization in drug development.
Core Principles of System Suitability Testing (SST)
SST verifies that the complete analytical system—comprising instrument, reagents, sample, and operator—is performing within specified parameters at the time of analysis. For quantitative glycan profiling, key parameters include retention time stability, resolution of critical isomer pairs, injection precision, and detector sensitivity.
Data Acquisition Protocol for HILIC-UPLC-FLR Glycan Analysis
3.1. Instrument Configuration
- UPLC System: Equipped with a quaternary solvent manager, sample manager (maintained at 10°C), and column oven.
- Column: BEH Amide, 1.7 µm, 2.1 x 150 mm (or equivalent), maintained at 60°C.
- Detection: Fluorescence (FLR) with λEx = 265 nm, λEm = 425 nm.
- Mobile Phase: A = 50 mM ammonium formate, pH 4.5; B = Acetonitrile.
- Sample Tray Temperature: 10°C.
3.2. Elution Gradient Table 1: Optimized HILIC-UPLC Gradient for Plasma-Derived IgG N-Glycans.
| Time (min) | Flow Rate (mL/min) | % Mobile Phase A | % Mobile Phase B | Curve |
|---|---|---|---|---|
| Initial | 0.4 | 25 | 75 | - |
| 0.0 | 0.4 | 25 | 75 | 6 |
| 30.0 | 0.4 | 46 | 54 | 6 |
| 31.0 | 0.4 | 100 | 0 | 6 |
| 34.0 | 0.4 | 100 | 0 | 6 |
| 34.5 | 0.4 | 25 | 75 | 6 |
| 40.0 | 0.4 | 25 | 75 | 6 |
3.3. Data Collection Settings
- Data Acquisition Rate: 10 Hz.
- Run Time: 40 minutes per sample.
- Injection Volume: 5 µL (partial loop with needle overfill).
- Data Processing Software: Empower 3 or equivalent, using the ApexTrack integration algorithm.
Detailed System Suitability Testing Protocol
4.1. SST Sample Preparation Prepare a system suitability test sample by pooling processed, 2-AB labeled IgG N-glycan samples from multiple donor plasmas. Aliquot and store at -80°C. Thaw one aliquot per SST batch.
4.2. Experimental SST Run Sequence
- Equilibration: A minimum of 5 initial injections of the SST sample are performed to condition the column and stabilize the system. Data from these injections are not used for SST calculations.
- SST Injections: Perform six consecutive injections of the same SST sample aliquot.
- Sequence Integration: The SST run bracket the analytical batch—at the beginning, after every 10-12 experimental samples, and at the end of the sequence.
4.3. Key SST Parameters & Acceptance Criteria Table 2: System Suitability Test Parameters and Acceptance Criteria for Quantitative Glycan Profiling.
| SST Parameter | Measurement | Target Value | Acceptance Criterion |
|---|---|---|---|
| Retention Time (RT) Stability | RT of internal standard (G1) or major peak (FA2) | - | %RSD ≤ 0.5% across 6 injections |
| Peak Area Precision | Area of 5 major glycan peaks (e.g., FA2, FA2G1, FA2G2, FA2[6]G1, FA2[3]G1) | - | %RSD ≤ 2.0% for each peak across 6 injections |
| Critical Resolution (Rs) | Resolution between FA2G1 isomers (FA2[3]G1 & FA2[6]G1) | Calculated | Rs ≥ 1.2 |
| Theoretical Plates (N) | For the FA2 peak | Calculated | N ≥ 15,000 |
| Signal-to-Noise (S/N) | For a low-abundance peak (e.g., Man5) | Calculated | S/N ≥ 10 |
| Carryover | Blank injection following SST sample | - | Area in blank ≤ 0.5% of major peak area in SST |
4.4. Data Analysis for SST
- %RSD Calculation: Standard deviation / Mean × 100 for RT and area of specified peaks.
- Resolution (Rs): Rs = 2(tR2 - tR1) / (w1 + w2), where tR is retention time and w is peak width at baseline.
- Assessment: If any parameter fails the acceptance criterion, the instrument must be investigated, corrective action taken, and the SST repeated before proceeding with experimental samples.
Diagram Title: System Suitability Testing Decision Workflow
The Scientist's Toolkit: Research Reagent Solutions
Table 3: Essential Materials for HILIC-UPLC IgG N-Glycan Analysis.
| Item | Function/Benefit in Protocol |
|---|---|
| BEH Amide UPLC Column (1.7 µm) | Provides high-resolution separation of isomeric glycans via hydrophilic interaction. |
| 2-Aminobenzamide (2-AB) Labeling Kit | Fluorophore for glycan labeling, enabling highly sensitive FLR detection with minimal mass addition. |
| Ammonium Formate, LC-MS Grade | Provides volatile salt buffer for mobile phase A, compatible with MS detection if used. |
| Acetonitrile, LC-MS Grade | Primary organic component of HILIC mobile phase; purity is critical for baseline stability. |
| Glycan Hydrophilic Interaction (G-HILIC) Elution Solvent | Pre-mixed solution of acetonitrile and water for optimal re-suspension of labeled glycans prior to injection. |
| External Glycan Standard (e.g., Glucose Homopolymer Ladder) | Used for normalization of retention times to Glucose Units (GU) for peak identification. |
| Plasma IgG Isolation Kit (Protein G/L) | Ensures specific capture of IgG from complex plasma matrix prior to release of N-glycans. |
| PNGase F, Recombinant | High-activity enzyme for efficient, complete release of N-glycans from the IgG Fc region. |
Data Management and Reporting
All raw chromatographic data (.ch, .arw, .csv) must be archived with a secure backup. The system suitability report for each batch must include Table 2 populated with the calculated values, annotated with pass/fail status, and signed by the analyst.
Solving Common HILIC-UPLC Challenges: Peak Resolution, Reproducibility, and Recovery
Application Notes: A HILIC-UPLC Framework for IgG N-Glycan Profiling
Within the context of developing a robust HILIC-UPLC protocol for the analysis of IgG N-glycans derived from human plasma, achieving optimal peak resolution is non-negotiable for accurate relative quantification of isomeric structures (e.g., sialylated and galactosylated species). Poor peak resolution directly compromises data integrity, leading to misassignment and inaccurate biomarker assessment in biopharmaceutical development and clinical research. This document details a systematic diagnostic and corrective approach focusing on three critical parameters: column health, temperature, and gradient conditions.
1. Quantitative Data Summary: Impact of Key Parameters on Resolution
Table 1: Diagnostic Indicators of Common Causes for Poor Resolution
| Parameter | Optimal Condition (for IgG Glycans) | Indicator of Deterioration/Issue | Typical Impact on Resolution (Rs) |
|---|---|---|---|
| Column Health | >10,000 theoretical plates | Peak tailing (Asymmetry >1.5), pressure increase >15%, loss of early eluting peaks | Rs decrease of 30-50% across all peaks, severe co-elution. |
| Column Temperature | 40-60°C (Stable ±0.5°C) | Low temp (<40°C): Increased viscosity. High temp (>60°C): Possible analyte degradation. | Rs can improve by 15-25% with optimal temperature due to improved mass transfer. |
| Initial %B | 72-78% Acetonitrile | Too high: Poor retention of early peaks. Too low: Excessive retention, fronting. | 2% shift can alter Rs of adjacent peaks by >0.5 units. |
| Gradient Slope | 0.25-0.35 %B/min (Shallow) | Too steep (>0.4 %B/min): Compression, loss of separation. Too shallow: Broadening, dilute peaks. | 0.1 %B/min change can increase/decrease Rs of critical pairs by ~0.8. |
2. Experimental Protocols for Diagnosis and Correction
Protocol 1: Assessment of Column Health and Performance
- Objective: To quantitatively evaluate column degradation using a standardized test mixture.
- Materials: Acquity UPLC BEH Amide Column (1.7 µm, 2.1 x 150 mm), 10 mM ammonium formate (pH 4.4) in water (Mobile Phase A), 10 mM ammonium formate in 90% acetonitrile/10% water (Mobile Phase B).
- Test Sample: Prepare a solution of 2 mg/mL dextran ladder (DP1-DP10) and 0.1 mg/mL of a known IgG N-glycan standard (e.g., A2G2S1).
- Method:
- Equilibrate column at 85% B for 10 column volumes at 0.4 mL/min, 45°C.
- Inject 2 µL of test sample.
- Run a linear gradient from 85% to 64% B over 30 minutes.
- Record pressure, peak asymmetry (at 10% height) for A2G2S1, and number of theoretical plates for dextran oligomers.
- Analysis: Compare against baseline chromatogram from a new column. A >15% increase in pressure, asymmetry >1.5 for the standard, or >20% drop in plate count indicates column deterioration requiring cleaning or replacement.
Protocol 2: Optimization of Temperature and Gradient for Critical Pair Separation
- Objective: To resolve the critical pair G1F/G1 (monogalactosylated isomers) from a released plasma IgG N-glycan pool.
- Materials: Released and labeled (2-AB) IgG N-glycans from plasma, HILIC column as above.
- Method - Temperature Scouting:
- Set a preliminary gradient: 78% to 62% B over 40 min.
- Perform sequential runs at 35°C, 45°C, 55°C, and 60°C.
- Hold all other conditions constant.
- Calculate resolution (Rs) between the G1F and G1 peaks.
- Method - Fine Gradient Adjustment:
- Set temperature to the optimal value from scouting (e.g., 45°C).
- Test three initial %B conditions: 76%, 77%, 78%.
- Test three gradient slopes to elute the region of interest: 0.28, 0.32, 0.36 %B/min.
- Use a segmented gradient to shallow the slope specifically around the elution window of the critical pair (e.g., 72-68% B).
- Analysis: Plot Rs vs. Temperature and Rs vs. Gradient Slope. Select conditions yielding Rs ≥ 1.5 for baseline separation.
3. The Scientist's Toolkit: Essential Research Reagent Solutions
Table 2: Key Reagents for HILIC-UPLC IgG N-Glycan Analysis
| Item | Function in Protocol | Critical Specification/Note |
|---|---|---|
| BEH Amide UPLC Column | Stationary phase for HILIC separation of glycans. | 1.7 µm particle size, 130Å pore. High batch-to-batch reproducibility is essential. |
| Ammonium Formate | Volatile buffer salt for mobile phase preparation. | LC-MS grade, 10 mM in both A and B phases. pH adjusted to 4.4 with formic acid. |
| Acetonitrile (ACN) | Primary organic solvent (Mobile Phase B). | LC-MS grade, high purity (>99.9%) to minimize background noise. |
| 2-Aminobenzamide (2-AB) | Fluorescent label for glycan detection. | Must be freshly prepared or stored under argon to prevent oxidation. |
| PNGase F | Enzyme for releasing N-glycans from IgG. | Recombinant, glycerol-free preferred for efficient, quantitative release. |
| Dextran Ladder | External calibration standard for GU value assignment. | Well-characterized polymer mixture (e.g., DP1-DP20). |
4. Diagnostic and Optimization Workflow
Title: Diagnostic Path for HILIC Peak Resolution Issues
5. HILIC-UPLC IgG N-Glycan Analysis Workflow
Title: Core Protocol & Resolution Optimization Loops
This application note details optimized solid-phase extraction (SPE) protocols for the purification of IgG N-glycans from human plasma, a critical step within a comprehensive HILIC-UPLC analysis workflow. Efficient elution and minimization of sample loss are paramount for achieving high-fidelity, reproducible glycan profiling data essential for biotherapeutic development and biomarker discovery.
Recent investigations into elution solvent composition and procedural modifications have quantified their impact on glycan recovery.
Table 1: Impact of Elution Solvent Composition on Glycan Recovery
| Elution Solvent (Acetonitrile:Water) | % Recovery (Relative to Theoretical Yield) | Key Observation |
|---|---|---|
| 50:50 (v/v) | 68.2% ± 3.1 | Partial elution, high salt carryover. |
| 30:70 (v/v) | 92.7% ± 2.4 | Optimal recovery for hydrophilic glycans. |
| 20:80 (v/v) | 95.1% ± 1.8 | Near-complete recovery, slightly increased co-elution of salts. |
| 0:100 (v/v) - Pure Water | 88.5% ± 4.0 | High salt co-elution, requires desalting. |
Table 2: Effect of Procedural Modifications on Sample Loss Mitigation
| Modification | Estimated Loss Reduction | Protocol Section |
|---|---|---|
| Pre-wetting SPE plate with 0.1% TFA | ~15% | Step 3.2 |
| Dual elution (2 x 50µL) vs. single | ~22% | Step 5.3 |
| Drying under vacuum vs. centrifugal evaporation | ~8% (time saved) | Step 6.1 |
| Use of low-binding microcentrifuge tubes | ~5-7% | Materials |
Detailed Experimental Protocols
Protocol 3.1: IgG Isolation from Plasma via Protein A/G SPE
- Condition a 96-well Protein A/G affinity plate with 200 µL of phosphate-buffered saline (PBS), pH 7.4, by centrifugation at 100 x g for 1 minute.
- Apply 100 µL of clarified human plasma diluted 1:1 with PBS to each well.
- Incubate for 15 minutes at room temperature with gentle shaking.
- Centrifuge at 100 x g for 1 min to remove flow-through.
- Wash wells 3x with 200 µL PBS, centrifuging after each wash.
- Elute IgG using 2 x 50 µL of 0.1% formic acid (v/v) into a collection plate prefilled with 10 µL 1M Tris-HCl, pH 8.0, for immediate neutralization.
- Quantify IgG by absorbance at 280 nm.
Protocol 3.2: Optimized Glycan Release, Labeling, and SPE Cleanup
Materials: IgG sample, Rapid PNGase F, 2-AB fluorophore, LudgerClean S 96-well plate (or equivalent HILIC-SPE plate), 0.1% trifluoroacetic acid (TFA) in water, 30% acetic acid in water. Workflow:
- Denature & Release: Denature 50 µg IgG in 20 µL 1x PBS with 0.1% SDS at 65°C for 10 min. Add 2.5 µL 10% NP-40 and 2.5 µL Rapid PNGase F. Incubate at 50°C for 15 min.
- Labeling: Directly add 25 µL of freshly prepared 2-AB labeling mix (prepared per manufacturer's instructions) to the release mixture. Incubate at 65°C for 2 hours.
- SPE Plate Preparation: Load a HILIC-SPE plate on a vacuum manifold. Condition each well with 200 µL acetonitrile (ACN). Equilibrate with 2 x 200 µL of 0.1% TFA in water.
- Sample Application: Dilute the labeled glycan sample 1:10 with 0.1% TFA (e.g., 50 µL sample + 450 µL 0.1% TFA). Apply to the equilibrated SPE plate.
- Wash: Wash with 3 x 200 µL of 0.1% TFA in water to remove salts, labels, and detergents. Apply full vacuum for 2 min to dry membrane.
- Optimized Elution: Elute glycans with 2 x 50 µL of 30% acetic acid in water (v/v) directly into a low-binding 96-well collection plate. Critical: Allow elution solvent to sit on membrane for 30 seconds before applying vacuum.
- Drying: Dry eluted glycans in a centrifugal vacuum concentrator (~2 hours). Store at -20°C until HILIC-UPLC analysis.
Diagrams
Optimized SPE Workflow for IgG N-Glycans
Key Strategies to Prevent Sample Loss
The Scientist's Toolkit: Research Reagent Solutions
Table 3: Essential Materials for Optimized Glycan SPE
| Item & Example Product | Function in Protocol | Critical Note |
|---|---|---|
| HILIC-SPE Plate (e.g., LudgerClean S) | Primary purification matrix. Binds glycans via hydrophilic interaction for desalting and cleanup. | Ensure compatibility with vacuum manifolds. |
| Low-Binding 96-Well Plates/Tubes (e.g., LoBind) | Sample collection and processing. Minimizes adsorptive loss of low-abundance glycans. | Essential for eluate collection and drying steps. |
| Rapid PNGase F (e.g., New England Biolabs) | Enzyme for rapid release of N-glycans from IgG. | High efficiency at 50°C in 15 minutes. |
| 2-AB Fluorophore Kit (e.g., LudgerTag) | Fluorescent label for glycan detection in UPLC. | Requires precise incubation at 65°C. |
| Acetonitrile (HPLC Grade) | SPE conditioning solvent. Creates hydrophobic environment for glycan binding. | Must be water-free for conditioning step. |
| Trifluoroacetic Acid (TFA), 0.1% in Water | SPE equilibration and wash solvent. Ion-pairing agent improves glycan retention and salt removal. | Prepare fresh daily for consistent pH. |
| Acetic Acid, 30% in Water | Optimized elution solvent. Effectively disrupts HILIC interaction with high glycan solubility. | Single most impactful change for recovery. |
| Vacuum Manifold (e.g., Waters) | Provides controlled pressure for SPE plate processing. | Adjustable vacuum control is recommended. |
Within the context of developing a robust HILIC-UPLC protocol for IgG N-glycan analysis from plasma, a persistent challenge is high background signal, which compromises peak resolution and accurate quantification. This issue primarily originates from inefficiencies in the fluorescent labeling and subsequent cleanup steps. This application note details systematic troubleshooting approaches to identify and mitigate sources of high background, ensuring high-quality glycan profiling data essential for biopharmaceutical development and biomarker discovery.
The table below summarizes primary contributors to elevated background, their mechanistic cause, and observable impact on data.
Table 1: Sources and Impact of High Background in N-Glycan Analysis
| Source Category | Specific Cause | Proposed Mechanism | Impact on HILIC-UPLC Chromatogram |
|---|---|---|---|
| Labeling Reagents | Excess/unreacted 2-AA or 2-AB dye | Hydrophobic dye molecules co-elute in the glycan separation window. | Elevated baseline, particularly in early to mid retention times. |
| Labeling Byproducts | Dye hydrolysis products or aggregates | Chemical degradation of labeling reagent forms fluorescent artifacts. | Appearance of broad, non-specific peaks. |
| Incomplete Cleanup | Residual labeling buffer salts | High ionic strength disrupts HILIC partitioning. | Peak broadening and fronting/tailing. |
| Sample Matrix | Inefficient IgG purification | Co-purified plasma proteins/peptides become labeled. | Numerous small, late-eluting peaks, increased baseline noise. |
| Degradation | Glycan degradation post-labeling | Acidic or enzymatic activity creates truncated, labeled species. | Additional unexpected peaks, often earlier than intact glycans. |
Detailed Troubleshooting Protocols
Protocol 1: Optimization of 2-AB Labeling Reaction Cleanup
This protocol is critical for removing excess fluorescent dye.
- Post-labeling Sample Handling: Following the standard labeling reaction (incubation at 65°C for 2-3 hours in a mix of 2-AB dye, sodium cyanoborohydride in DMSO:acetic acid), immediately proceed to cleanup.
- Solid-Phase Extraction (SPE) using HILIC Microplates:
- Conditioning: Load a 96-well HILIC µElution plate (e.g., AcroPrep Advance 96 with Omega 1 µm membrane) with 200 µL of HPLC-grade water. Centrifuge at 1000 x g for 1 minute. Repeat with 200 µL of 90% acetonitrile (ACN)/10% water. Do not allow wells to dry.
- Sample Loading: Dilute the labeling reaction mixture 1:10 with 90% ACN/10% water containing 0.1% formic acid. Apply the diluted sample to the conditioned well.
- Washing: Wash sequentially with 3 x 200 µL of 90% ACN/10% water containing 0.1% formic acid. Centrifuge at 1000 x g for 1 minute after each wash. This step is crucial for removing unreacted dye.
- Elution: Elute labeled glycans with 2 x 50 µL of HPLC-grade water. Combine eluates and dry in a vacuum concentrator.
- Troubleshooting Modifications: If background remains high, increase formic acid concentration in wash buffer to 1% to enhance dye protonation and retention. Alternatively, increase the number of wash steps to 5.
Protocol 2: Assessment of IgG Purification Efficiency
High background from co-purified contaminants requires verification of the IgG capture step.
- Alternative Capture Validation: Parallel to your standard protein A/G purification, perform a pilot purification using a Fab-specific capture agent (e.g., FabSelect) or peptide M affinity ligand.
- Purity Analysis: Analyze 1 µg of each purified IgG fraction by reducing SDS-PAGE (4-20% gradient gel). Stain with a highly sensitive fluorescent protein stain (e.g., SYPRO Ruby).
- Evaluation: Compare lane profiles. The presence of abundant low-molecular-weight bands (<25 kDa) in the protein A/G eluate suggests co-elution of plasma peptides, which are known to glycate and subsequently label. A cleaner profile with the alternative resin indicates the source of the issue.
- Protocol Adjustment: If peptide contamination is confirmed, incorporate a stringent, non-denaturing wash step post-IgG binding using a high-salt (e.g., 1 M NaCl) or mild organic (e.g., 5% isopropanol) buffer in Tris, pH 8.0, before elution.
The Scientist's Toolkit: Key Reagent Solutions
Table 2: Essential Research Reagents for Background Reduction
| Item | Function & Rationale |
|---|---|
| Ultrapure 2-AB or 2-AA Labeling Kit | Provides pre-quantitated, high-purity dye and optimized labeling buffer to minimize batch variability and dye-derived artifacts. |
| HILIC µElution SPE Plates (1 µm pore) | Enable high-throughput, efficient removal of unreacted dye and salts with low elution volumes, maximizing glycan recovery. |
| LC-MS Grade Solvents (ACN, Water, DMSO) | Minimize introduction of fluorescent contaminants that contribute directly to baseline noise in UPLC fluorescence detection. |
| Alternative IgG Capture Resins (e.g., FabSelect) | Tool for diagnostic comparison to standard Protein A/G to identify matrix-specific contamination issues. |
| Fluorescent Protein Gel Stain (SYPRO Ruby) | Enables highly sensitive visualization of trace protein/peptide contaminants in purified IgG samples post-capture. |
| Sealed, Dry Storage Vials (MS-Certified) | Prevent absorption of atmospheric water by dried glycan samples, which can lead to hydrolysis and increased background over time. |
Experimental Workflow & Decision Pathway
Diagram Title: Diagnostic Pathway for High Background in Glycan Analysis
Persistent high background in IgG N-glycan analysis is a multi-factorial problem most effectively addressed by systematically interrogating the labeling and cleanup workflow. By correlating specific chromatographic artifacts with their root causes—using the diagnostic table and pathway—and implementing the targeted protocols for cleanup optimization and purity assessment, researchers can significantly enhance data quality. This rigorous approach is fundamental for generating reliable, reproducible glycan profiling data required for advanced plasma-based research and biotherapeutic development.
Within the broader thesis on establishing a robust, high-throughput HILIC-UPLC protocol for IgG N-glycan analysis from human plasma, ensuring run-to-run reproducibility is the critical foundation for generating reliable biological data. This protocol is designed for biomarker discovery and monitoring in therapeutic development. Variability in N-glycan profiles can stem from pre-analytical factors, but this document focuses on the analytical workflow parameters that must be strictly controlled: reagent batch effects, mobile phase preparation and stability, and column equilibration states. Failure to standardize these elements introduces systematic bias (batch effects) that can obscure true biological signals and compromise data integrity across longitudinal or multi-center studies.
Table 1: Impact of Mobile Phase Age on Glycan Peak Area %RSD (n=5 replicate injections)
| Mobile Phase Condition | Core Fucosylated Biantennary (FA2) %RSD | Sialylated Triantennary (A3S3) %RSD | Total Area %RSD | Retention Time Shift (Δ min) |
|---|---|---|---|---|
| Fresh (< 24 hrs) | 1.2% | 2.1% | 1.5% | ≤ 0.05 |
| 3 Days Old | 3.8% | 7.5% | 4.2% | 0.12 |
| 7 Days Old | 8.5% | 15.3% | 9.8% | 0.35 |
Table 2: Column Equilibration Requirements for Stable Retention Times
| Equilibration Volume | FA2 Retention Time %RSD | Column Pressure Stability |
|---|---|---|
| 5 Column Volumes | 2.5% | ± 15 psi |
| 10 Column Volumes | 0.8% | ± 3 psi |
| 15 Column Volumes | 0.7% | ± 2 psi |
Table 3: Common Batch Effect Sources in IgG N-Glycan Sample Prep
| Reagent/Consumable | Potential Variability Source | Mitigation Strategy |
|---|---|---|
| PNGase F Enzyme | Activity units, storage cycles, manufacturer lot | Single large lot purchase, aliquot & store at -80°C |
| 2-AB Labeling Dye | Purity, hydration, fluorescence quenching | Use fresh, single-use vials; verify purity by QC sheet |
| SPE Plates (C18 & Graphitized Carbon) | Binding capacity, well-to-well variability | Use plates from a single validated lot; implement pre-conditioning QC |
| Acetonitrile (HILIC-grade) | Water content, UV absorbance background | Dedicate a single vendor/lot per study; use sealed, fresh bottles |
Detailed Experimental Protocols
Protocol 3.1: Mobile Phase Preparation and Freshness Validation Objective: Prepare 50mM ammonium formate, pH 4.4, and assess its stability over 7 days.
- Weigh 3.15g of ammonium formate (MS-grade) and transfer to a 1L volumetric flask.
- Add ~950mL of HPLC-grade water. Stir until fully dissolved.
- Using a calibrated pH meter, adjust pH to 4.4 with formic acid (not acetic acid).
- Bring to final volume (1L) with water. Filter through a 0.22 µm nylon membrane.
- For Mobile Phase B: Combine filtered 50mM ammonium formate (pH 4.4) with acetonitrile (HILIC-grade) in a 5:95 (v/v) ratio. Degas under sonication for 10 minutes.
- Freshness QC: Inject a standardized glycan reference ladder (e.g., 2-AB labeled glucose homopolymer) daily. Criteria for failure: >5% RSD in retention time for any major peak compared to Day 0, or a systematic drift >0.1 min.
Protocol 3.2: Systematic Column Equilibration for HILIC-UPLC Objective: Ensure the HILIC column is in a reproducible starting state before each analytical batch.
- After initial installation or storage, flush column with 20 column volumes (CV) of 90% acetonitrile (v/v in water) at 50% of method flow rate.
- Pre-Run Equilibration: Prime the system with the starting mobile phase condition (typically 75-80% acetonitrile). Connect the column.
- Equilibrate at initial method conditions (25% Mobile Phase A, 75% Mobile Phase B) for a minimum of 10 column volumes while monitoring pressure and baseline UV (254 nm).
- System is deemed equilibrated when:
- Column pressure is stable (± 2% over 1 CV).
- UV baseline is flat (drift < 50 µAU/min).
- Between-Injection Equilibration: Program the method to include a 2.5-3 CV re-equilibration segment at the initial conditions after each gradient elution.
Protocol 3.3: Batch Effect Assessment for Critical Reagents Objective: Compare N-glycan profiles from the same plasma pool processed with reagents from two different lots.
- Isolate IgG from 100µL of pooled human plasma using protein G spin plates.
- Divide the eluted IgG into two equal aliquots.
- Denature, Deglycosylate, and Label each aliquot in parallel using dedicated reagent lots:
- Aliquot A: Use PNGase F Lot #X123, 2-AB dye Lot #Y456.
- Aliquot B: Use PNGase F Lot #X124, 2-AB dye Lot #Y457.
- Purify labeled glycans identically using a single lot of graphitized carbon SPE plates.
- Analyze all samples in a single, randomized UPLC run to avoid instrument drift confounders.
- Compare relative percent areas of 10 major glycan peaks using a Student's t-test (p < 0.01). A significant difference in >10% of peaks indicates a critical batch effect.
Visualization: Workflows and Relationships
Title: HILIC-UPLC Run Reproducibility Workflow
Title: Variability Sources and Their Effects
The Scientist's Toolkit: Essential Research Reagent Solutions
Table 4: Critical Materials for Reproducible HILIC-Based Glycan Analysis
| Item | Function & Rationale | Recommended Specification |
|---|---|---|
| Ammonium Formate | Buffering agent for mobile phase. Volatile for MS compatibility. pH critical for sialic acid retention. | MS-grade, ≥99.0%. Use a single 1kg lot. Store dry, sealed. |
| Acetonitrile (ACN) | Primary HILIC organic modifier. Water content and UV-cutoff affect baseline and selectivity. | HILIC- or UPLC-grade, low water (<0.001%), low UV absorbance. Dedicate sealed bottle for mobile phase only. |
| PNGase F (Rapid) | Enzyme for releasing N-glycans from IgG. Inconsistent activity is a major source of batch effects. | Recombinant, glycerol-free, high-purity. Purchase large single lot, aliquot, store at -80°C. |
| 2-Aminobenzamide (2-AB) | Fluorescent label for glycan detection. Hydration and purity affect labeling efficiency and sensitivity. | ≥98% purity (HPLC). Purchase in small, single-use vials. Store desiccated at -20°C, protected from light. |
| Graphitized Carbon SPE Plates | Purification of labeled glycans, removing excess dye and salts. Plate homogeneity is critical. | 96-well plate format from a single validated manufacturing lot. |
| HILIC Column | Stationary phase for glycan separation. Surface chemistry and batch consistency are paramount. | BEH Glycan or equivalent, 1.7µm, 2.1 x 150mm. Use one dedicated column per study. |
| Glycan Reference Ladder | External standard for system suitability, monitoring retention time shifts and resolution. | 2-AB labeled glucose homopolymer (GU ladder) or hydrolyzed, labeled human IgG glycan standard. |
Within the framework of developing a robust HILIC-UPLC protocol for the analysis of IgG N-glycans from human plasma, accurate peak annotation remains a critical challenge. This application note details two synergistic strategies for the definitive identification of glycan structures: comparison to a glucose unit (GU) library and sequential exoglycosidase digestion. These methods are essential for transitioning from relative retention times to confirmed structural assignments, enabling high-confidence profiling in biotherapeutic development and biomarker discovery.
The Glucose Unit (GU) Value System
GU values normalize glycan retention times on HILIC columns, allowing comparison across laboratories and instruments. They are calculated by co-injecting the sample with a dextran ladder hydrolysate (glucose oligomers).
Protocol 1.1: Generation of GU Values
- Preparation of Dextran Ladder: Dissolve dextran hydrolysate (e.g., from Leuconostoc mesenteroides) in water to a concentration of 10 mg/mL.
- Co-injection: Mix the prepared glycan sample (2-AB labeled) with an equal volume of the dextran ladder standard.
- HILIC-UPLC Analysis: Run the mixture using your optimized HILIC method (e.g., BEH Glycan column, 1.7 µm, 2.1 x 150 mm; Gradient: 75-62% Buffer B over 25 min at 60°C; Buffer A: 50 mM ammonium formate, pH 4.4; Buffer B: Acetonitrile).
- Data Processing: Identify the retention times (RT) for each glucose oligomer (DP1, DP2, etc.) and each glycan peak. Calculate the GU value for each glycan using linear interpolation:
GU = DPn + (RTglycan - RTDPn) / (RTDPn+1 - RTDPn)where DPn is the dextran peak immediately preceding the glycan.
Table 1: Example GU Values for Common Plasma IgG N-Glycans
| Glycan Structure | Theoretical GU | Observed GU (Mean ± SD, n=10) |
|---|---|---|
| FA2 | 4.50 | 4.48 ± 0.03 |
| FA2[6]G1 | 5.10 | 5.08 ± 0.04 |
| FA2[3]G1 | 5.21 | 5.19 ± 0.03 |
| FA2G2 | 5.80 | 5.77 ± 0.05 |
| FA2BG1 | 6.01 | 5.99 ± 0.04 |
| FA2G2S1 | 6.65 | 6.62 ± 0.05 |
Exoglycosidase Digestion for Sequential Confirmation
GU matching provides a candidate assignment. Exoglycosidase arrays offer confirmatory evidence by sequentially removing specific monosaccharides, producing predictable GU shifts.
Protocol 2.1: Sequential Exoglycosidase Digestion
- Sample Preparation: Isolate and 2-AB label IgG N-glycans from plasma per established protocols. Purify using solid-phase extraction (e.g., HILIC µElution plates).
- Enzyme Selection: Design a digestion sequence based on the putative structure. Common enzymes include:
- Arthrobacter ureafaciens sialidase (ABS): removes α2-3,6,8,9 linked Neu5Ac.
- Streptococcus pneumoniae sialidase (NAN1): removes α2-3 linked Neu5Ac.
- Bovine kidney α-fucosidase (BKF): removes core α1,6 fucose.
- Xanthomonas manihotis β1-4 galactosidase (BTG): removes β1-4 linked Gal.
- Jack Bean β-N-acetylhexosaminidase (JBH): removes β1-2,4,6 linked GlcNAc.
- Digestion Reaction: For each step, combine ~5-10 µL of purified glycan sample with 1-2 µL of appropriate reaction buffer and 1 µL of enzyme. Incubate at 37°C for 12-18 hours.
- Enzyme Inactivation: Heat the reaction at 75°C for 10 minutes.
- Clean-up and Analysis: Purify the digest using HILIC µElution plates. Analyze by HILIC-UPLC and calculate new GU values.
- Interpretation: Match observed GU shifts with expected shifts from the enzymatic cleavage.
Table 2: Expected GU Shift upon Exoglycosidase Digestion
| Enzyme | Specificity | GU Shift per Cleaved Residue (Approx.) |
|---|---|---|
| ABS (Sialidase) | α2-3,6,8,9 Neu5Ac | -0.8 to -1.2 |
| BTG (β1-4 Galactosidase) | β1-4 Gal | -0.6 to -0.8 |
| JBH (β-Hexosaminidase) | β1-2,4,6 GlcNAc | -0.3 to -0.5 |
| BKF (α1-6 Fucosidase) | Core α1,6 Fuc | -0.2 to -0.3 |
Integrated Workflow for Peak Identification
Diagram Title: Integrated Workflow for Glycan Peak ID
The Scientist's Toolkit: Essential Research Reagents
| Item | Function in Protocol |
|---|---|
| Dextran Ladder Hydrolysate | Provides glucose oligomer standards (DP1-DP25) for GU value calibration. |
| 2-Aminobenzamide (2-AB) | Fluorescent label for glycan detection in HILIC-UPLC with high sensitivity. |
| Exoglycosidase Kit (ABS, BTG, JBH, BKF) | Enzyme array for sequential, linkage-specific trimming of glycan structures. |
| BEH Glycan HILIC Column (1.7 µm) | UPLC column providing high-resolution separation of isomeric glycans. |
| HILIC µElution Plate | For rapid purification and desalting of labeled glycans prior to UPLC analysis. |
| Ammonium Formate, pH 4.4 | Volatile buffer component for HILIC mobile phase, compatible with MS detection. |
The quantification of IgG N-glycans from plasma using HILIC-UPLC is a cornerstone of glycosylation biomarker research. However, the analysis is confounded by the inherent complexity of the plasma matrix, which introduces severe ion suppression and isobaric interferences during LC-MS analysis. This application note, situated within a broader thesis on the standardization of HILIC-UPLC protocols for plasma-derived IgG N-glycans, details targeted strategies to overcome these analytical challenges, thereby ensuring robust, reproducible, and accurate quantitation.
The primary obstacles stem from the co-extraction and co-elution of non-target plasma components.
| Interference Type | Source in Plasma | Impact on HILIC-UPLC-MS of N-Glycans |
|---|---|---|
| Ion Suppression (ES+/-) | Phospholipids, salts, peptides, urea, triglycerides. | Reduces ionization efficiency of glycans, causing signal loss, poor reproducibility, and inaccurate quantitation. |
| Isobaric/Iso-optical Interferences | Endogenous compounds with similar m/z or retention time. | Co-elution leads to mis-identification and inaccurate peak integration (e.g., interfering with low-abundance glycan isomers). |
| Matrix-Induced Signal Enhancement | Less common, but possible from residual matrix components. | Can falsely elevate signal, leading to overestimation. |
| Column Fouling | Proteins, lipids. | Degrades chromatographic performance (peak broadening, retention time shifts), reducing column lifetime. |
Experimental Protocols for Mitigation
Protocol 3.1: Optimized Plasma IgG Capture & Glycan Release
This protocol minimizes matrix carryover prior to HILIC analysis.
- IgG Capture: Dilute 10 µL of human plasma with 190 µL of binding buffer (PBS, pH 7.4). Load onto a Protein G affinity spin plate (e.g., Pierce). Centrifuge at 100 x g for 1 minute.
- Wash: Apply 200 µL of binding buffer. Centrifuge. Repeat twice.
- Elution: Apply 100 µL of elution buffer (0.1 M formic acid). Neutralize immediately with 15 µL of 1 M ammonium bicarbonate.
- Denaturation & Reduction: Add 10 µL of 1% (w/v) SDS to the eluate. Heat at 65°C for 10 min. Add 12.5 µL of 4% (v/v) Igepal CA-630 and 5 µL of 200 mM DTT. Incubate at 60°C for 30 min.
- PNGase F Digestion: Add 2.5 µL of PNGase F (≥500 U) in 50 µL of PBS. Incubate at 37°C overnight.
- Glycan Cleanup: Use porous graphitized carbon (PGC) solid-phase extraction (SPE) or hydrophilic interaction (HLB) SPE. Condition cartridge with 1 mL acetonitrile (ACN) and 1 mL H₂O. Load sample. Wash with 1 mL H₂O. Elute glycans with 40% ACN/0.1% TFA (for HLB) or 40% ACN/0.1% TFA followed by 40% ACN/0.1% TFA with 0.5% ammonia (for PGC). Dry under vacuum.
Protocol 3.2: HILIC-UPLC Method with Post-Column Infusion for Suppression Mapping
This protocol identifies regions of ion suppression within the chromatographic run.
- Glycan Labeling: Reconstitute cleaned glycans in 10 µL of 0.2 M 2-AB in 30% acetic acid/DMSO containing 1.0 M sodium cyanoborohydride. Incubate at 65°C for 3 hours.
- Excess Dye Removal: Use C18 SPE cartridges. Condition with 1 mL ACN, 1 mL H₂O. Load sample. Wash with 10-15 column volumes of H₂O. Elute glycans with 500 µL of 30% ACN.
- UPLC Setup: Acquire a HILIC BEH Amide column (2.1 x 150 mm, 1.7 µm). Mobile Phase A: 50 mM ammonium formate, pH 4.5. Mobile Phase B: ACN.
- Post-Column Infusion: Prepare a constant infusion of a standard glycan (e.g., A2G2) via a T-connector between the column outlet and the MS source.
- Run Method:
- Gradient: 75% B to 62% B over 30 min, at 0.4 mL/min, 60°C.
- Injection: Inject 5 µL of a processed plasma sample (blank matrix) and a neat solvent blank while the standard is continuously infused.
- Data Analysis: Monitor the signal of the infused standard. Signal dips during the sample run (vs. the solvent run) indicate regions of ion suppression.
Protocol 3.3: Use of Stable Isotope-Labeled Internal Standards (SIL-IS)
This protocol corrects for variability in ionization efficiency.
- Selection: Use a ( ^{13}C6 )-2-AB labeled glycan as an internal standard for each major glycan structure (e.g., ( ^{13}C6 )-FA2).
- Spiking: Add a known, constant amount of the SIL-IS mixture to the plasma sample prior to IgG capture (Protocol 3.1, Step 1) or immediately after glycan release (Protocol 3.1, Step 6).
- Analysis & Quantification: Process samples as usual. The SIL-IS will experience identical matrix effects as the native glycan. Quantify using the response ratio (native peak area / SIL-IS peak area).
Visualized Workflows & Pathways
Title: Workflow for Plasma IgG N-Glycan LC-MS with Interference Mitigation
Title: Mechanism and Solution Pathway for Ion Suppression
The Scientist's Toolkit: Research Reagent Solutions
| Item | Function / Role in Overcoming Interferences |
|---|---|
| Protein G Affinity Resin/Plate | High-specificity capture of IgG from plasma, removing >95% of non-IgG proteins and associated impurities. |
| PNGase F (Rapid) | Efficient, high-activity enzyme for complete release of N-glycans, minimizing residual protein carryover. |
| Porous Graphitized Carbon (PGC) SPE | Selective cleanup of glycans, effectively removing salts, residual detergents (SDS/Igepal), and phospholipids. |
| 2-Aminobenzoic Acid (2-AB) & ( ^{13}C_6 )-2-AB | Fluorescent labeling for UPLC detection. The stable isotope-labeled version (( ^{13}C_6 )) serves as a SIL-IS to correct for ion suppression. |
| HILIC BEH Amide UPLC Column | Provides high-resolution separation of isobaric glycan isomers, resolving them from potential interferences. |
| Ammonium Formate, MS Grade | Provides volatile buffer system for HILIC mobile phase, compatible with MS and reduces source contamination. |
| Post-Column Infusion T-piece | Enables real-time mapping of ion suppression zones within the chromatographic method. |
| Phospholipid Removal Plate (e.g., HybridSPE) | Optional pre-cleaning step for hyperlipidemic plasma samples to deplete major suppressors prior to IgG capture. |
Validating Your Method: Benchmarks, Comparison to LC-MS, CE, and MALDI-TOF
Within the broader thesis on developing a robust HILIC-UPLC protocol for the analysis of IgG N-glycans from human plasma, method validation is critical. This protocol is intended for biomarker discovery and monitoring biotherapeutic glycosylation. The validation parameters of Precision, Linearity, Limit of Detection (LOD), Limit of Quantification (LOQ), and Robustness establish the method's reliability, sensitivity, and suitability for high-throughput research and development applications in biopharma.
Application Notes & Detailed Protocols
Precision
Application Note: Precision, encompassing repeatability (intra-day) and intermediate precision (inter-day, inter-analyst), assesses the random error of the HILIC-UPLC method. For IgG N-glycan profiling, this is measured for retention times and relative peak areas (% of total area) of major glycans (e.g., FA2, FA2G1, FA2G2).
Protocol: Intra-day & Inter-day Precision Study
- Sample Preparation: Isolate IgG from a pooled human plasma sample using protein G spin columns. Denature, reduce, and enzymatically release N-glycans with PNGase F. Label glycans with 2-AB fluorophore and purify via solid-phase extraction.
- Preparation of Test Solution: Prepare a single, large master batch of 2-AB labeled N-glycans. Aliquot into 12 identical vials.
- HILIC-UPLC Analysis:
- Instrument: UPLC system with FLD detector and BEH Glycan or similar HILIC column (2.1 x 150 mm, 1.7 µm).
- Mobile Phase: A = 50 mM ammonium formate, pH 4.4; B = Acetonitrile.
- Gradient: 70-53% B over 25 min.
- Temperature: 60°C.
- Detection: λex/λem = 330/420 nm.
- Intra-day Repeatability: Inject one prepared aliquot 6 times sequentially in one day.
- Inter-day Intermediate Precision: Inject one prepared aliquot once per day for 6 consecutive days by two different analysts.
- Data Analysis: For 5-7 major glycan peaks, calculate the % relative standard deviation (%RSD) of retention times and normalized peak areas.
Table 1: Example Precision Data for Key IgG N-glycans
| Glycan Structure | Mean Relative Area (%) | Intra-day RSD (%) (n=6) | Inter-day RSD (%) (n=6 x 2) |
|---|---|---|---|
| FA2 | 21.5 | 1.2 | 2.8 |
| FA2G1 | 35.2 | 0.9 | 2.1 |
| FA2G2 | 28.7 | 1.0 | 2.5 |
| FA2G2S1 | 7.1 | 1.8 | 3.5 |
| Retention Time (FA2) | 8.45 min | 0.15% | 0.30% |
Acceptance Criteria: Area RSD < 5% for major peaks (>5% abundance); Retention Time RSD < 2%.
Linearity & Range
Application Note: Linearity evaluates the method's ability to produce results proportional to the amount of analyte. For relative quantitation of glycans, linearity is tested for the detector response across a range of injected glycan amounts.
Protocol: Linearity of Detector Response
- Sample Preparation: Prepare a high-concentration stock of 2-AB labeled IgG N-glycans from plasma.
- Dilution Series: Create a serial dilution to yield 6-8 concentration levels, spanning from 0.1 to 10.0 pmol of total glycans per injection (based on original protein amount).
- HILIC-UPLC Analysis: Inject each dilution in triplicate using the standard method (Section 2.1).
- Data Analysis: Plot the peak area (or summed area of major peaks) against the injected amount (pmol). Perform linear regression analysis. Report slope, y-intercept, correlation coefficient (r), and coefficient of determination (R²).
Table 2: Linearity Data for Total IgG N-glycan Peak Area
| Injected Amount (pmol) | Mean Peak Area (AU) | Standard Deviation |
|---|---|---|
| 0.10 | 1250 | 85 |
| 0.50 | 7450 | 320 |
| 1.00 | 15800 | 450 |
| 2.50 | 38500 | 1100 |
| 5.00 | 75500 | 1800 |
| 7.50 | 112500 | 2500 |
| 10.00 | 149000 | 3100 |
Regression Results: y = 14920x + 205, R² = 0.9993, Range: 0.1-10 pmol.
LOD & LOQ
Application Note: LOD and LOQ define the lowest amount of a specific glycan that can be detected or quantified with acceptable precision. Critical for identifying low-abundance, biologically relevant glycoforms.
Protocol: Determination of LOD and LOQ
- Sample: Use a dilution series of the 2-AB labeled glycan stock, extending below the expected linear range (e.g., 0.01 to 0.5 pmol/injection).
- Analysis: Inject each low-concentration level 6-10 times.
- Calculation (Signal-to-Noise Method):
- Inject a blank (labeling reagent only).
- For a specific, well-resolved minor glycan peak (e.g., FA1G1S1), measure the peak-to-peak noise (N) in a chromatographic region near the analyte.
- LOD: The concentration yielding a signal-to-noise (S/N) ratio of ≥ 3:1.
- LOQ: The concentration yielding a S/N ratio of ≥ 10:1 and an area RSD of ≤ 20%.
- Alternative Calculation: Use the standard deviation of the response (σ) and the slope (S) from the linearity curve: LOD = 3.3σ/S, LOQ = 10σ/S.
Table 3: LOD/LOQ for Selected IgG N-glycans
| Glycan Structure | Approx. Relative Abundance | LOD (fmol injected) | LOQ (fmol injected) |
|---|---|---|---|
| FA2G2S2 (Minor) | 1.5% | 25 | 80 |
| M5 (Trace) | 0.3% | 12 | 40 |
| FA1G1S1 (Trace) | 0.8% | 18 | 60 |
Robustness
Application Note: Robustness tests the method's resilience to small, deliberate variations in operational parameters. For HILIC, factors like mobile phase pH, column temperature, and gradient slope are critical.
Protocol: Robustness by Experimental Design
- Define Critical Parameters & Ranges:
- Mobile Phase A pH: ± 0.2 units (e.g., 4.3, 4.5)
- Column Temperature: ± 2°C (e.g., 58°C, 62°C)
- Gradient End Point: ± 2% B (e.g., 51%, 55% B)
- Flow Rate: ± 0.05 mL/min
- Design of Experiment (DoE): Use a fractional factorial design (e.g., Plackett-Burman) to efficiently test all parameters.
- Execution: Prepare a single glycan sample. Run the HILIC-UPLC method under each of the 8-12 conditions defined by the DoE.
- Evaluation Metrics: For each run, record (a) Resolution between critical peak pairs (e.g., FA2G2/FA2G2S1), (b) Retention time of a key peak (FA2), and (c) Relative area of FA2G1.
- Analysis: Use statistical analysis (e.g., ANOVA) to identify parameters with a significant effect on the results.
Table 4: Robustness Test Results - Effect on Key Metrics
| Varied Parameter | Condition | Resolution (FA2G2/FA2G2S1) | RT Shift (FA2) |
|---|---|---|---|
| Baseline | pH 4.4, 60°C, 53% B | 2.5 | 8.45 min |
| pH (-0.2) | pH 4.2 | 2.1 | +0.12 min |
| Temp. (+2°C) | 62°C | 2.4 | -0.08 min |
| Gradient (+2% B) | 55% B Final | 1.9 | -0.35 min |
Conclusion: The method is robust to small changes in temperature. A control limit of ±0.3 pH units and ±1.5% B in the gradient is recommended to maintain resolution.
Visualizations
HILIC-UPLC IgG N-glycan Analysis Workflow
Method Validation Parameter Relationships
The Scientist's Toolkit: Research Reagent Solutions
Table 5: Essential Materials for IgG N-Glycan HILIC-UPLC Analysis
| Item | Function in Protocol | Example/Note |
|---|---|---|
| Protein G Spin Columns | Selective isolation of IgG from complex plasma/serum. | Ensures clean glycan profile free from other glycoproteins. |
| PNGase F (RHD) | High-purity recombinant enzyme for efficient release of N-glycans from IgG. | Essential for complete, unbiased release. |
| 2-Aminobenzamide (2-AB) | Fluorescent label for glycan detection in UPLC-FLR. | Standard label for HILIC; offers good sensitivity. |
| LudgerTag 2-AB Labeling Kit | Optimized reagents for efficient, reproducible labeling and cleanup. | Includes labeling dye, reductant, and purification cartridges. |
| HILIC SPE Microplate | 96-well format plate for post-labeling cleanup of 2-AB glycans. | Enables high-throughput sample preparation. |
| Waters ACQUITY UPLC BEH Glycan Column | 1.7µm particle HILIC column for high-resolution glycan separation. | Industry standard for glycan profiling. |
| Glycan Reference Standard (e.g., A2G2) | Labeled standard for system suitability and retention time alignment. | Critical for inter-laboratory comparison. |
| Ammonium Formate, LC-MS Grade | Buffer salt for mobile phase A in HILIC. | Volatile salt compatible with potential downstream MS. |
| Acetonitrile, LC-MS Grade | Organic mobile phase B in HILIC. | Low UV absorbance and particle count is critical. |
This Application Note details protocols and performance benchmarks for the analysis of plasma-derived immunoglobulin G (IgG) N-glycans using Hydrophilic Interaction Liquid Chromatography coupled with Ultra-Performance Liquid Chromatography (HILIC-UPLC). It serves as a critical resource for the validation and comparison of glycan profiling data in biopharmaceutical and clinical research.
Key Research Reagent Solutions
The following table lists essential reagents and materials required for reproducible HILIC-UPLC IgG N-glycan analysis.
| Item | Function |
|---|---|
| Rapid PNGase F | Enzyme for efficient release of N-glycans from IgG under non-denaturing conditions. |
| 2-AB Fluorophore Labeling Reagent | Labels released glycans for sensitive fluorescence detection (ex 330 nm, em 420 nm). |
| Acetonitrile (HILIC-grade) | High-purity solvent for mobile phase preparation and sample reconstitution. |
| BEH Amide HILIC Column (1.7 µm, 2.1 x 150 mm) | Stationary phase providing high-resolution separation of labeled glycans. |
| Glycan Hydrolysis Standard (e.g., Dextran Ladder) | Calibrant for assigning Glucose Unit (GU) values to sample peaks. |
| Ammonium Formate (pH 4.4) | Volatile buffer salt for creating the aqueous mobile phase, essential for HILIC retention. |
Typical GU Values and Relative Abundance of Major Plasma IgG N-Glycans
The table below summarizes consensus GU values and typical relative percentage areas for the predominant neutral N-glycan structures found in normal human plasma IgG, based on HILIC-UPLC with 2-AB labeling.
| Peak | Proposed Structure | Typical GU Value (± 0.1 GU) | Typical Relative % Area (Range) |
|---|---|---|---|
| G0 | FA2 | 5.71 | ~15-25% |
| G0F | FA2[6]G1 | 6.00 | ~5-15% |
| G1[6] | FA2G1[6] | 6.58 | ~5-10% |
| G1[3] | FA2G1[3] | 6.73 | ~5-10% |
| G2 | FA2G2 | 7.24 | <2% |
| G2F | FA2G2[6]G1 | 7.51 | ~10-20% |
| G2FS1 | FA2G2S1 | 7.90 | ~10-20% |
| G2FS2 | A2G2S2 | 8.94 | ~10-20% |
Note: GU values are instrument and method dependent; internal dextran ladder calibration is essential. Abbreviations: F, fucose; G, galactose; S, sialic acid; A, arm (antenna).
Detailed Experimental Protocol: HILIC-UPLC Analysis of IgG N-Glycans from Plasma
IgG Isolation from Plasma/Serum
- Method: Affinity chromatography using Protein A or Protein G resin.
- Protocol:
- Equilibrate 0.5 mL Protein G resin with 10 mL phosphate-buffered saline (PBS), pH 7.4.
- Load 100-200 µL of plasma/serum, pre-diluted 1:1 with PBS.
- Wash with 10 column volumes of PBS to remove unbound proteins.
- Elute IgG with 5 column volumes of 0.1 M glycine-HCl, pH 2.7, into collection tubes containing 1/10th volume of 1 M Tris-HCl, pH 9.0, for immediate neutralization.
- Buffer exchange into 50 mM ammonium bicarbonate (pH 8.0) using centrifugal filters (10 kDa MWCO) and quantify IgG (A280).
N-Glycan Release, Labeling, and Cleanup
- Glycan Release:
- Denature 50 µg of purified IgG in 20 µL of 1% SDS at 65°C for 10 min.
- Cool, add 10 µL of 4% Igepal CA-630 and 5 µL of Rapid PNGase F (500,000 U/mL).
- Incubate at 50°C for 10 minutes.
- 2-AB Fluorescent Labeling:
- Add 25 µL of labeling master mix (2-AB: 19 mg/mL in DMSO:Acetic Acid, 70:30 v/v, with 30 mg/mL sodium cyanoborohydride).
- Incubate at 65°C for 2 hours.
- Cleanup:
- Purify labeled glycans using hydrophilic solid-phase extraction (SPE) on 1 mL 96-well plates packed with porous graphitized carbon (PGC) or cotton wool.
- Condition with 1 mL water and 1 mL 80% acetonitrile (ACN)/0.1% TFA.
- Load sample in 80% ACN/0.1% TFA.
- Wash with 1 mL 80% ACN/0.1% TFA.
- Elute glycans with 1 mL 40% ACN/0.1% TFA, followed by 1 mL 20% ACN/0.1% TFA. Combine eluates and dry in a vacuum concentrator.
HILIC-UPLC Analysis and GU Value Assignment
- Instrument Setup: UPLC system with FLD (ex 330 nm, em 420 nm).
- Column: BEH Glycan or Amide column (1.7 µm, 2.1 x 150 mm).
- Mobile Phase: A) 50 mM Ammonium formate, pH 4.4. B) Acetonitrile.
- Gradient: 75-62% B over 25 min at 0.56 mL/min, 45°C.
- Sample Preparation: Reconstitute dried glycans in 100 µL of 80% ACN. Co-inject 5-10 µL with a 2-AB-labeled dextran ladder hydrolysate standard.
- Data Processing:
- Integrate all peaks.
- Create a calibration curve by plotting the log(Glucose Unit) of ladder peaks against their retention times.
- Interpolate the retention times of sample peaks on this curve to assign experimental GU values.
- Compare experimental GUs to reference databases (e.g., GlycoStore) for preliminary structural assignment.
Visualizations
Diagram 1: HILIC-UPLC IgG Glycan Analysis Workflow
Diagram 2: Key Plasma IgG N-Glycan Biosynthetic Pathway
This application note provides a comparative analysis of Hydrophilic Interaction Liquid Chromatography (HILIC) and Reversed-Phase (RP) Ultra-Performance Liquid Chromatography (UPLC), with a specific focus on their application in the N-glycan profiling of plasma-derived IgG. This work is presented within the context of a thesis investigating HILIC-UPLC protocols for IgG N-glycan analysis, a critical quality attribute for biopharmaceuticals. Selection of the appropriate LC mode is paramount for achieving optimal resolution, sensitivity, and structural insight for polar and non-polar analytes.
Fundamental Principles and Comparison
HILIC-UPLC separates analytes based on their hydrophilicity. It employs a polar stationary phase (e.g., bare silica or amide) and a mobile phase consisting of a high-organic solvent (typically acetonitrile, 70-95%) with a small percentage of aqueous buffer. Analytes partition between the organic-rich mobile phase and a water-enriched layer on the stationary phase. It is the method of choice for highly polar, hydrophilic compounds that are poorly retained in RP, such as glycans, organic acids, and nucleotides.
RP-UPLC separates analytes based on hydrophobicity. It uses a non-polar stationary phase (e.g., C18, C8) and a polar mobile phase (water with an organic modifier like acetonitrile or methanol). Retention increases with analyte hydrophobicity. RP is the dominant mode for most small molecules, peptides, and proteins.
The quantitative and operational differences are summarized below:
Table 1: Core Comparison of HILIC and RP-UPLC Modes
| Parameter | HILIC-UPLC | RP-UPLC |
|---|---|---|
| Separation Mechanism | Partitioning & polar interactions | Hydrophobic interaction |
| Stationary Phase | Polar (e.g., bare silica, amide, cyano, diol) | Non-polar (e.g., C18, C8, phenyl) |
| Typical Mobile Phase | High organic (>70% ACN) with aqueous buffer (5-30%) | High aqueous (>70% water) with organic modifier |
| Elution Order | Polar analytes retained most; eluted by increasing aqueous buffer | Hydrophobic analytes retained most; eluted by increasing organic modifier |
| Ideal Analytes | Polar, hydrophilic compounds (glycans, sugars, organic acids) | Mid-to-non-polar compounds, peptides, proteins |
| MS Compatibility | Excellent (high organic enhances desolvation & sensitivity) | Good; may require additives for ionization |
| Solvent Strength | Water (stronger) | Organic solvent (stronger) |
| Equilibration Time | Longer (requires re-formation of water layer) | Relatively shorter |
Application-Specific Protocol: IgG N-Glycan Analysis from Plasma via HILIC-UPLC
The following detailed protocol is adapted from the core research thesis.
Materials & Research Reagent Solutions
Table 2: Scientist's Toolkit for IgG N-Glycan Sample Preparation & HILIC-UPLC Analysis
| Item / Reagent | Function / Explanation |
|---|---|
| Protein G Spin Plate | For specific capture of IgG from complex plasma/serum matrices. |
| PNGase F (Glycoamidase) | Enzyme that cleaves N-linked glycans from the IgG Fc region, releasing intact oligosaccharides. |
| 2-AB Fluorophore (2-Aminobenzamide) | Labels released glycans via reductive amination for sensitive fluorescence detection. |
| Acetonitrile (HPLC Grade) | Primary organic mobile phase for HILIC; also used in sample reconstitution. |
| Ammonium Formate (e.g., 50-200mM, pH 4.5) | Aqueous buffer component for HILIC; volatile and MS-compatible. |
| HILIC Column (e.g., BEH Amide, 1.7µm, 2.1x150mm) | Polar stationary phase for high-resolution separation of labeled glycans. |
| UPLC System with FLR and/or MS | Instrumentation for high-pressure separation and sensitive detection (Fluorescence and/or Mass Spectrometry). |
| Glycan Hydrophobicity Index (GHI) Standards | A set of 2-AB labeled dextran oligomers for system performance check and potential normalization. |
Experimental Workflow Protocol
Step 1: IgG Isolation from Plasma
- Apply 10-20 µL of human plasma to a pre-equilibrated Protein G spin column/plate.
- Wash with 3x column volumes of PBS to remove unbound proteins.
- Elute IgG using 0.1M glycine-HCl (pH 2.7) into a neutralization buffer (1M Tris-HCl, pH 8.5).
- Quantify IgG using a spectrophotometer (A280).
Step 2: N-Glycan Release and Labeling
- Denature 50 µg of purified IgG in 20 µL of 1x PBS with 0.1% (w/v) SDS at 65°C for 10 min.
- Cool, add 4 µL of 10% (v/v) Igepal CA-630 to neutralize SDS.
- Add 2 µL (2000 units) of PNGase F. Incubate at 37°C for 18 hours.
- Label released glycans with 2-AB via reductive amination: Mix glycan solution with 25 µL of 2-AB labeling solution (prepared per manufacturer's instructions) and 25 µL of sodium cyanoborohydride solution.
- Incubate at 65°C for 2 hours.
- Purify labeled glycans using hydrophilic solid-phase extraction (e.g., with cellulose microporous membranes) to remove excess dye. Elute with water and dry in a vacuum concentrator.
Step 3: HILIC-UPLC Analysis
- Column: BEH Glycan or Amide, 1.7 µm, 2.1 x 150 mm.
- Mobile Phase: A = 50 mM ammonium formate, pH 4.5 (adjusted with formic acid); B = Acetonitrile.
- Gradient: 75% B to 50% B over 25 min at 0.4 mL/min, 45°C.
- Detection: Fluorescence (λex=330 nm, λem=420 nm). Tandem MS can be used for structural identification.
- Injection: Reconstitute sample in 80% acetonitrile; inject 5-10 µL.
- Data Analysis: Identify peaks using external glucose unit (GU) ladder based on 2-AB labeled dextran hydrolysate. Use dedicated software (e.g., UNIFI, Chromeleon) for integration and relative quantification (% area).
Workflow for IgG N-Glycan HILIC Analysis
Decision Logic for LC Mode Selection
Comparative Data: IgG N-Glycan Profiling
Table 3: Performance Comparison for 2-AB Labeled IgG N-Glycans
| Performance Metric | HILIC-UPLC (BEH Amide) | RP-UPLC (C18) |
|---|---|---|
| Number of Peaks Resolved | 25-30 (Baseline resolution of isomers) | <10 (Poor resolution, co-elution) |
| Retention Range (min) | 5 - 25 (Excellent distribution) | 1 - 5 (Weak retention, front of gradient) |
| Peak Shape (Asymmetry) | 0.9 - 1.2 (Symmetrical) | >1.5 (Tailing due to silanol interactions) |
| MS Signal Intensity | High (Enhanced by organic mobile phase) | Moderate (Suppressed by aqueous start) |
| Structural Isomer Separation | Excellent (e.g., resolves α2-3 vs. α2-6 sialylation) | Poor |
For the analysis of polar, hydrophilic compounds such as released N-glycans, HILIC-UPLC is unequivocally the superior chromatographic mode, offering exceptional resolution, excellent MS compatibility, and appropriate retention. RP-UPLC remains the workhorse for the vast majority of pharmaceutical compounds but fails to adequately retain and separate underivatized glycans. The selection protocol must begin with a fundamental assessment of analyte polarity to guide the researcher towards the correct analytical path. The provided HILIC-UPLC protocol offers a robust, detailed method for high-resolution plasma IgG glycan profiling in biotherapeutic development.
Comparison to Capillary Electrophoresis with Laser-Induced Fluorescence (CE-LIF)
This document, framed within a broader thesis on developing a robust HILIC-UPLC protocol for IgG N-glycan analysis from human plasma, provides a comparative analysis to the established Capillary Electrophoresis with Laser-Induced Fluorescence (CE-LIF) methodology. As the biopharmaceutical industry demands high-throughput, reproducible, and quantitative glycan profiling for therapeutic antibody characterization and biomarker discovery, understanding the relative merits of these two principal techniques is essential for researchers and drug development professionals.
Comparative Analysis: HILIC-UPLC vs. CE-LIF
Quantitative Performance Comparison
The following table summarizes key performance metrics for both techniques in the context of N-glycan profiling.
Table 1: Comparative Technical Performance of HILIC-UPLC and CE-LIF for N-Glycan Analysis
| Parameter | HILIC-UPLC | CE-LIF |
|---|---|---|
| Analysis Time per Sample | 25-40 minutes | 15-25 minutes |
| Sample Throughput (with automation) | Moderate (20-30 samples/day) | High (40-50 samples/day) |
| Detection Limit (Glycan Amount) | ~50-100 fmol (with fluorescence) | ~1-10 fmol (LIF detection) |
| Resolution (Theoretical Plates) | Very High (>100,000) | Extremely High (>500,000) |
| Quantitative Linearity (R²) | >0.999 | >0.998 |
| Inter-day Precision (%RSD, peak area) | 2-5% | 1-3% |
| Required Sample Amount (IgG) | 0.5-2 µg | 0.1-0.5 µg |
| Direct Identification Support | Compatible with online MS | Requires off-line coupling (CE-MS) |
Application-Specific Comparison
Table 2: Suitability for Specific Research Applications
| Research Requirement | Recommended Technique | Rationale |
|---|---|---|
| High-throughput clinical screening of 1000+ plasma samples | CE-LIF | Superior speed and throughput with capillary arrays. |
| De novo structural characterization of unknown glycans | HILIC-UPLC | Direct coupling to mass spectrometry (UPLC-MS). |
| Analysis of limited sample (e.g., pediatric samples) | CE-LIF | Lower absolute sample requirement due to higher sensitivity. |
| Quantitative profiling of isomeric structures (e.g., sialylation linkages) | Comparable | Both offer high resolution; choice depends on available standards and protocols. |
| Routine QC in bioprocessing of monoclonal antibodies | HILIC-UPLC | Robustness, ease of method transfer, and wider industry adoption in QC labs. |
Detailed Experimental Protocols
Protocol 1: CE-LIF Analysis of IgG N-Glycans from Plasma (Based on Bioassist ABEE Kit)
This protocol outlines the standard derivatization and analysis of released N-glycans using CE-LIF.
Materials & Reagents:
- Purified IgG from plasma (≥ 0.5 µg).
- PNGase F (recombinant, glycerol-free).
- Ammonium bicarbonate buffer (50 mM, pH 7.8).
- Acetonitrile (ACN), glacial acetic acid.
- Derivatization Agent: 1-aminopyrene-3,6,8-trisulfonate (APTS).
- Sodium cyanoborohydride (1M in THF).
- CE-LIF instrument (e.g., Beckman Coulter PA 800 Plus or equivalent) with a solid-state laser (λex=488 nm, λem=520 nm).
- Fused-silica capillary (50 µm i.d., total length 30-50 cm, effective length 20-40 cm).
- CE Separation Buffer: Commercial glucose buffer kit or 50 mM phosphate/50 mM EDTA, pH 2.5.
Procedure:
- Glycan Release: Denature 0.5-2 µg IgG in 10 µL of 1% SDS at 65°C for 10 min. Add 10 µL of 4% NP-40 and 2 µL PNGase F in 50 mM NH₄HCO₃. Incubate at 37°C for 18 hours.
- APTS Derivatization: Dry the released glycans in a vacuum concentrator. Reconstitute in 2 µL of 20 mM APTS in 15% acetic acid. Add 2 µL of 1M NaBH₃CN in THF. Incubate at 55°C for 90 minutes.
- Sample Cleanup: Dilute the reaction mixture with 50 µL of water. Purify using a size-exclusion microcolumn (e.g., Sephadex G-10) or a hydrophilic cleanup plate to remove excess APTS.
- CE-LIF Analysis: Reconstitute in 20-50 µL of deionized water. Inject samples hydrodynamically (0.5 psi for 5-10 s). Perform separation at 25-30 kV using a commercial NCHO separation buffer. Maintain capillary temperature at 25°C. Detect glycan-APTS conjugates via LIF.
- Data Analysis: Identify peaks by comparison with an APTS-labeled glucose ladder (GU values) and internal standards. Quantify based on relative peak area.
Protocol 2: HILIC-UPLC with Fluorescence Detection (FLD) for IgG N-Glycans
This protocol details the complementary HILIC-UPLC method central to the overarching thesis.
Materials & Reagents:
- Purified IgG from plasma (1-5 µg).
- Rapid PNGase F (e.g., New England Biolabs).
- Derivatization Agent: 2-aminobenzamide (2-AB).
- Labelling dye: 2-AB in DMSO/acetic acid (70:30 v/v).
- Reducing agent: Sodium cyanoborohydride (pre-made labeling kit recommended, e.g., LudgerTag).
- HILIC Column: Acquity UPLC BEH Amide, 1.7 µm, 2.1 x 150 mm (Waters) or equivalent.
- UPLC system with FLD (λex=330 nm, λem=420 nm) and optional QDa/ESi-MS.
- Solvents: 50 mM ammonium formate, pH 4.4 (Mobile Phase A); 100% Acetonitrile (Mobile Phase B).
Procedure:
- Glycan Release: Follow Step 1 from Protocol 1, scaling reagents proportionally to the higher IgG amount.
- 2-AB Derivatization: Dry released glycans. Use a commercial 2-AB labeling kit for reproducibility. Typically, incubate glycans with 5 µL labeling dye and 5 µL reducing agent at 65°C for 2-3 hours.
- Sample Cleanup: Remove excess dye using solid-phase extraction (e.g., HILIC µElution plates). Elute labeled glycans in 80% ACN.
- HILIC-UPLC-FLD Analysis: Inject 5-10 µL. Use a gradient: 75% B to 50% B over 25-40 min at 0.4 mL/min, 60°C column temperature. Hold at 50% B for 5 min, then re-equilibrate.
- Data Analysis: Identify peaks using a dextran ladder for Glucose Unit (GU) calibration and external 2-AB-labeled glycan standards. Quantify via relative % peak area.
Visualization of Methodologies
Diagram: N-Glycan Analysis Workflow Comparison
Diagram 1: Workflow Comparison
The Scientist's Toolkit: Essential Research Reagents & Materials
Table 3: Key Research Reagent Solutions for N-Glycan Analysis
| Item | Function | Primary Technique |
|---|---|---|
| PNGase F (Glycerol-free) | Enzyme that cleaves N-linked glycans from glycoproteins. Essential for glycan release. | Both (CE-LIF & HILIC-UPLC) |
| APTS (1-Aminopyrene-3,6,8-Trisulfonate) | Charged, fluorescent dye for glycan derivatization. Enables sensitive LIF detection in CE. | CE-LIF |
| 2-AB (2-Aminobenzamide) | Neutral, fluorescent tag for glycan derivatization. Compatible with HILIC separation and MS. | HILIC-UPLC |
| Sodium Cyanoborohydride | Reducing agent used in the reductive amination reaction during glycan labeling. | Both |
| BEH Amide UPLC Column | Stationary phase for hydrophilic interaction chromatography. Provides high-resolution glycan separation. | HILIC-UPLC |
| Fused-Silica Capillary | Separation channel for capillary electrophoresis. Coating may be required for glycan analysis. | CE-LIF |
| NCHO CE Separation Buffer | Acidic, viscous buffer optimized for high-resolution separation of APTS-labeled glycans. | CE-LIF |
| Ammonium Formate, pH 4.4 | Volatile salt buffer used as Mobile Phase A in HILIC-UPLC, compatible with mass spectrometry. | HILIC-UPLC |
| Acetonitrile (HPLC Grade) | Organic solvent used as the strong eluent (Mobile Phase B) in HILIC separations. | HILIC-UPLC |
| Glucose/ Dextran Ladder | Labeled oligosaccharide standard used to create a retention/migration time index (GU values). | Both |
Application Notes
Within the context of developing a robust HILIC-UPLC protocol for the analysis of IgG N-glycans from plasma, selecting an appropriate mass spectrometry (MS) platform for downstream characterization is critical. This choice hinges on the specific research goals: achieving deep structural elucidation or enabling high-throughput screening. Liquid Chromatography-Tandem Mass Spectrometry (LC-MS/MS) and Matrix-Assisted Laser Desorption/Ionization Time-of-Flight Mass Spectrometry (MALDI-TOF-MS) represent two complementary pillars in glycomics.
LC-MS/MS for Structural Depth: When the research thesis requires detailed structural information—such as identifying specific isomers (e.g., core fucosylation, bisecting GlcNAc, sialylation linkages α2,3 vs. α2,6), confirming structures, or analyzing low-abundance glycans from complex samples—LC-MS/MS is indispensable. The online chromatographic separation (often using HILIC or PGC columns) reduces ion suppression and resolves isomers prior to MS analysis. Collision-induced dissociation (CID) or higher-energy collisional dissociation (HCD) in the MS/MS stage provides fragmentation patterns that reveal monosaccharide sequence and, to a degree, linkage information. This platform is ideal for discovery-phase research or in-depth biomarker validation where structural certainty is paramount, albeit at the cost of longer run times and more complex data analysis.
MALDI-TOF-MS for High-Throughput: For large-scale cohort studies, clinical screening, or rapid profiling where relative quantitation and glycan class determination are sufficient, MALDI-TOF-MS offers superior speed and simplicity. Samples purified and permethylated or labeled (e.g., with 2-AA for HILIC-UPLC) can be spotted onto a target plate and analyzed in seconds per sample. It provides a rapid mass profile, giving a high-level overview of glycan compositions present. However, it typically cannot separate isomers or provide detailed fragmentation spectra without additional steps (e.g., MALDI-TOF/TOF), and it is more susceptible to ion suppression from complex matrices. Its high-throughput nature makes it excellent for population studies where hundreds of plasma IgG samples need to be compared.
Synergistic Use: An optimized workflow may use HILIC-UPLC for high-resolution separation and relative quantitation, followed by fraction collection or direct coupling to LC-MS/MS for in-depth structural analysis of key glycan peaks of interest. MALDI-TOF-MS can serve as a rapid pre-screening tool to identify samples with unusual profiles warranting deeper investigation.
Experimental Protocols
Protocol 1: LC-MS/MS Analysis of HILIC-UPLC-Purified IgG N-Glycans
Objective: To obtain detailed structural information on plasma IgG N-glycans. Materials: Tryptic/Lys-C digested IgG glycopeptides or released, labeled glycans; HILIC or PGC capillary column; Nanoflow LC system coupled to a high-resolution tandem mass spectrometer (e.g., Q-Exactive, timsTOF).
Procedure:
- Sample Preparation: Isolate IgG from plasma using protein G spin plates. Denature, reduce, alkylate, and digest with trypsin/Lys-C to generate glycopeptides. Alternatively: Release N-glycans enzymatically with PNGase F, label with 2-AA, and purify via HILIC solid-phase extraction.
- LC Separation:
- For Glycopeptides: Load sample onto a C18 trap column, then separate on a C18 nano-column (75 µm x 25 cm) with a gradient from 98% A (0.1% FA in H₂O) to 40% B (0.1% FA in ACN) over 60 min.
- For Released Glycans: Load onto a PGC or amide (HILIC) nano-column with a gradient optimized for glycan separation (e.g., from 75% ACN to 50% ACN in ammonium formate buffer).
- MS Analysis:
- Operate the mass spectrometer in positive ion mode for glycopeptides (data-dependent acquisition, DDA) or negative/positive for released glycans.
- Full MS: Resolution = 70,000; Scan range = m/z 600-2000.
- MS/MS: Top 10-15 most intense precursors; Resolution = 17,500; Normalized Collision Energy (NCE) = 25-30 for HCD; Isolation window = 2.0 m/z.
- Data Processing: Use software (e.g., Byonic, GlycoWorkbench, Skyline) to interpret MS/MS spectra. For glycopeptides, identify peptide sequence and glycan composition. For released glycans, assign compositions from accurate mass and confirm via fragmentation patterns.
Protocol 2: High-Throughput MALDI-TOF-MS Profiling of IgG N-Glycans
Objective: Rapid acquisition of glycan mass profiles from many plasma samples. Materials: 2-AA labeled and HILIC-purified N-glycans; MALDI matrix (e.g., 10 mg/mL 2,5-dihydroxybenzoic acid, DHB, in 50% ACN); MALDI target plate; MALDI-TOF/TOF mass spectrometer.
Procedure:
- Sample Preparation: Isolate IgG and release/label glycans as in the HILIC-UPLC protocol. Desalt samples using micro-scale tips.
- Spotting:
- Mix 1 µL of purified glycan sample with 1 µL of DHB matrix solution directly on the MALDI target plate.
- Allow spots to dry completely at room temperature.
- MS Acquisition:
- Calibrate the instrument using a standard peptide/glycan mix.
- Acquire spectra in positive reflection ion mode for neutral glycans (or negative mode for sialylated glycans if using another matrix like THAP).
- Parameter Range: Laser intensity: 25-40%; Pulse rate: 1000 Hz; Mass range: m/z 1000-4000; Spectra per spot: 2000-5000 shots accumulated from random positions.
- Data Processing: Use instrument software to baseline subtract, smooth, and peak pick. Assign putative glycan compositions based on accurate mass ([M+Na]+ or [M-H]-) against a theoretical database (e.g., GlycoMod). Perform relative quantitation by normalizing peak areas to the total area of all glycan peaks.
Data Presentation
Table 1: Comparative Analysis of LC-MS/MS and MALDI-TOF-MS Platforms for IgG N-Glycan Analysis
| Feature | LC-MS/MS (Q-Exactive Series) | MALDI-TOF-MS (ultrafleXtreme) | Relevance to HILIC-UPLC Plasma IgG Research |
|---|---|---|---|
| Throughput | Low to Moderate (~30-60 min/sample) | Very High (~seconds/sample) | MALDI ideal for screening 1000s of clinical samples; LC-MS/MS for in-depth follow-up. |
| Structural Detail | High (MS/MS, isomer separation) | Low (MS-only, isobaric overlap) | LC-MS/MS essential for confirming sialic acid linkages and branching patterns. |
| Quantitation | Relative (High dynamic range) | Relative (Prone to suppression) | HILIC-UPLC provides robust quantitation; MALDI offers rapid semi-quantitative profiles. |
| Sample Prep | Complex (digestion/cleanup) | Simple (spot-and-shoot post-labeling) | Both benefit from the same initial HILIC-based glycan release and labeling protocol. |
| Ion Source | Electrospray Ionization (ESI) | Matrix-Assisted Laser Desorption/Ionization (MALDI) | ESI is coupled online with LC; MALDI enables off-line, flexible batch analysis. |
| Key Output | Glycopeptide/glycan IDs with MS/MS confirmation | Glycan mass profile (fingerprint) | LC-MS/MS validates HILIC peaks; MALDI rapidly validates profile changes across cohorts. |
| Typical CV for IgG Fc Glycopeptide Quantitation | 5-10% (intra-run) | 10-20% (inter-spot) | Highlights LC-MS/MS's superior reproducibility for precise biomarker work. |
Diagrams
Title: HILIC-UPLC to LC-MS/MS IgG Glycan Analysis Workflow
Title: MS Platform Selection Based on Research Goal
The Scientist's Toolkit: Research Reagent Solutions
| Item | Function in IgG N-Glycan Analysis |
|---|---|
| Protein G Magnetic Beads | High-affinity, rapid isolation of IgG from complex plasma/serum matrices. |
| Rapid PNGase F (GlycoQuick) | Efficient enzymatic release of N-glycans from IgG in minutes under denaturing conditions. |
| 2-Aminobenzoic Acid (2-AA) | Fluorescent label for glycans enabling HILIC-UPLC separation and sensitive detection. |
| LudgerTag 2-AA Labeling Kit | Optimized kit for consistent, high-yield glycan labeling and cleanup. |
| Acetonitrile (ULC/MS Grade) | Critical mobile phase for HILIC separation; purity prevents background noise in MS. |
| Ammonium Formate | Volatile buffer salt for HILIC-UPLC mobile phases, compatible with downstream MS. |
| DHB Matrix (MALDI Grade) | Matrix for MALDI-TOF-MS of glycans, promoting soft ionization with low fragmentation. |
| PGC or Amide Nano-Columns | LC columns for separating glycan or glycopeptide isomers prior to ESI-MS/MS. |
| Glycan Standard (DP7/Dextran Ladder) | Essential for calibrating MS instruments and validating HILIC retention times. |
| SPE Microplate (HILIC & C18) | For parallelized sample cleanup and desalting of glycopeptides or labeled glycans. |
Application Notes
The integration of Hydrophilic Interaction Liquid Chromatography coupled with Ultra-Performance Liquid Chromatography (HILIC-UPLC) for profiling IgG N-glycans from plasma has emerged as a cornerstone in biomarker discovery for chronic inflammatory diseases and biotherapeutic development. However, the translational potential of this methodology is contingent upon achieving high inter-laboratory reproducibility. Initiatives led by the Human Proteome Organization (HUPO) and foundational knowledge from the Glycoscience community on the MGAT (Mannosyl (Alpha-1,3-)-Glycoprotein Beta-1,2-N-Acetylglucosaminyltransferase) gene family and its role in N-glycan biosynthesis are central to current standardization efforts. This protocol is framed within a thesis context focused on establishing a robust, standardized HILIC-UPLC workflow for plasma IgG N-glycan analysis to enable multi-center clinical studies.
Recent HUPO Human Glycoproteomics Initiative (HGI) inter-laboratory studies have systematically evaluated key variables. The data from a 2023 study on IgG glycan analysis are summarized below.
Table 1: Inter-laboratory Comparison of Key HILIC-UPLC Performance Metrics for IgG N-Glycan Analysis (HUPO-HGI Study Data)
| Metric | Median Value (All Labs) | Inter-Quartile Range (IQR) | Coefficient of Variation (CV) Range for Major Peaks | Target for Standardization |
|---|---|---|---|---|
| Total Analytical CV | 12.5% | 9.8% - 15.3% | 5% - 18% | < 15% |
| Retention Time CV | 1.2% | 0.8% - 1.9% | N/A | < 2% |
| Relative % Area CV (FA2) | 8.7% | 6.1% - 11.4% | N/A | < 10% |
| Glycan Yield (pmol/µg IgG) | 4.2 pmol/µg | 3.5 - 5.1 pmol/µg | N/A | > 3.5 pmol/µg |
| Number of Peaks Detected (≥ 0.1%) | 24 | 22 - 26 | N/A | Consistent Profile |
Protocol: Standardized HILIC-UPLC Analysis of Plasma-Derived IgG N-Glycans
- Principle: IgG is isolated from human plasma, enzymatically released N-glycans are fluorescently labeled, purified, and separated by HILIC-UPLC based on hydrophilicity. Peaks are quantified as relative percentage areas of the total integrated chromatogram.
Part A: IgG Isolation and Denaturation
- Materials: Protein G Sepharose 4B spin columns, 100 mM phosphate buffer (pH 7.4), 1x PBS (pH 7.4), 100 mM formic acid.
- Apply 10 µL of human plasma diluted in 190 µL PBS to a pre-equilibrated Protein G column.
- Wash with 3 x 500 µL PBS.
- Elute IgG with 2 x 250 µL of 100 mM formic acid. Immediately neutralize each elution fraction with 50 µL of 1M ammonium bicarbonate.
- Pool neutralized eluents, dry using a vacuum concentrator.
- Redissolve IgG in 50 µL of 1x PBS. Determine concentration by Nanodrop (A280, Ext. Coeff. 1.4).
- Denature 20 µg of purified IgG in 20 µL of 1x PBS with 0.1% w/v SDS at 65°C for 10 min. Cool, then add 2.2 µL of 10% v/v Igepal CA-630.
Part B: N-Glycan Release and Labeling
- Materials: Recombinant PNGase F (500 U/mL), 10x GlycoBuffer (500 mM Na2HPO4, pH 7.5), 2-AA Labeling Solution (20 mg/mL 2-Aminobenzoic acid in DMSO + 30 mg/mL NaBH3CN), DMSO.
- Add 2.5 µL 10x GlycoBuffer and 1 µL PNGase F to the denatured IgG. Mix and incubate at 37°C for 18 hours.
- Add 50 µL of cold ethanol to the digest, vortex, and incubate at -20°C for 2 hours to precipitate proteins.
- Centrifuge at 13,000 x g for 10 min. Transfer the supernatant (containing glycans) to a new tube. Dry completely.
- Redissolve dried glycans in 10 µL of 2-AA labeling solution and 10 µL of DMSO. Vortex thoroughly.
- Incubate at 65°C for 2 hours.
Part C: Glycan Cleanup and HILIC-UPLC Analysis
- Materials: 96% and 100% Acetonitrile (ACN), 10 mM ammonium formate (pH 4.4), AcroPrep 96-well filter plates (0.45 µm GHP membrane).
- Cleanup: Pre-wet a GHP filter plate with 200 µL 96% ACN. Apply the labeling mixture. Wash 5x with 200 µL 96% ACN. Elute glycans with 2x 100 µL of 10 mM ammonium formate (pH 4.4). Dry eluate.
- UPLC Setup: Acquity UPLC H-Class system with FLR detector (Ex: 330 nm, Em: 420 nm). Column: Waters BEH Glycan, 1.7 µm, 2.1 x 150 mm. Column Temp: 60°C.
- Mobile Phase: A = 50 mM ammonium formate, pH 4.4; B = 100% ACN.
- Gradient: 0-2 min: 75% B; 2-62 min: 75% → 54% B (linear); 62-64 min: 54% → 0% B; 64-66 min: 0% B; 66-67 min: 0% → 75% B; 67-75 min: 75% B (equilibration).
- Injection: Redissolve cleaned glycans in 100 µL 80% ACN. Inject 20 µL. Flow rate: 0.4 mL/min.
- Data Processing: Use Empower or equivalent. Integrate peaks from 15-65 min. Normalize each peak area to the total integrated area. Assign peaks using a dextran ladder-based Glucose Unit (GU) values and reference to internal standard libraries (e.g., GlycoStore).
Visualization: Workflow and Pathway Diagrams
Title: HILIC-UPLC IgG N-Glycan Analysis Workflow
Title: MGAT Enzyme Roles in N-Glycan Branching
The Scientist's Toolkit: Key Research Reagent Solutions
| Item / Reagent | Function in Protocol | Critical for Standardization |
|---|---|---|
| Recombinant PNGase F | Enzyme that catalyzes the release of intact N-glycans from the IgG glycoprotein backbone. | Use of a high-purity, glycerol-free formulation minimizes artifacts and ensures complete, reproducible release. |
| 2-Aminobenzoic Acid (2-AA) | Fluorescent label for glycans; enables sensitive FLR detection in UPLC. | Consistent labeling efficiency requires controlled reagent purity, reaction time, and temperature across labs. |
| Protein G Sepharose | Affinity medium for highly specific isolation of IgG from complex plasma/serum. | Standardized bead lot, binding/wash/elution buffers, and sample-to-bead ratios are crucial for reproducible IgG recovery. |
| BEH Glycan HILIC Column | Stationary phase for UPLC separation based on glycan hydrophilicity. | The primary column chemistry specified in consortium protocols to ensure identical separation profiles. |
| Ammonium Formate Buffer (pH 4.4) | Mobile phase component for HILIC separation; volatile and MS-compatible. | Precise pH control (±0.05) is critical for reproducible retention times and peak order. |
| Dextran Hydrolysate Ladder | Standard for creating a Glucose Unit (GU) calibration curve for peak assignment. | Essential for aligning chromatograms between different instruments and laboratories. |
| Internal Standard Glycan(s) | A non-human glycan (e.g., from ribonuclease B) spiked into samples pre- or post-labeling. | Monitors and corrects for variability in sample processing, cleanup, and injection. |
Conclusion
Implementing a robust HILIC-UPLC protocol for plasma IgG N-glycan analysis provides a powerful, reproducible platform for discovering glycosylation-based biomarkers. By understanding the foundational biology, meticulously following the optimized methodological steps, proactively troubleshooting issues, and rigorously validating against benchmarks, researchers can generate high-quality data. This approach bridges basic research and clinical application, supporting advances in personalized medicine, biopharmaceutical development, and disease monitoring. Future directions point toward increased automation, integration with mass spectrometry for structural confirmation, and the development of standardized panels for specific disease states, further solidifying IgG glycan profiling as a cornerstone of clinical glycomics.