Mastering Glycan Profiling: A Complete Guide to HILIC-UPLC-FLR Setup, Optimization, and Validation
This comprehensive guide provides researchers and drug development professionals with a detailed framework for implementing and optimizing Hydrophilic Interaction Liquid Chromatography coupled with Ultra-Performance Liquid Chromatography and Fluorescence Detection (HILIC-UPLC-FLR)...
Mastering Glycan Profiling: A Complete Guide to HILIC-UPLC-FLR Setup, Optimization, and Validation
Abstract
This comprehensive guide provides researchers and drug development professionals with a detailed framework for implementing and optimizing Hydrophilic Interaction Liquid Chromatography coupled with Ultra-Performance Liquid Chromatography and Fluorescence Detection (HILIC-UPLC-FLR) for glycan profiling. Covering foundational principles, step-by-step method setup, critical troubleshooting for peak resolution and sensitivity, and robust validation strategies against MS-based techniques, this article serves as an essential resource for achieving reliable, high-throughput glycan analysis in biopharmaceutical characterization and biomarker discovery.
Glycan Profiling Fundamentals: Why HILIC-UPLC-FLR is the Gold Standard for Biopharmaceuticals
The Critical Role of Glycosylation in Biologic Function, Safety, and Efficacy
Glycosylation, the enzymatic attachment of oligosaccharides (glycans) to proteins, is a critical quality attribute (CQA) for biologic drugs, including monoclonal antibodies (mAbs), fusion proteins, and recombinant enzymes. The glycan profile directly influences pharmacokinetics (e.g., serum half-life via sialylation and core fucosylation), pharmacodynamics (e.g., Antibody-Dependent Cellular Cytotoxicity (ADCC) via core fucosylation), immunogenicity, and stability. Consequently, rigorous glycan profiling is mandatory throughout biopharmaceutical development and manufacturing. Hydrophilic Interaction Liquid Chromatography coupled with Ultra-Performance Liquid Chromatography and Fluorescence Detection (HILIC-UPLC-FLR) has emerged as the industry standard for high-resolution, quantitative, and reproducible N-glycan analysis.
Application Note: Impact of Glycosylation on mAb Effector Function
Quantitative Impact of Afucosylation on ADCC
Core fucosylation of the Fc N-glycan at Asn297 modulates ADCC by affecting FcγRIIIa binding. Afucosylated variants demonstrate significantly enhanced ADCC potency.
Table 1: Correlation between Afucosylation Levels and ADCC EC50 Values
| mAb Sample | % Afucosylated Glycans (G0F, G1F, G2F) | ADCC EC50 (ng/mL) | Relative Potency vs. Reference |
|---|---|---|---|
| Reference mAb (High Fucose) | 6% | 45.2 | 1.0x |
| Biosimilar A | 12% | 22.5 | 2.0x |
| Process Variant B | 35% | 8.1 | 5.6x |
| Engineered Afucosylated | 95% | 1.5 | 30.1x |
Data sourced from recent process development and engineering studies.
Impact of Galactosylation on CDC
Complement-Dependent Cytotoxicity (CDC) is influenced by galactose levels on the Fc glycans, which can modulate C1q binding.
Table 2: Galactosylation Index and CDC Activity
| mAb Lot | Galactosylation Index (G1F+G2F)/(G0F+G1F+G2F) | CDC Activity (% of Max Lysis) |
|---|---|---|
| Lot 1 (Low Gal) | 0.15 | 62% |
| Lot 2 (Medium Gal) | 0.45 | 88% |
| Lot 3 (High Gal) | 0.75 | 96% |
Protocols for HILIC-UPLC-FLR Based Glycan Profiling
Protocol: Release and Fluorescent Labeling of N-Glycans from a mAb
Objective: To reproducibly release, label, and purify N-linked glycans from a monoclonal antibody for subsequent HILIC-UPLC-FLR analysis.
Research Reagent Solutions & Materials:
| Item | Function |
|---|---|
| PNGase F (Recombinant) | Enzyme that cleaves N-glycans from the asparagine residue of the protein backbone. |
| RapiFluor-MS Labeling Reagent (RFMS) | A rapid, fluorescent tag that confers high sensitivity for FLR detection and enhances hydrophilicity for HILIC separation. |
| Ethanol (HPLC Grade) | Precipitates protein after glycan release. |
| Dimethyl Sulfoxide (DMSO, anhydrous) | Solvent for RFMS label dissolution and labeling reaction. |
| Acetonitrile (ACN, HPLC Grade) | Primary organic mobile phase for HILIC and used in clean-up steps. |
| HILIC µElution Plate (e.g., Waters) | Solid-phase extraction plate for post-labeling glycan purification. |
| Ammonium Formate, 50mM, pH 4.4 | Aqueous mobile phase buffer for HILIC-UPLC. |
| 2-AB Labeling Kit (Alternative) | Common alternative fluorescent dye (2-aminobenzamide) for labeling. |
Procedure:
- Denaturation & Release: Dilute 100 µg of mAb in 50 µL of Milli-Q water. Add 20 µL of 5% SDS and heat at 60°C for 10 min. Cool, add 10 µL of 10% Igepal CA-630. Add 10 µL of Rapid PNGase F buffer and 2 µL (10 U) of PNGase F. Incubate at 50°C for 10 minutes.
- Protein Precipitation: Add 200 µL of cold ethanol, vortex, and centrifuge at 14,000 x g for 5 min. Transfer the supernatant (containing glycans) to a new tube. Dry completely in a vacuum concentrator (~30 min).
- Fluorescent Labeling: Reconstitute dried glycans in 20 µL of RFMS labeling solution (prepared by dissolving RFMS reagent in anhydrous DMSO per manufacturer's instructions). Add 20 µL of labeling accelerator solution. Vortex, spin down, and incubate at room temperature for 5 minutes.
- Clean-up: Dilute the reaction mixture with 200 µL of ACN. Load onto a pre-conditioned HILIC µElution Plate. Wash with 200 µL of 85% ACN. Elute glycans with 2 x 50 µL of Milli-Q water into a clean vial. Dry and reconstitute in 100 µL of 70% ACN for UPLC injection.
Protocol: HILIC-UPLC-FLR Analysis of Labeled N-Glycans
Objective: To separate and quantify fluorescently labeled N-glycans using a HILIC-UPLC system coupled to a fluorescence detector.
Instrument Parameters:
- System: Acquity UPLC H-Class with FLR Detector.
- Column: Waters Acquity BEH Amide, 1.7 µm, 2.1 x 150 mm.
- Column Temp: 60°C.
- Injection Volume: 10 µL (partial loop mode).
- Mobile Phase A: 50 mM Ammonium Formate, pH 4.4.
- Mobile Phase B: 100% Acetonitrile.
- Flow Rate: 0.4 mL/min.
- Gradient: Initial 75% B (0-2 min), 75% to 62% B (2-47 min), 62% to 40% B (47-50 min), re-equilibrate at 75% B (50-55 min).
- FLR Detection: Excitation: 265 nm, Emission: 425 nm.
Data Analysis: Integrate glycan peaks using chromatography software (e.g., Empower). Identify peaks by comparison with a characterized external standard or a hydrolyzed glucose unit ladder. Report results as percentage area of total integrated glycan peaks.
Application Note: Glycosylation and Immunogenicity Risk Assessment
Aggregates or non-human glycan epitopes (e.g., α-Gal, Neu5Gc) pose immunogenicity risks. HILIC profiling can monitor for process-related glycan changes.
Table 3: Detection of Immunogenic Glycan Epitopes
| Glycan Epitope | Source/Cause | HILIC Retention Window (GU) | Risk Level | Mitigation Strategy |
|---|---|---|---|---|
| α-Gal (Galili antigen) | Non-human mammalian cell lines (e.g., certain murine) | GU ~9.5-10.2 | High | Use human or engineered cell lines (CHO-KO). |
| Neu5Gc | Bovine serum components in culture media | GU varies (sialylated species) | Medium | Use chemically defined, animal component-free media. |
| High Mannose (Man-5 to Man-9) | Specific process conditions, cellular stress | GU ~6.5-8.5 | Variable (impacts clearance) | Optimize bioreactor conditions (pH, feed). |
Diagram Title: Glycan Structures Influence mAb Effector Functions
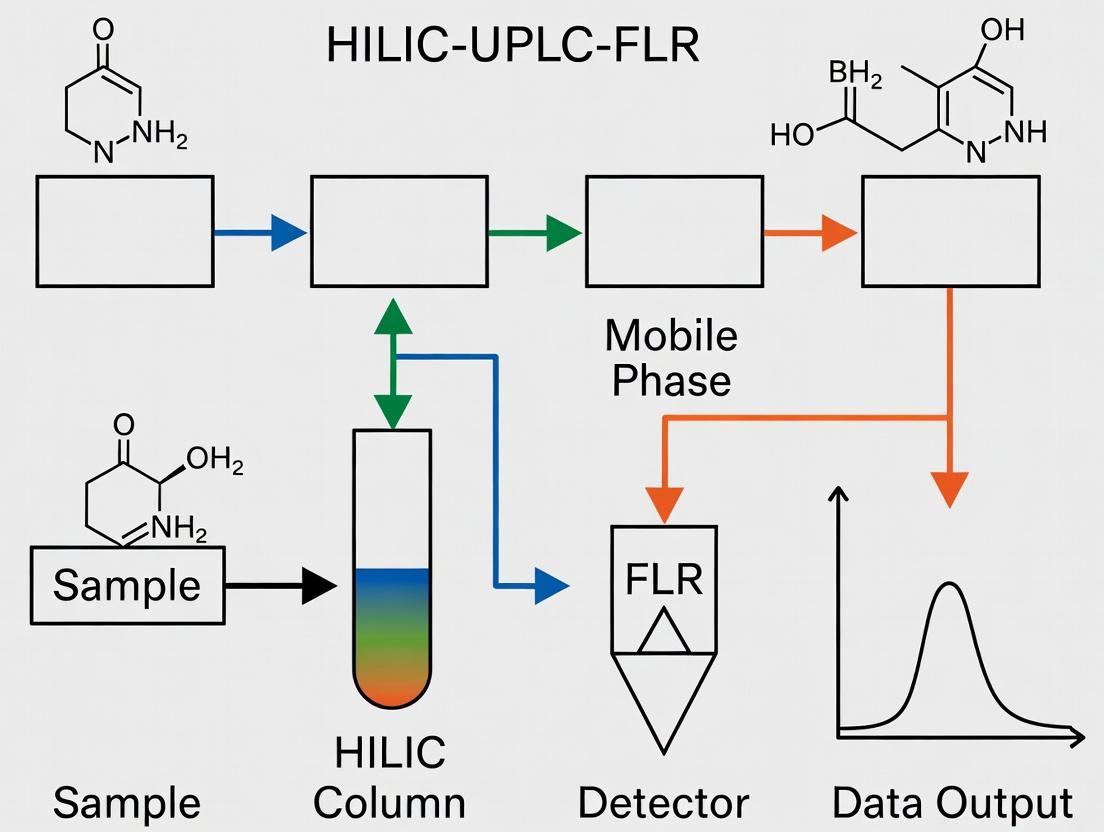
Diagram Title: HILIC-UPLC-FLR N-Glycan Analysis Workflow
Application Notes: HILIC-UPLC-FLR for Glycan Profiling in Biopharmaceutical Development
Within the context of a thesis on HILIC-UPLC-FLR for high-throughput glycan profiling, understanding the separation mechanism is fundamental. Hydrophilic Interaction Liquid Chromatography (HILIC) operates on polar interactions, making it ideal for separating hydrophilic, charged, or highly polar analytes like released glycans. Unlike reversed-phase chromatography, HILIC utilizes a hydrophilic stationary phase (e.g., bare silica or amide-bonded silica) and a hydrophobic mobile phase (typically acetonitrile-rich, e.g., 70-85% ACN). Separation is achieved through a complex, multimodal mechanism:
- Partitioning: The primary driver. A water-rich layer is adsorbed onto the polar stationary phase. Analytes partition between this aqueous layer and the organic mobile phase based on their hydrophilicity. More hydrophilic glycans (e.g., highly sialylated species) have a stronger affinity for the aqueous layer and are retained longer.
- Electrostatic Interactions: Many HILIC phases possess charged groups. At appropriate pH, ionic interactions between charged glycans (e.g., sialic acid or sulfate groups) and the stationary phase contribute significantly to retention and selectivity.
- Hydrogen Bonding: Direct hydrogen bonding between glycan hydroxyl/amine groups and stationary phase ligands (e.g., amide or silanol groups) provides additional selectivity.
This combination of mechanisms allows for the exquisite separation of glycan isomers differing only in linkage or antennary structure, which is critical for monoclonal antibody (mAb) biosimilar development and biomarker discovery.
Protocol: HILIC-UPLC-FLR Analysis of Released N-Glycans from a Therapeutic Monoclonal Antibody
This protocol details the fluorescence (FLR) detection-based profiling of 2-AB labeled N-glycans.
I. Materials & Reagent Preparation
- Glycan Release Buffer: 1.33% SDS, 50 mM NH₄HCO₃, pH 8.0.
- Denaturing Solution: 1.33% SDS.
- Nonidet P-40 Substitute: 4% (v/v) in water.
- PNGase F Solution: 2 U/µL in storage buffer.
- Labeling Reagent: 2-Aminobenzamide (2-AB) in DMSO/Acetic Acid mixture.
- Labeling Quenching Solution: 100% Acetonitrile.
- HILIC UPLC Solvents:
- Solvent A: 50 mM Ammonium formate, pH 4.4.
- Solvent B: 100% Acetonitrile.
- HILIC Column: e.g., Waters ACQUITY UPLC Glycan BEH Amide Column, 130Å, 1.7 µm, 2.1 mm x 150 mm.
- Sample: Purified therapeutic mAb (e.g., 100 µg).
II. Step-by-Step Procedure
Step 1: N-Glycan Release
- To 100 µg of mAb, add 10 µL of denaturing solution. Heat at 65°C for 10 min.
- Cool to room temperature. Add 5 µL of Nonidet P-40 substitute and 5 µL of PNGase F solution.
- Incubate at 37°C for 18 hours.
Step 2: Glycan Labeling with 2-AB
- Prepare the 2-AB labeling reagent as per manufacturer's instructions.
- Add the entire released glycan sample to the labeling reagent tube. Vortex and centrifuge briefly.
- Incubate at 65°C for 2 hours.
Step 3: Clean-up of Labeled Glycans
- Use commercial Glycan Clean-up cartridges or porous graphitized carbon (PGC) tips.
- Condition the cartridge with 1 mL water, then 1 mL 30% acetic acid, and finally 1 mL 96% acetonitrile.
- Dilute the labeling reaction with 1 mL of 96% acetonitrile and load onto the cartridge.
- Wash with 3 x 1 mL of 96% acetonitrile to remove excess label.
- Elute glycans with 2 x 0.5 mL of water. Dry the eluate in a vacuum concentrator.
Step 4: HILIC-UPLC-FLR Analysis
- Reconstitution: Reconstitute dried glycans in 100 µL of 70% acetonitrile. Vortex and centrifuge.
- Instrument Setup:
- System: UPLC with Fluorescence Detector (λex = 330 nm, λem = 420 nm).
- Column: As specified above. Temperature: 60°C.
- Injection Volume: 10 µL.
- Gradient Program:
| Time (min) | Flow Rate (mL/min) | %A (Ammonium Formate) | %B (Acetonitrile) |
|---|---|---|---|
| Initial | 0.4 | 25 | 75 |
| 0.0 | 0.4 | 25 | 75 |
| 46.5 | 0.4 | 46 | 54 |
| 47.0 | 0.4 | 100 | 0 |
| 49.0 | 0.4 | 100 | 0 |
| 49.1 | 0.4 | 25 | 75 |
| 55.0 | 0.4 | 25 | 75 |
- Run the sample. Identify peaks by comparison with an external 2-AB labeled dextran ladder (GU calibration) and known mAb glycan standards.
III. Data Analysis
- Process chromatograms using dedicated software (e.g., Waters Empower).
- Assign glycan structures based on Glucose Unit (GU) values and known standards.
- Report results as relative percentage peak areas of the total integrated fluorescence.
The Scientist's Toolkit: Key Research Reagent Solutions for HILIC Glycan Profiling
| Item | Function in HILIC Glycan Analysis |
|---|---|
| PNGase F | Enzyme that cleaves N-glycans from glycoproteins at the asparagine residue for subsequent analysis. |
| 2-Aminobenzamide (2-AB) | A fluorescent tag that introduces a chromophore for highly sensitive FLR detection and stabilizes sialic acids. |
| Amide-Bonded HILIC UPLC Column | Stationary phase providing robust separation via partitioning, hydrogen bonding, and weak ionic interactions. |
| Ammonium Formate Buffer (pH 4.4) | Volatile mobile phase additive that provides ionic strength for electrostatic interactions and is MS-compatible. |
| Acetonitrile (HPLC Grade) | Primary organic mobile phase component in HILIC, promoting strong partitioning onto the aqueous layer. |
| Dextran Hydrolysate Ladder (2-AB labeled) | Calibration standard for assigning Glucose Unit (GU) values to unknown glycan peaks. |
Table 1: Representative HILIC-UPLC Retention Data for Common mAb N-Glycans
| Glycan Structure (2-AB labeled) | Abbreviation | Typical Glucose Unit (GU) Value | Approximate Retention Time (min)* |
|---|---|---|---|
| G0 (A2) | FA2 | 5.90 | 17.2 |
| G0F (A2G0) | FA2G0 | 6.50 | 20.1 |
| G1 (α1,6) | FA2G1[6] | 6.93 | 22.5 |
| G1 (α1,3) | FA2G1[3] | 7.14 | 23.6 |
| G2 (A2G2) | FA2G2 | 7.65 | 25.8 |
| G2S1 (A2G2S1) | FA2G2S1 | 8.25 | 29.0 |
| Man5 | M5 | 5.54 | 15.9 |
*Times are column and gradient-specific. Values are illustrative from a 55-min method.
HILIC Separation Mechanism for Glycans
HILIC-UPLC-FLR Glycan Profiling Workflow
Within a comprehensive thesis on HILIC-UPLC-FLR for glycan profiling, the selection of Fluorescence (FLR) detection over alternative methods like mass spectrometry (MS) is pivotal. UPLC-FLR offers a robust, quantitative, and accessible platform for routine, high-quality N-glycan analysis, particularly in biopharmaceutical development.
Quantitative Performance Comparison: UPLC-FLR vs. Other Common Glycan Analysis Methods
Table 1: Comparative analysis of glycan profiling techniques.
| Parameter | UPLC-FLR (HILIC) | UPLC-MS/MS | MALDI-TOF-MS | Capillary Electrophoresis (CE)-LIF |
|---|---|---|---|---|
| Primary Readout | Relative Quantification (% abundance) | Structural identification & quantification | Mass profiling & semi-quantitation | Relative Quantification (% abundance) |
| Sensitivity | High (fmol-pmol levels) | Very High (attomole-fmol levels) | Moderate-High | Very High (attomole levels) |
| Throughput | High (~15-20 min/sample) | Moderate (longer run + data analysis) | High | Very High (rapid separation) |
| Quantitative Precision | Excellent (RSD < 2% for retention time, <5% for area) | Good to Excellent | Moderate | Excellent |
| Structural Detail | Separation by hydrophilicity (GU); co-elution possible | Direct mass/ fragmentation data | Direct mass data; linkage isomers not resolved | Separation by charge/size; high resolution |
| Accessibility/Cost | High (common instrumentation) | Lower (specialized, expensive) | Moderate | Moderate-High |
| Sample Prep Complexity | Moderate (labeling required) | High | Low-Moderate | Moderate (labeling required) |
Detailed Experimental Protocols
Protocol 1: Standard Workflow for Released N-Glycan Labeling with 2-AB for UPLC-FLR Analysis
- Glycan Release: Denature 50 µg of glycoprotein in 1% SDS, 50 mM DTT at 60°C for 10 min. Add NP-40 (final 1%) and PNGase F (2.5 mU). Incubate at 37°C for 18 hours.
- Cleanup: Apply the reaction mixture to a pre-wetted hydrophilic PVDF membrane (e.g., Millipore Multiscreen HTS). Wash 5x with water. Elute glycans with 2x 100 µL of water.
- Fluorescent Labeling (2-AB): Dry eluted glycans in a vacuum concentrator. Reconstitute in 5 µL of a labeling mixture containing 0.35 M 2-AB in DMSO:Acetic Acid (7:3 v/v) and 1.0 M NaBH3CN. Incubate at 65°C for 2 hours.
- Excess Dye Removal: Use solid-phase extraction cartridges (e.g., GlycoClean R or normal-phase microplates). Condition with acetonitrile (ACN) and water. Load labeled sample in ≥85% ACN. Wash with acetonitrile to remove unreacted dye. Elute labeled glycans with water.
- Analysis: Dry eluate, reconstitute in 100 µL of 70% ACN. Inject 5-10 µL onto a HILIC-UPLC column (e.g., Waters ACQUITY UPLC BEH Glycan, 1.7 µm, 2.1 x 150 mm).
- Chromatography: Use a gradient of 50 mM ammonium formate, pH 4.4 (Buffer A) and 100% ACN (Buffer B). Typical gradient: 75-62% B over 28 min at 0.4 mL/min, 45°C.
- Detection: FLR detection at λEx = 330 nm, λEm = 420 nm.
Protocol 2: High-Throughput 96-Well Plate Sample Preparation for Glycan Release and Labeling
- Plate Setup: Perform all steps in a 96-well polypropylene microplate compatible with liquid handlers.
- Denaturation/Reduction: Aliquot 10 µg of glycoprotein per well. Add 20 µL of 1% SDS, 50 mM DTT. Seal, mix, incubate at 60°C for 10 min.
- Release: Add 20 µL of a master mix containing 4% NP-40 and PNGase F (final 1% and 1 mU/well). Seal, mix, incubate at 37°C for 3 hours (optimized for high-throughput) on a thermal mixer.
- Labeling: Directly add 60 µL of pre-mixed 2-AB labeling reagent (as in Protocol 1) to each well. Re-seal, mix, incubate at 65°C for 1 hour.
- Automated Cleanup: Use a robotic liquid handler to transfer reaction mixtures to a 96-well hydrophilic filter plate pre-conditioned with ACN. Perform sequential washes with 85% ACN. Elute labeled glycans directly into a clean collection plate with 2x 100 µL water.
- Analysis: Directly inject from the collection plate using an autosampler coupled to the UPLC-FLR system.
Diagram: HILIC-UPLC-FLR Glycan Analysis Workflow
Diagram: Logical Decision Pathway for Glycan Analysis Method Selection
The Scientist's Toolkit: Key Research Reagent Solutions for HILIC-UPLC-FLR Glycan Analysis
Table 2: Essential materials and their functions.
| Item | Function & Rationale |
|---|---|
| PNGase F (Rapid or recombinant) | Enzyme that cleaves N-glycans from the asparagine backbone of glycoproteins. Essential for sample preparation. High-purity, rapid formulations enable high-throughput. |
| 2-Aminobenzamide (2-AB) Labeling Kit | Fluorescent tag conferring detection sensitivity for FLR. Kits provide optimized, stable reagents (dye, reductant) for reproducible labeling efficiency. |
| Hydrophilic SPE Plates/Cartridges (e.g., GlycoClean R, μElution plates) | For post-labeling cleanup to remove excess dye and salts, critical for reducing background noise and column fouling in UPLC. |
| HILIC UPLC Columns (e.g., BEH Glycan, Amide) | Stationary phase for separating glycans by hydrophilic interaction. Small particle sizes (1.7 µm) provide high resolution and fast separations. |
| Fluorescently Labeled Dextran Hydrolysis Ladder | External standard used to create a glucose unit (GU) calibration curve, allowing for glycan identification based on hydrodynamic volume. |
| Quantitative Glycan Primary Standards (e.g., pooled human IgG glycans) | Process control standard with known glycan profile. Used to validate system performance, retention time stability, and quantitative reproducibility. |
| 96-Well Polypropylene Plates & Sealers | Enables parallel, high-throughput sample processing. Compatible with liquid handlers and vacuum manifolds for automation. |
Application Notes
HILIC-UPLC-FLR in Monoclonal Antibody (mAb) Characterization
The analysis of N-linked glycosylation is a critical quality attribute for monoclonal antibodies, impacting effector functions, stability, and pharmacokinetics. HILIC-UPLC-FLR provides high-resolution separation of released, 2-AB-labeled glycans with fluorescence detection offering superior sensitivity and compatibility with mass spectrometry. This enables precise quantification of critical glycan species such as high-mannose, afucosylated, galactosylated, and sialylated structures.
Table 1: Key Glycan Attributes for mAb Characterization
| Glycan Feature | Typical Range in IgG1 | Impact on Function | HILIC-UPLC-FLR Resolution (Rs) |
|---|---|---|---|
| Afucosylation (G0F/G0) | 0.5% - 6% | Increases ADCC | ≥ 1.5 |
| High-Mannose (Man5/6/7/8/9) | 0.1% - 5% | Alters clearance rate | ≥ 1.8 |
| Galactosylation (G1F, G2F) | 5% - 30% | Modulates CDC | ≥ 1.2 |
| Sialylation (GS1F, GS2F) | 0% - 2% | May reduce immunogenicity | ≥ 1.0 |
Biomarker Discovery via Serum/Plasma Glycan Profiling
Alterations in the serum N-glycome are associated with various diseases, including cancers, inflammatory conditions, and congenital disorders of glycosylation. HILIC-UPLC-FLR of released serum glycans allows for high-throughput, reproducible screening of large cohorts to identify specific glycan biomarkers (e.g., increased branching, reduced sialylation).
Table 2: Example Serum Glycan Biomarkers in Disease States
| Disease State | Glycan Biomarker Change | Reported Fold-Change | Potential Clinical Utility |
|---|---|---|---|
| Hepatocellular Carcinoma | Increase in tri-antennary fucosylated glycans | 2.5 - 4.0 | Early detection |
| Rheumatoid Arthritis | Decrease in galactosylation of IgG Fc glycans | 0.3 - 0.6 | Disease activity monitoring |
| Alzheimer's Disease | Increase in bisecting GlcNAc on specific proteins | 1.8 - 2.2 | Differential diagnosis |
Critical Role in Biosimilar Development
For biosimilar approval, demonstration of analytical similarity to the reference product is paramount. HILIC-UPLC-FLR glycan profiling is a cornerstone technique for comparative analysis, ensuring the biosimilar's glycosylation profile falls within the natural heterogeneity of the innovator product.
Table 3: Biosimilarity Assessment Criteria via Glycan Profiling
| Analytical Parameter | Acceptance Criterion | Typical HILIC-UPLC-FLR Performance |
|---|---|---|
| Identification Match | Co-elution with reference standards | ≥ 99% |
| Quantitative Similarity (Main Peaks) | ± 1.5x SD of reference product mean | RSD < 5% (instrument precision) |
| Fingerprint Similarity (Overall Profile) | Statistical equivalence (e.g., f2 test) | Peak capacity > 200 |
Detailed Experimental Protocols
Protocol 1: Release and 2-AB Labeling of N-Glycans from mAbs
Objective: To prepare fluorescently labeled N-glycans from a purified monoclonal antibody for HILIC-UPLC-FLR analysis.
Materials:
- Purified monoclonal antibody (100 µg)
- PNGase F (recombinant, glycerol-free)
- 2-AB labeling kit (e.g., LudgerTag)
- DMSO (anhydrous)
- Acetonitrile (UPLC/MS grade)
- HILIC µElution plate (e.g., Waters)
Procedure:
- Denaturation & Digestion:
- Dilute 100 µg of mAb in 50 µL of 50 mM ammonium bicarbonate, pH 8.0.
- Add 1 µL of 5% (w/v) SDS and heat at 65°C for 10 min.
- Cool, add 10 µL of 10% (v/v) NP-40, and mix.
- Add 2 µL (1000 units) of PNGase F. Incubate at 37°C for 18 hours.
Glycan Clean-up:
- Apply the digest to a HILIC µElution plate pre-conditioned with 200 µL water and 200 µL 96% acetonitrile.
- Wash twice with 200 µL 96% acetonitrile.
- Elute glycans with 2 x 50 µL of ultra-pure water into a low-protein-binding microcentrifuge tube. Dry in a vacuum concentrator.
2-AB Labeling:
- Reconstitute dried glycans in 5 µL of labeling solution (2-AB in 70:30 DMSO:Acetic Acid).
- Add 5 µL of reducing agent (sodium cyanoborohydride in DMSO).
- Incubate at 65°C for 2 hours.
Excess Dye Removal:
- Dilute the labeling mixture with 90 µL of 96% acetonitrile.
- Load onto a second preconditioned HILIC µElution plate.
- Wash 4 times with 200 µL 96% acetonitrile.
- Elute labeled glycans with 2 x 50 µL water. Dry and reconstitute in 50 µL 76% acetonitrile for UPLC injection.
Protocol 2: HILIC-UPLC-FLR Analysis of 2-AB Labeled Glycans
Objective: To separate and quantify fluorescently labeled glycans using a HILIC-UPLC-FLR system.
Instrument Setup:
- UPLC System: ACQUITY UPLC H-Class PLUS with quaternary solvent manager.
- Column: ACQUITY UPLC Glycan BEH Amide, 1.7 µm, 2.1 x 150 mm.
- Column Temperature: 60°C.
- Flow Rate: 0.4 mL/min.
- Detection: FLR, λex = 330 nm, λem = 420 nm.
- Injection Volume: 5 µL (partial loop, needle overfill).
Gradient:
| Time (min) | % Buffer A (50 mM ammonium formate, pH 4.5) | % Buffer B (Acetonitrile) |
|---|---|---|
| 0.0 | 25 | 75 |
| 30.0 | 46 | 54 |
| 30.1 | 70 | 30 |
| 33.0 | 70 | 30 |
| 33.1 | 25 | 75 |
| 40.0 | 25 | 75 |
Data Analysis:
- Process chromatograms using dedicated software (e.g., Waters Empower, UNIFI).
- Identify peaks by retention time comparison to a 2-AB labeled glucose homopolymer ladder and/or known mAb glycan standards.
- Quantify by relative peak area percentage of total integrated area.
Protocol 3: Relative Quantification for Biosimilarity Assessment
Objective: To statistically compare the glycan profile of a biosimilar candidate to its reference medicinal product.
Procedure:
- Sample Preparation & Analysis:
- Prepare and analyze a minimum of six (6) independent batches of both the biosimilar candidate and the reference product per Protocol 1 & 2.
Data Normalization & Alignment:
- Align all chromatograms using a common internal standard or ladder.
- Create a consolidated peak list encompassing all major glycan species (>0.5% average abundance).
Statistical Comparison:
- For each glycan peak, calculate the mean and standard deviation (SD) for the reference product batches.
- Apply the ±1.5x SD equivalence range criterion.
- Plot the biosimilar candidate's mean value for each glycan against the reference product's mean and its equivalence range.
- Perform a multivariate analysis (e.g., Principal Component Analysis - PCA) on the full profile to assess overall similarity.
Diagrams
Title: HILIC-UPLC-FLR Glycan Sample Prep Workflow
Title: Biosimilar Glycan Analytical Similarity Pathway
The Scientist's Toolkit
Table 4: Essential Research Reagent Solutions for HILIC-UPLC-FLR Glycan Analysis
| Item | Function & Rationale |
|---|---|
| PNGase F (Glycerol-free) | Recombinant enzyme for efficient release of N-glycans from glycoproteins. Glycerol-free version is optimal for downstream labeling and UPLC. |
| 2-Aminobenzamide (2-AB) | Fluorescent label for glycans, enabling highly sensitive FLR detection. Offers good stability and chromatographic properties for HILIC. |
| HILIC µElution Plates (96-well) | Solid-phase extraction plates for rapid clean-up of released glycans and removal of excess fluorescent dye, ensuring sample purity for UPLC. |
| Acetonitrile (UPLC/MS Grade) | Primary organic mobile phase for HILIC separation. High purity is critical for low baseline noise and consistent retention times. |
| Ammonium Formate, pH 4.5 | Aqueous volatile buffer for HILIC mobile phase. Provides optimal pH for separation and is compatible with downstream MS if used. |
| 2-AB Labeled Glucose Homopolymer (Ladder) | External standard for converting retention time to Glucose Units (GU), enabling glycan identification via database matching (e.g., GlycoBase). |
| BEH Amide UPLC Column | Stationary phase designed for high-resolution HILIC separation of labeled glycans. 1.7 µm particles provide high peak capacity and efficiency. |
Step-by-Step Method Setup: From Sample Preparation to Data Acquisition
Optimized Glycan Release (Chemical/Enzymatic) and Fluorescent Labeling (2-AB, 2-AA, Procainamide)
Within the context of a broader thesis on HILIC-UPLC-FLR (Hydrophilic Interaction Liquid Chromatography-Ultra Performance Liquid Chromatography with Fluorescence Detection) for glycan profiling, the release and labeling of glycans are foundational steps. The choice between chemical and enzymatic release, paired with an optimal fluorescent tag, dictates the sensitivity, resolution, and quantitative accuracy of the entire analytical workflow. This document provides current Application Notes and detailed Protocols for these critical upstream processes.
Application Notes
Glycan Release: Enzymatic vs. Chemical
Enzymatic release using Peptide-N-Glycosidase F (PNGase F) is the gold standard for N-glycans due to its specificity and gentle conditions, preserving glycan structure. Chemical release via hydrazinolysis is non-selective but capable of releasing both N- and O-glycans, albeit with risks of degradation. For high-throughput therapeutic antibody characterization (e.g., monoclonal antibodies), enzymatic release is overwhelmingly preferred.
Fluorescent Labeling for HILIC-UPLC-FLR
Fluorescent tagging imparts both detectability and the chromatographic hydrophobicity necessary for HILIC separation. The choice of tag impacts fluorescence yield, stability, and separation profile.
- 2-AB (2-Aminobenzamide): Most common; offers good sensitivity and a wealth of comparative library data.
- 2-AA (2-Aminobenzoic Acid): Charged tag; can alter HILIC selectivity and improve resolution for some glycan subsets.
- Procainamide: Offers significantly higher fluorescence quantum yield (~3-4x that of 2-AB), enabling superior sensitivity for low-abundance glycans.
Table 1: Comparison of Fluorescent Tags
| Tag | Relative Fluorescence Yield | Key Advantage | Primary Consideration for HILIC |
|---|---|---|---|
| 2-AB | 1.0 (Reference) | Robust, established libraries | Standard hydrophobicity, well-characterized elution order |
| 2-AA | ~1.2 | Altered selectivity, may resolve isomers | More hydrophilic, earlier elution times |
| Procainamide | ~3.5 - 4.0 | Superior sensitivity for trace analysis | More hydrophobic, longer retention times; may require gradient optimization |
Table 2: Quantitative Recovery Data for Release Methods (Model IgG1)
| Release Method | Conditions | Typical N-Glycan Yield (%) | Notes |
|---|---|---|---|
| PNGase F (In-solution) | 37°C, 18h, non-reducing buffer | >95% | High fidelity, minimal core fucose modification. |
| PNGase F (Immobilized) | 50°C, 1h, on-bead | >90% | Rapid, easy enzyme removal, suitable for automation. |
| Hydrazinolysis | 60°C, 6h (N-glycans) | 70-85% | Risk of peeling (degradation) for some structures. |
Detailed Protocols
Protocol 1: High-Throughput Enzymatic Release Using Immobilized PNGase F
Objective: Efficient, rapid, and complete release of N-glycans from purified glycoproteins for HILIC-UPLC-FLR analysis. Materials: Glycoprotein sample, Immobilized PNGase F resin, PBS (pH 7.2), 0.1% RapiGest (in 50mM ammonium bicarbonate), 96-well filter plate.
- Denaturation: Dilute 10-50 µg glycoprotein in 50 µL of 0.1% RapiGest. Heat at 90°C for 3 minutes.
- Enzymatic Release: Add 10 µL of pre-washed immobilized PNGase F suspension to the cooled sample. Incubate at 50°C for 60 minutes with vigorous shaking.
- Separation: Centrifuge filter plate to separate released glycans (in flow-through) from the immobilized enzyme and protein. Collect flow-through.
- Clean-up: Pass glycan solution through a C18 cartridge to remove hydrophobic contaminants. Elute glycans with water and dry via vacuum centrifugation.
Protocol 2: Optimized Procainamide Labeling for Maximal Sensitivity
Objective: Derivatize released glycans with procainamide for high-sensitivity FLR detection. Materials: Dried glycan pool, Procainamide labeling solution (1.2M procainamide in DMSO:Acetic Acid:Dimethyl sulfoxide (70:30:0.1 v/v)), Sodium cyanoborohydride solution (1.0M in THF), 2.0 mL microcentrifuge tube.
- Labeling Reaction: Re-dry glycans thoroughly. Add 5 µL of procainamide solution and 5 µL of cyanoborohydride solution. Vortex vigorously.
- Incubation: Heat at 65°C for 2 hours.
- Purification: Cool and dilute reaction with 100 µL acetonitrile. Purify labeled glycans using HILIC solid-phase extraction (e.g., cotton wool or microcrystalline cellulose plate). Elute with water.
- Preparation for UPLC: Dry eluate, reconstitute in 80% acetonitrile, and centrifuge prior to injection on HILIC-UPLC-FLR.
The Scientist's Toolkit
Table 3: Essential Research Reagent Solutions
| Item | Function in Glycan Analysis |
|---|---|
| Immobilized PNGase F | Enzyme for specific, efficient N-glycan release; easily removed post-reaction. |
| RapiGest SF Surfactant | Acid-labile surfactant for protein denaturation without interfering with MS or LC. |
| Procainamide Hydrochloride | High-quantum-yield fluorophore for sensitive glycan labeling. |
| Sodium Cyanoborohydride | Reducing agent for reductive amination during labeling; selective and stable. |
| Acetonitrile (HPLC Grade) | Primary organic solvent for HILIC sample reconstitution and mobile phases. |
| HILIC SPE Microplates | For post-labeling cleanup to remove excess dye and salts. |
Workflow and Pathway Visualizations
Diagram 1: Glycan Profiling Workflow from Release to Analysis
Diagram 2: Mechanism of Reductive Amination for Labeling
Within a HILIC-UPLC-FLR setup for glycan profiling research, the selection of an appropriate stationary phase is a critical determinant of resolution, selectivity, and reproducibility. This guide provides a comparative analysis of BEH Glycan, Amide, and other common HILIC phases, supported by application notes and detailed protocols tailored for therapeutic glycoprotein characterization.
Comparative Analysis of HILIC Stationary Phases
Key Characteristics and Performance Data
The following table summarizes the core properties of widely used HILIC columns for glycan analysis.
Table 1: Comparative Properties of HILIC Stationary Phases for Glycan Profiling
| Stationary Phase Type | Common Commercial Examples | Surface Chemistry | Key Mechanism for Glycan Retention | Optimal pH Range | Relative Hydrophilicity | Typical Application in Glycan Profiling |
|---|---|---|---|---|---|---|
| BEH Glycan | ACQUITY UPLC Glycan BEH | Bridged Ethylene Hybrid (BEH) particles with amide | Hydrophilic interaction & dipole-dipole | 4.5-5.5 | High | High-resolution profiling of released, labeled N-glycans; standard for biopharma. |
| Amide | ACQUITY UPLC BEH Amide, TSKgel Amide-80 | Alkyl chain with amide functional group | Hydrophilic interaction & hydrogen bonding | 2-7 | High | Broad-range glycan profiling, including polar O-glycans and sialylated species. |
| Silica | XBridge BEH HILIC, Luna HILIC | Underivatized silica (silanol groups) | Hydrophilic interaction & ion-exchange | 2-8 | Moderate | Separation of neutral and charged glycans; sensitive to buffer conditions. |
| Diol | Nucleosil OH, YMC-Pack Diol | Diol (hydroxyl) groups | Hydrophilic interaction & hydrogen bonding | 2-7.5 | Moderate-High | Mild selectivity, often used for fractionation or preparative separations. |
| Zwitterionic | ZIC-cHILIC, ZIC-pHILIC | Sulfobetaine (charged) groups | Hydrophilic & ionic interactions | 3-8 | Very High | Retention of highly polar and charged glycans; complex salt requirements. |
Table 2: Quantitative Performance Comparison for 2-AB Labeled N-Glycans (Theoretical Values)
| Performance Metric | BEH Glycan Column | BEH Amide Column | Silica HILIC Column |
|---|---|---|---|
| Peak Capacity (Isocratic/Shallow Grad.) | ~120-150 | ~100-130 | ~90-120 |
| Reproducibility (%RSD tR) | < 0.5% | < 0.8% | < 1.5% |
| Separation Factor (α) for G1F/G1'F | ~1.05 | ~1.03 | Variable |
| Backpressure (at 0.4 mL/min) | ~8000 psi | ~7500 psi | ~7000 psi |
| Lifetime (Injections to 10% Loss in Res.) | ~500-700 | ~400-600 | ~300-500 |
Detailed Experimental Protocols
Protocol 1: Standard N-Glycan Profiling Using a BEH Glycan Column
Objective: To separate and profile 2-aminobenzamide (2-AB) labeled N-glycans released from a monoclonal antibody.
Materials:
- Column: ACQUITY UPLC Glycan BEH Column, 130Å, 1.7 µm, 2.1 mm x 150 mm.
- Mobile Phase A: 50 mM ammonium formate, pH 4.5 (adjusted with formic acid).
- Mobile Phase B: 100% Acetonitrile (ULC/MS grade).
- Sample: 2-AB labeled N-glycans in 75-85% acetonitrile.
- System: UPLC equipped with FLR (λex=330 nm, λem=420 nm).
Method:
- Column Equilibration: Maintain column at 60°C. Equilibrate at 70% B for 5-10 column volumes at 0.4 mL/min.
- Injection: Inject 1-10 µL of sample.
- Gradient Elution:
- 0-25 min: 70% B to 53% B (linear gradient).
- 25-26 min: 53% B to 40% B (quick wash).
- 26-27 min: Hold at 40% B.
- 27-28 min: Return to 70% B.
- 28-35 min: Re-equilibrate at 70% B.
- Data Analysis: Identify peaks by comparison with an external hydrolyzed and labeled glucose homopolymer (dextran) ladder for GU value calibration.
Protocol 2: Broad-Spectrum Glycan Analysis Using an Amide Column
Objective: To separate a complex mixture of neutral and sialylated glycans.
Materials:
- Column: ACQUITY UPLC BEH Amide Column, 130Å, 1.7 µm, 2.1 mm x 150 mm.
- Mobile Phase A: 100 mM ammonium formate, pH 4.4.
- Mobile Phase B: Acetonitrile with 0.1% formic acid.
- System: UPLC-FLR (as above) or coupled to MS.
Method:
- Column Equilibration: Maintain at 40°C. Equilibrate at 80% B for 5 column volumes at 0.3 mL/min.
- Injection: Inject 2 µL of sample in high organic solvent (>80% ACN).
- Gradient Elution:
- 0-2 min: Hold at 80% B.
- 2-47 min: 80% B to 50% B (shallow linear gradient).
- 47-49 min: 50% B to 20% B (strong wash).
- 49-55 min: Re-equilibrate at 80% B.
- MS Compatibility: This method uses volatile buffers and is suitable for direct coupling to ESI-MS for glycan identification.
Visualization of Workflows and Relationships
HILIC-Based Glycan Profiling Workflow
Retention Mechanisms in HILIC for Glycans
The Scientist's Toolkit: Research Reagent Solutions
Table 3: Essential Materials for HILIC-UPLC-FLR Glycan Profiling
| Item | Function & Importance in Glycan Profiling |
|---|---|
| PNGase F (Recombinant) | Enzyme for efficient release of N-linked glycans from glycoproteins under native or denaturing conditions. |
| 2-Aminobenzamide (2-AB) | Fluorescent label for glycans; enables highly sensitive FLR detection and introduces a hydrophobic moiety for improved HILIC retention. |
| Sodium Cyanoborohydride | Reducing agent used in the reductive amination labeling reaction of glycans with 2-AB. |
| DMT-MM Catalyst | Alternative, efficient catalyst for labeling glycans with 2-AA/2-AB, often yielding higher efficiency. |
| Hydrophilic PVDF Plates | Used for rapid cleanup of labeled glycans via hydrophilic interaction, removing excess dye and salts. |
| Ammonium Formate | Volatile salt for preparing HILIC mobile phase A; provides buffering capacity and is MS-compatible. |
| Acetonitrile (ULC/MS Grade) | Primary organic solvent (mobile phase B) for HILIC; high purity is critical for low baseline noise in FLR. |
| Dextran Ladder Hydrolysate | Mixture of glucose oligomers used as an external standard to create a Glucose Unit (GU) calibration curve for glycan identification. |
| BEH Glycan / BEH Amide UPLC Columns | Robust, high-resolution stationary phases specifically engineered for reproducible glycan separations. |
| Formic Acid (Optima Grade) | Used for precise pH adjustment of ammonium formate buffers to fine-tune selectivity and peak shape. |
1. Introduction Within a HILIC-UPLC-FLR (Hydrophilic Interaction Liquid Chromatography-Ultra Performance Liquid Chromatography-Fluorescence) setup for glycan profiling, the construction of the elution gradient is the critical determinant of resolution, sensitivity, and reproducibility. This protocol details the optimized use of volatile buffers (ammonium formate/acetate) and acetonitrile (ACN) for the efficient separation of released and fluorescently labeled glycans, a cornerstone technique in biotherapeutic development and biomarker discovery.
2. Key Reagent Solutions & Materials Table 1: Essential Research Reagent Solutions for HILIC Glycan Profiling
| Item | Function & Rationale |
|---|---|
| Ammonium Formate (e.g., 50-200 mM, pH 4.5) | Volatile buffer salt. Provides consistent ionic strength to control ionization and ensure reproducible retention times. Its volatility prevents source contamination in downstream MS coupling. |
| Ammonium Acetate (e.g., 50-200 mM, pH 4.5) | Alternative volatile buffer. Can offer subtly different selectivity for certain glycan isomers compared to formate. |
| HPLC-Grade Acetonitrile (ACN) | Primary organic mobile phase (>70% starting concentration). Forms a water-depleted layer on the stationary phase, enabling HILIC partitioning. |
| Aqueous Acid (e.g., Formic Acid, 0.1% v/v) | Used to adjust buffer pH. Lower pH (4.0-4.5) protonates sialic acids, neutralizing their charge for robust separation based on hydrophilicity. |
| 2-AB or Procainamide Labeling Kit | Fluorescent tags (2-Aminobenzamide or Procainamide) for glycan derivatization, enabling highly sensitive FLR detection. |
| Glycan BEH Amide, 1.7 µm UPLC Column | Standard stationary phase. Contains bridged ethylene hybrid (BEH) particles with amide groups for hydrophilic interactions. |
3. Optimized Elution Gradient Protocol Table 2: Standardized HILIC-UPLC Gradient for 2-AB Labeled N-Glycans
| Time (min) | % Acetonitrile | % Buffer (e.g., 100mM Amm. Formate, pH 4.5) | Flow Rate (mL/min) | Gradient Curve |
|---|---|---|---|---|
| Initial (0) | 78 | 22 | 0.4 | Equilibration |
| 2.0 | 78 | 22 | 0.4 | Hold |
| 40.0 | 53 | 47 | 0.4 | Linear |
| 40.1 | 30 | 70 | 0.4 | Step |
| 42.0 | 30 | 70 | 0.4 | Hold (Column Wash) |
| 42.1 | 78 | 22 | 0.4 | Step |
| 50.0 | 78 | 22 | 0.4 | Hold (Re-equilibration) |
Protocol Steps:
- Mobile Phase Preparation:
- Solvent A: 100 mM Ammonium Formate (or Acetate), pH 4.5. Weigh 6.3g ammonium formate, dissolve in 950mL HPLC-grade water, adjust pH with formic acid, and make up to 1L.
- Solvent B: 100% HPLC-grade Acetonitrile.
- Filter all solvents through 0.22 µm nylon membrane filters and degass.
- System Equilibration: Prime the UPLC system with the prepared solvents. Install the BEH Glycan column (2.1 x 150 mm, 1.7 µm) and equilibrate at initial conditions (78% B, 22% A) for at least 10 column volumes or until a stable baseline is achieved.
- Sample Preparation: Resuspend dried, fluorescently labeled (e.g., 2-AB) glycans in 100% ACN to match the injection solvent strength (typically >70% ACN). Centrifuge at 13,000 x g for 5 minutes before transfer to a UPLC vial.
- Injection & Run: Inject 1-10 µL of sample. Initiate the gradient program as defined in Table 2. The FLR detector parameters are typically set to Ex λ = 330 nm, Em λ = 420 nm for 2-AB.
- Column Regeneration & Storage: After the run sequence, wash the column with 30% ACN/70% water for 10 minutes, then store in 90% ACN at recommended temperature.
4. Impact of Gradient Parameters: Data Summary Table 3: Effect of Buffer and Gradient Parameters on Glycan Separation
| Parameter | Effect on Early Eluting Glycans (High Mannose) | Effect on Late Eluting Glycans (Sialylated) | Optimal Range for Resolution |
|---|---|---|---|
| Starting %ACN | Increases retention if >80%; may cause poor solubility if too high. | Minor effect. | 75-80% |
| Final %ACN | Minor effect. | Critical for elution; <55% required for complete elution of trisialylated species. | 50-55% |
| Gradient Slope (Δ%ACN/min) | Steeper slopes reduce resolution of isomers. | Steeper slopes compress later peaks. | 0.5-0.7% ACN/min |
| Buffer Concentration | <50 mM can cause peak tailing; >150 mM may increase MS noise. | Higher concentration can improve peak shape for charged species. | 50-100 mM |
| Buffer Type (Formate vs. Acetate) | Slightly shorter retention with acetate at same pH. | Acetate can alter selectivity and resolution of sialylated isomers. | Formate for standard profiling; Acetate for isomer investigation. |
HILIC Glycan Elution Gradient Workflow
Buffer Selection Logic for Glycan Profiling
Within the context of a HILIC-UPLC-FLR setup for glycan profiling research, the optimization of key instrument parameters is critical for achieving high-resolution separation, sensitive detection, and reproducible quantification of complex glycan samples. This protocol details the systematic optimization of flow rate, column temperature, and fluorescence detector (FLR) excitation/emission wavelengths to maximize performance for 2-AB labeled N-glycans.
Table 1: Optimized HILIC-UPLC-FLR Parameters for 2-AB Labeled N-Glycan Profiling
| Parameter | Recommended Range | Optimal Setting (Example) | Impact on Performance |
|---|---|---|---|
| Flow Rate | 0.2 - 0.6 mL/min | 0.4 mL/min | Lower flow increases resolution but extends run time; higher flow reduces resolution and increases backpressure. |
| Column Temperature | 40 - 60°C | 55°C | Higher temperature improves mass transfer, sharpens peaks, and reduces backpressure. Must be below column limit. |
| FLR Excitation (Ex) | 330 - 360 nm | 330 nm | Must match the absorbance maximum of the fluorophore (2-AB: λex ~330 nm). |
| FLR Emission (Em) | 420 - 450 nm | 420 nm | Must match the emission maximum of the fluorophore (2-AB: λem ~420 nm). |
| Injection Volume | 1 - 10 µL | 5 µL | Volume must be balanced between sensitivity and potential column overload/band broadening. |
| Gradient Time | 30 - 120 min | 90 min | Longer gradients improve resolution of complex mixtures but increase analysis time. |
Table 2: Effect of Flow Rate on Key Performance Indicators (KPIs)
| Flow Rate (mL/min) | Retention Time of Man5 (min) | Resolution (Peaks 5 & 6)* | System Backpressure (psi) | Approximate Run Time |
|---|---|---|---|---|
| 0.2 | 45.2 | 2.5 | 4,500 | 140 min |
| 0.4 | 22.6 | 1.8 | 8,900 | 70 min |
| 0.6 | 15.1 | 1.2 | 13,400 | 47 min |
*Example peaks from a complex N-glycan standard.
Detailed Experimental Protocols
Protocol 3.1: Systematic Optimization of Flow Rate and Temperature
Objective: To determine the combination of flow rate and column temperature that provides optimal resolution within an acceptable analysis time and pressure limit for a standard N-glycan mixture.
Materials:
- HILIC-UPLC system (e.g., ACQUITY UPLC I-Class)
- Glycan BEH Amide column, 1.7 µm, 2.1 x 150 mm
- Labeled N-Glycan Standard (e.g., 2-AB labeled IgG N-glycan standard)
- Mobile Phase A: 50 mM ammonium formate, pH 4.4
- Mobile Phase B: Acetonitrile
Procedure:
- System Equilibration: Install the column and equilibrate at an initial condition of 75% B, 0.4 mL/min, 40°C for 30 minutes with FLR detection (Ex/Em 330/420 nm).
- Temperature Gradient Experiment: Set flow rate to 0.4 mL/min. Perform a separation of the standard (5 µL injection) using a linear gradient from 75% B to 50% B over 60 minutes at three different column temperatures: 40°C, 50°C, and 60°C. Record chromatograms and system pressure.
- Flow Rate Gradient Experiment: Set column temperature to the optimal value from step 2 (e.g., 50°C). Perform the same separation gradient at three different flow rates: 0.2, 0.4, and 0.6 mL/min.
- Data Analysis: For each run, calculate the resolution (Rs) between two closely eluting critical peak pairs (e.g., FA2/FA2G1). Plot Rs and backpressure against temperature and flow rate. Select the condition that provides Rs > 1.5 for all critical pairs while keeping backpressure below 15,000 psi and run time under 90 minutes.
Protocol 3.2: Verification and Fine-Tuning of FLR Wavelengths
Objective: To confirm the optimal Ex/Em wavelengths for maximum signal-to-noise ratio (S/N) for 2-AB labeled glycans in the experimental matrix.
Materials:
- As in Protocol 3.1.
- FLR detector with programmable wavelength selection.
Procedure:
- Excitation Scan: Using the optimal chromatographic conditions from Protocol 3.1, set the emission wavelength to 420 nm. Perform three identical injections of the standard, scanning the excitation wavelength in 5 nm increments from 310 nm to 370 nm.
- Emission Scan: Set the excitation wavelength to the value yielding the highest peak area (typically 330 nm). Perform three identical injections, scanning the emission wavelength in 5 nm increments from 400 nm to 460 nm.
- Signal-to-Noise Calculation: For a medium-intensity, well-resolved peak in each run, calculate the S/N ratio (peak height / baseline noise). Tabulate S/N against wavelength.
- Final Selection: Choose the Ex/Em pair that delivers the highest S/N. Minor adjustments (±2 nm) may be made to avoid any background interference from the mobile phase or column bleed.
Visualization: HILIC-FLR Glycan Profiling Workflow
HILIC-FLR Glycan Analysis Workflow
The Scientist's Toolkit: Key Research Reagent Solutions
Table 3: Essential Materials for HILIC-UPLC-FLR Glycan Profiling
| Item | Function & Rationale |
|---|---|
| Glycan BEH Amide Column (1.7 µm, 2.1 x 150 mm) | Provides hydrophilic interaction chromatography (HILIC) stationary phase for high-resolution separation of glycans based on hydrophilicity and size. |
| 2-Aminobenzamide (2-AB) Labeling Kit | Contains the fluorescent dye and reducing agent for glycan labeling, enabling highly sensitive FLR detection. |
| Ammonium Formate (e.g., 50 mM, pH 4.4) | Used as the aqueous, salt-based mobile phase (Mobile Phase A). Volatile and compatible with MS detection if used downstream. |
| Acetonitrile (LC-MS Grade) | Used as the organic mobile phase (Mobile Phase B). High purity is essential for low background noise in FLR. |
| PNGase F Enzyme | Glycosidase enzyme used for the efficient release of N-linked glycans from glycoproteins. |
| Glycan Standard (e.g., hydrolyzed glucose homopolymer or labeled N-glycan standard) | Critical for system suitability testing, creating a retention time index (GU) for peak identification, and monitoring performance. |
| Microcentrifuge Vacuum Concentrator | For drying glycan samples prior to labeling and reconstitution in injection solvent. |
This Application Note details a standardized protocol for processing data from a Hydrophilic Interaction Liquid Chromatography coupled with Ultra-Performance Liquid Chromatography and Fluorescence Detection (HILIC-UPLC-FLR) system, specifically applied to released N-glycan profiling. The workflow is integral to a broader thesis investigating glycosylation patterns in biotherapeutic drug development and biomarker discovery. Accurate processing from raw chromatogram to quantified relative abundance is critical for reproducibility and biological interpretation.
The end-to-end data processing pipeline involves sequential steps to transform raw detector signals into biologically meaningful quantitative data.
Diagram Title: HILIC Glycan Data Processing Pipeline
Detailed Protocols
Protocol: Chromatogram Pre-processing and Peak Picking
Objective: To reduce noise and consistently identify all chromatographic peaks.
Materials: Raw FLR data file (ASCII .csv or .cdf format), Data processing software (e.g., Empower, Chromeleon, or open-source tools like MZmine 2 adapted for FLR).
Procedure:
- Data Import: Load the raw chromatogram data file into the processing software. Ensure the x-axis is in minutes and the y-axis is in fluorescence units (RFU).
- Baseline Correction: Apply a asymmetric least squares (AsLS) or rolling ball algorithm to subtract baseline drift. Use a window width of 1.0-2.0 minutes.
- Smoothing: Apply a Savitzky-Golay filter (2nd polynomial order, 7-13 point window) to reduce high-frequency noise without significantly distorting peak shape.
- Peak Detection: Set the peak detection algorithm with the following initial parameters:
- Peak Width: 0.1 - 0.3 min (for UPLC).
- Noise Threshold: 3-5x standard deviation of baseline noise.
- Minimum Peak Height: 10-50 RFU (adjust based on signal).
- Peak Shape Model: Gaussian or Exponentially Modified Gaussian (EMG) for HILIC peaks.
- Execute Detection: Run the algorithm to generate an initial peak list with retention time (RT), height, and width.
Protocol: Retention Time Alignment Across Samples
Objective: To correct for minor run-to-run retention time shifts enabling cross-sample comparison.
Procedure:
- Reference Selection: Designate a representative sample (e.g., a pooled QC or central standard) as the alignment reference.
- Landmark Identification: Manually or automatically assign 3-5 well-resolved, high-intensity peaks as landmarks across all chromatograms.
- Alignment Model: Apply a linear or non-linear (e.g., lowess) warping function to map the RT of each sample to the reference.
- Validation: Visually inspect the overlay of aligned chromatograms. The coefficient of variation (CV%) for landmark peak RTs should be < 0.5% post-alignment.
Protocol: Peak Assignment Using Glucose Unit (GU) Values
Objective: To assign putative glycan structures to each detected peak.
Materials: External standard ladder of 2-aminobenzamide (2-AB) labeled glucose oligomers (dextran hydrolysate). Published GU value database (e.g., from GlycoStore, EUROCarbDB).
Procedure:
- GU Calibration: Run the dextran ladder under identical chromatographic conditions. Record the RT of each glucose oligomer (DP1-DP30).
- Calculate GU: For each oligomer, plot log(RT) versus DP number to create a calibration curve. Fit a linear or quadratic regression.
- Convert Sample RTs: For every peak in the aligned sample chromatogram, calculate its GU value using the regression equation from step 2.
- Database Matching: Compare calculated GU values (±0.05 GU tolerance) against a reference database of known 2-AB labeled N-glycan GU values. Assign the putative structure(s).
- Validation: Confirm assignments by co-injection with known standards or enzymatic digestion (e.g., with sialidases or fucosidases) followed by re-analysis.
Protocol: Relative Peak Quantitation and Normalization
Objective: To calculate the relative percentage abundance of each assigned glycan.
Procedure:
- Peak Integration: For each assigned peak, integrate the fluorescence signal (Area Under the Curve, AUC). Use consistent integration boundaries across all samples.
- Total Area Summation: Sum the AUC of all integrated peaks within a chromatogram. This is the Total Integrated Area (TIA). Exclude solvent front and known contaminant peaks.
- Relative Abundance Calculation: For each assigned glycan peak (i), calculate its relative percentage abundance:
% Abundance_i = (AUC_i / TIA) * 100 - Data Filtering: Apply a minimum abundance threshold (e.g., 0.1% of TIA) to remove low-confidence assignments.
- Output: Generate a final table with columns: Sample ID, Assigned Glycan, GU Value, Retention Time, Peak Area, and Relative Abundance (%).
Data Presentation: Typical Quantitative Output
Table 1: Processed HILIC-UPLC-FLR Data for a Monoclonal Antibody N-Glycan Profile
| Assigned Glycan | GU Value | Retention Time (min) | Peak Area (µV*sec) | Relative Abundance (%) | CV% (n=3) |
|---|---|---|---|---|---|
| G0F | 6.00 | 8.12 | 1,250,450 | 45.2 | 1.5 |
| G1F (α1,6) | 6.38 | 8.95 | 752,300 | 27.2 | 2.1 |
| G2F | 7.05 | 10.21 | 410,500 | 14.8 | 1.8 |
| Man5 | 5.52 | 7.45 | 98,750 | 3.6 | 3.5 |
| G0F-GlcNAc | 6.85 | 9.88 | 158,200 | 5.7 | 2.4 |
| Unassigned Peak | 7.52 | 10.98 | 102,100 | 3.5 | 4.2 |
Table 2: Key Algorithm Parameters for Data Processing Steps
| Processing Step | Parameter | Recommended Setting | Purpose |
|---|---|---|---|
| Baseline Correction | Method | AsLS | Removes slow, non-linear baseline drift. |
| Smoothing | Savitzky-Golay Window | 9 points | Balances noise reduction with peak fidelity. |
| Peak Detection | Minimum Peak Width | 0.15 min | Avoids detection of system noise spikes as peaks. |
| Peak Detection | Signal-to-Noise (S/N) | 5 | Ensures only true analyte peaks are detected. |
| RT Alignment | Warping Function | Lowess | Corrects non-linear RT shifts effectively. |
| GU Matching | Tolerance Window | ±0.05 GU | Accounts for minor analytical variability in GU measurement. |
| Quantitation | Minimum Abundance | 0.1% of TIA | Filters out trace-level, poorly integrated peaks. |
The Scientist's Toolkit: Essential Research Reagent Solutions
Table 3: Key Reagents and Materials for HILIC-UPLC-FLR Glycan Profiling
| Item Name | Function / Purpose in Workflow | Example Vendor/Cat. No. (Informational) |
|---|---|---|
| 2-AB Labelling Kit | Fluorescent tag for glycans, enabling sensitive FLR detection. | ProZyme (GLY001) |
| Dextran Hydrolysate Ladder | Glucose oligomer standard for creating the GU calibration curve for peak assignment. | Sigma-Aldrich (D4775) |
| Glycan Release Kit (PNGase F) | Enzymatically cleaves N-glycans from glycoproteins for analysis. | New England Biolabs (P0704) |
| HILIC UPLC Column (e.g., BEH Amide) | Stationary phase for separating glycans based on hydrophilicity. | Waters (186004742) |
| Mobile Phase Solvents (ACN, NH4Fo) | High-purity Acetonitrile and Ammonium Formate buffer for HILIC chromatography. | Honeywell/Thermo Fisher |
| Processed Glycan Standard (e.g., A2G2) | Assigned glycan standard for method validation and confirmation of peak identity. | Dextra Laboratories |
| Data Processing Software | Platform for executing pre-processing, alignment, integration, and quantitation protocols. | Waters Empower, Thermo Chromeleon |
| GU Value Reference Database | Public/Commercial database correlating GU values to known glycan structures for assignment. | GlycoStore (online) |
Critical Pathway for Quality Control
Diagram Title: QC Decision Pathway for Glycan Profiling Data
Solving Common HILIC-UPLC-FLR Challenges: Peak Shape, Resolution, and Reproducibility
Diagnosing and Correcting Poor Peak Shape (Tailing/Fronting) and Broad Peaks
Application Notes & Protocols for HILIC-UPLC-FLR Glycan Profiling
Within the broader thesis investigating N-linked glycan profiling as a critical quality attribute (CQA) for biotherapeutics using a HILIC-UPLC-FLR platform, peak shape integrity is paramount. Optimal peak symmetry (Gaussian) is essential for accurate quantification, isomer separation, and reliable automated processing. Poor peak shape—manifesting as tailing, fronting, or excessive broadening—directly compromises resolution, quantification precision, and the detection of low-abundance species, thereby threatening the validity of structure-function relationship conclusions.
The following table consolidates root causes and corresponding corrective actions based on current literature and practical UPLC experience.
Table 1: Diagnosis and Correction of Suboptimal Peak Shapes in HILIC-UPLC Glycan Analysis
| Peak Anomaly | Primary Suspect Causes | Diagnostic Checks | Corrective Protocols & Solutions |
|---|---|---|---|
| Tailing (Asymmetry >1.5) | 1. Secondary Interactions: Unsilanol activity, metal contaminants. 2. Overload: Sample amount exceeds column capacity. 3. Weak Solvent: Mobile phase B too strong, causing delayed elution. | 1. Inject a basic test probe (e.g., nicotine). 2. Inject a series of diluted samples. 3. Check system void volume and detector cell volume. | 1. Protocol A: Increase ammonium acetate (25-50 mM) to shield silanols. Use high-purity, dedicated HILIC columns. 2. Protocol B: Reduce injection volume/mass. Dilute sample 5-10x and re-inject. 3. Protocol C: Decrease initial %B (e.g., from 80% to 75% ACN) in gradient. |
| Fronting (Asymmetry <0.8) | 1. Column Degradation: Inlet frit blockage or bed disturbance. 2. Inappropriate Solvent: Sample solvent stronger than mobile phase. 3. Channeling: Column void formation. | 1. Observe pressure trend over time. 2. Compare with fresh column. 3. Visual check of column end fittings. | 1. Protocol D: Reverse-flush column according to manufacturer's instructions. Replace inlet frit. 2. Protocol E: Re-constitute/dilute sample in starting mobile phase or higher % aqueous. 3. Protocol F: Replace column. Implement pressure limit alarms. |
| Broad Peaks (Increased W) | 1. Extra-Column Volume: Post-column tubing, detector cell. 2. Suboptimal Gradient: Shallow slope for early eluters. 3. Diffusion: Low temperature, low flow rate. 4. Instrument Dispersion: Worn injector rotor seal. | 1. Measure system dispersion with a zero-dead-volume union. 2. Analyze peak width vs. retention time plot. 3. Check injector performance test reports. | 1. Protocol G: Minimize all connection tubing (0.12mm ID), ensure proper FLR flow cell (≤1.5 µL). 2. Protocol H: Steepen initial gradient slope (e.g., 0.5% B/min to 1.0% B/min). 3. Protocol I: Increase temperature (55-65°C) and/or flow rate (0.3-0.4 mL/min). 4. Protocol J: Replace injector seal, perform carryover test. |
Detailed Experimental Protocols
Protocol A: Column Silanol Activity Test and Conditioning
Purpose: To diagnose and mitigate secondary interactions causing tailing.
- Prepare Test Solution: 0.1 mg/mL nicotine in mobile phase A (85% ACN, 15% 50mM ammonium formate, pH 4.5).
- Chromatographic Conditions: Isocratic, 85% ACN/15% aqueous buffer, 0.4 mL/min, 40°C, FLR (Ex/Em: 260/340 nm for nicotine).
- Procedure: Inject 2 µL of test solution. Calculate asymmetry factor at 10% peak height.
- Conditioning: If As > 2.0, flush column with 20 column volumes (CV) of 50:50 ACN/water with 0.5% formic acid, followed by 20 CV of 90:10 ACN/200mM ammonium acetate (pH 5.0). Re-equilibrate and re-test.
Protocol B: Sample Load Capacity Study for Glycan 2-AB Derivatives
Purpose: To determine the optimal injection amount for Gaussian shape.
- Prepare Stock: A well-characterized N-glycan 2-AB standard (e.g., A2G2S2).
- Serial Dilution: Create a 5-point dilution series in 75% ACN/water from 100 pmol/µL to 1.5 pmol/µL.
- Chromatography: Standard HILIC gradient (e.g., 75-62% ACN over 30 min), 0.4 mL/min, 60°C.
- Analysis: Inject 5 µL of each. Plot Peak Asymmetry vs. Injected Mass. The point where As deviates >10% from 1.0 defines the practical load limit.
Protocol G: System Dispersion Measurement and Minimization
Purpose: To identify and reduce extra-column peak broadening.
- Bypass Column: Replace column with a zero-dead-volume union (e.g., 360 µm ID).
- Prepare Pulse: Inject 1 µL of 10% acetone in water. Use isocratic 50% ACN/water at 0.4 mL/min. Monitor UV at 265 nm.
- Calculate Variance: Measure the width of the resulting peak at half height (W₀.₅). Variance σ²ₛᵧₛ = (W₀.₅/2.355)².
- Optimize: Ensure all post-union tubing is ≤ 15 cm length and 0.12 mm ID. For FLR, confirm flow cell volume (≤1.5 µL is ideal for 2.1 mm ID columns). Re-measure after adjustments.
The Scientist's Toolkit: Research Reagent Solutions
Table 2: Essential Materials for HILIC-UPLC-FLR Glycan Profiling Optimization
| Item | Function & Rationale |
|---|---|
| High-Purity HILIC Column (e.g., BEH Amide, 1.7 µm, 2.1 x 150 mm) | Provides reproducible glycan separation based on hydrophilicity. Charged surface chemistry requires careful mobile phase control to manage silanol effects. |
| LC-MS Grade Acetonitrile | Primary organic modifier. UV-transparency and purity are critical for low-background FLR detection. |
| Ammonium Acetate/Formate (≥99%) | Volatile buffers for mobile phase. Concentration (10-50 mM) and pH (4.0-5.0) control ionization, selectivity, and peak shape. |
| 2-Aminobenzamide (2-AB) Labeling Kit | Fluorophore tag for sensitive FLR detection. Derivatization must be quantitative and clean to avoid artifact peaks. |
| Glycan Proficiency Test Mix | A defined set of labeled glycans (e.g., from IgG) to serve as a system suitability test for resolution, retention, and peak shape. |
| In-Line 0.1 µm Filter | Placed between injector and column to protect from particulate matter originating from samples or seals. |
| Pre-Slit Silicone/PFTE Septa | For vial closures; prevents coring and introduction of polymer fragments that can block column frits. |
| Needle Wash Solution (75% ACN) | Strong wash solvent compatible with sample solvent to minimize carryover between injections. |
Diagnostic and Troubleshooting Workflows
Diagram Title: Decision Tree for Diagnosing Poor Peak Shape in HILIC-UPLC
Diagram Title: HILIC-UPLC-FLR Workflow & Peak Shape Influences
Strategies to Improve Resolution of Critical Isomeric and Sialylated Glycan Pairs
Application Notes
Within the context of a broader thesis utilizing HILIC-UPLC-FLR for comprehensive glycan profiling, resolving critical isomeric and sialylated glycan pairs remains a primary analytical challenge. Isomers differing in linkage (e.g., α2,3- vs α2,6-sialylation) or antennary structure (e.g., 2,4- vs 2,6-branched isomers) often co-elute under standard HILIC conditions. Similarly, glycans with varying degrees of sialylation (mono-, di-, tri-sialylated) require precise separation for accurate quantification. Recent advancements focus on optimizing the chromatographic phase, mobile phase composition, and temperature to exploit subtle differences in glycan hydrophilicity and steric interactions. Enhanced resolution is critical for correlating specific glycoforms with biological activity in biotherapeutic development.
Table 1: Comparison of HILIC Phases for Isomeric Separation
| HILIC Phase (Column Chemistry) | Resolution (Rs) of A2G2S1 Isomers* | Resolution (Rs) of FA2(6)G2 / FA2(3)G2* | Optimal Temperature Range |
|---|---|---|---|
| Standard Amide (e.g., BEH Glycan) | 0.8 - 1.2 | < 0.5 | 40-60°C |
| Charged Surface Hybrid (CSH) Amide | 1.5 - 1.8 | 0.9 - 1.1 | 25-40°C |
| Advanced Mixed-Mode (e.g., Bridge Ethylene Hybrid) | > 2.0 | > 1.5 | 30-50°C |
Table 2: Impact of Mobile Phase Modifiers on Sialylated Pair Resolution
| Additive (in Acetonitrile/Ammonium Formate buffer) | % Improvement in Rs for Di-Sialylated Isomers | Effect on Fluorescence Signal (FLR) |
|---|---|---|
| None (Standard Buffer) | Baseline (0%) | Baseline |
| 0.1% Trifluoroacetic Acid (TFA) | 15-20% | Signal Suppression (~10%) |
| 10mM Diethylamine (DEA) | 25-35% | Signal Enhancement (~5%) |
| 5-10mM Ammonium Bicarbonate | 10-15% | Minimal Change |
Detailed Experimental Protocols
Protocol 1: Optimized HILIC-UPLC-FLR Method for Isomeric Separation
Objective: To separate isomeric N-glycan pairs (e.g., galactose linkage isomers) from a released and 2-AB labeled human IgG sample. Materials: See "Scientist's Toolkit" below. Procedure:
- Column Conditioning: Equilibrate a 2.1 x 150 mm, 1.7 µm CSH or advanced mixed-mode Amide column at 0.4 mL/min with 75% Buffer B (50 mM ammonium formate, pH 4.4) and 25% Buffer A (100% acetonitrile) for 15 minutes.
- Sample Injection: Inject 5-10 µL of labeled glycan sample (0.5-2 nmol on-column) in 75-85% acetonitrile.
- Gradient Elution: Apply a shallow gradient at 45°C:
- Hold at 75% A / 25% B for 3 min.
- Linear gradient to 62% A / 38% B over 90 minutes.
- Return to initial conditions over 2 min and re-equilibrate for 15 min.
- Detection: Use FLR with λex=330 nm, λem=420 nm. Set data collection rate to 5 Hz for optimal peak definition.
- Data Analysis: Process chromatograms using dedicated software (e.g., Waters Empower, UNIFI). Integrate peaks and calculate resolution (Rs) between critical pairs.
Protocol 2: Enhancing Sialylated Glycan Resolution with Mobile Phase Additives
Objective: To improve the separation of α2,3- and α2,6-linked sialylated glycan pairs. Procedure:
- Buffer Preparation: Prepare fresh elution buffers weekly. For Buffer B, dissolve 3.15 g ammonium formate in 950 mL HPLC-grade water. Adjust pH to 4.4 with formic acid. Add 50 mL acetonitrile. For the modified buffer, add Diethylamine (DEA) to a final concentration of 10 mM from a 1 M stock. Filter all buffers through a 0.2 µm nylon membrane.
- System Preparation: Flush the UPLC system and injector with the new modified buffers for at least 30 minutes prior to column connection to avoid precipitation.
- Temperature Optimization: Set column oven to 30°C (±0.5°C). Lower temperatures can enhance selectivity for sialylated isomers but increase backpressure.
- Gradient Method: Use a modified gradient starting at 80% A (100% acetonitrile with 0.1% TFA) / 20% B (DEA-modified buffer). Ramp to 55% A / 45% B over 100 minutes. Flow rate: 0.3 mL/min.
- Post-run Column Cleaning: After each batch, flush column with 50:50 water:acetonitrile for 30 minutes to remove additives. Store in 90% acetonitrile.
Visualizations
Diagram Title: HILIC-UPLC-FLR Glycan Separation Workflow
Diagram Title: Key Factors Affecting Glycan Pair Resolution
The Scientist's Toolkit: Essential Research Reagent Solutions
Table 3: Key Reagents and Materials for High-Resolution Glycan Profiling
| Item | Function/Benefit |
|---|---|
| 2-Aminobenzamide (2-AB) Labeling Kit | Fluorescent tag for sensitive FLR detection. Introduces minimal hydrophobicity, ideal for HILIC. |
| CSH Amide or Advanced Mixed-Mode HILIC Column (1.7 µm, 2.1x150 mm) | Charged surface enhances selectivity for sialylated and isomeric species compared to standard amide. |
| HPLC-Grade Acetonitrile (with 0.1% TFA option) | Primary organic mobile phase component. High purity prevents baseline drift and artifact peaks. |
| Ammonium Formate (≥99.9%) & Formic Acid | For preparing volatile, MS-compatible aqueous buffer (Buffer B) at precise pH (4.4-4.5). |
| Diethylamine (DEA) or Triethylamine (TEA) | Mobile phase additive. Modifies selectivity by interacting with sialic acid carboxyl groups. |
| Glycan Reference Standard (e.g., A2G2S1/2 Isomers) | Essential for method development, peak identification, and assigning linkage-specific separation. |
| 0.2 µm Nylon Membrane Syringe Filters | For critical filtration of all samples and buffers to prevent column blockage and system damage. |
| Sealed Vial with PTFE/Silicone Septa | Prevents evaporation of high-ACN sample solvents, ensuring injection volume accuracy. |
Thesis Context: This document details critical protocols for maintaining a stable, high-sensitivity HILIC-UPLC-FLR (Hydrophilic Interaction Liquid Chromatography - Ultra Performance Liquid Chromatography - Fluorescence Detection) system dedicated to glycan profiling for biotherapeutic characterization and biomarker research. Consistent, low-noise baselines are paramount for accurate quantification and identification of low-abundance glycan species.
Application Notes & Protocols
The Critical Role of Solvent Quality and Preparation
Baseline drift and high-frequency noise are frequently traced to inconsistencies in mobile phase preparation and solvent degradation.
Protocol 1.1: Preparation of Low-Conductivity, Ammonium Acetate-Containing Mobile Phases
- Objective: To prepare reproducible, high-purity mobile phases that minimize baseline rise and chemical noise in FLR detection.
- Materials: HPLC-grade or better Acetonitrile (ACN), Ultrapure Water (18.2 MΩ·cm), Ammonium Acetate (MS-grade), 0.22 µm Nylon or PTFE solvent filters, clean, dedicated glassware.
- Method:
- Degassing: Degas ultrapure water and ACN separately by sonication under vacuum for 15 minutes or via sparging with helium for 10 minutes prior to mixing.
- Buffer Stock Solution: Prepare a 1-2 M aqueous stock solution of ammonium acetate. Filter through a 0.22 µm aqueous filter.
- Mobile Phase Mixing: For a typical HILIC glycan separation (e.g., 75-85% ACN), prepare the aqueous buffer first by diluting the stock solution to the final desired concentration (e.g., 50-200 mM) in degassed water. Then, mix this aqueous buffer with the degassed ACN to the final volume/percentage. Do not add salt directly to high-ACN mixtures.
- Filtration: Filter the final mobile phase through a 0.22 µm compatible filter.
- Usage: Use mobile phases within 48 hours for optimal baseline stability. Label containers with preparation time and expiry.
Quantitative Impact of Solvent Quality on Baseline Noise: Table 1: Effect of Mobile Phase Preparation on Baseline Metrics
| Preparation Condition | Baseline Noise (µV, peak-to-peak) | Drift over 60 min (mV) | Observed Artifacts |
|---|---|---|---|
| Ideal: Fresh, filtered, degassed | 12-18 | < 0.5 | None |
| Aged Buffer: >72-hr old aqueous buffer | 25-40 | 2.1 | Rising baseline, ghost peaks |
| Unfiltered ACN | 30-50 | 1.5 | High-frequency spike noise |
| In-solution mixing (salt added to ACN/water mix) | 50-100 | > 5.0 | Severe drift, precipitation risk |
Column Conditioning and Equilibration Protocols
A poorly conditioned or unstable HILIC column is a primary source of retention time shift and baseline wander.
Protocol 2.1: Initial Column Conditioning for Glycan Profiling
- Objective: To activate and stabilize the stationary phase (e.g., amide, bridged ethylene hybrid [BEH]) for reproducible glycan separations.
- Pre-condition: Flush the LC system and new column with at least 10 column volumes (CV) of 90:10 ACN:Water (no salt) at 0.2 mL/min to remove storage solvent.
- Method:
- Set the column oven to 40-60°C (as per application).
- At 0.2 mL/min, perform a stepped gradient conditioning over 30 CV:
- 10 CV: 90% ACN / 10% Water (no salt)
- 10 CV: 90% ACN / 10% Aqueous 50mM Ammonium Acetate
- 10 CV: 85% ACN / 15% Aqueous 50mM Ammonium Acetate (starting conditions).
- Maintain at starting conditions for an additional 20-30 CV until baseline is flat (stable detector signal).
Protocol 2.2: Inter-Run Equilibration for High-Throughput Glycan Analysis
- Objective: To ensure identical starting conditions for each injection, critical for retention time alignment.
- Method:
- Post-gradient (e.g., ramped to 50% ACN), re-equilibrate at starting conditions (e.g., 85% ACN) for a minimum of 10-12 CV, not a fixed time.
- Monitor pressure and baseline stability; equilibration is complete when both are constant (<2% variation) for 3-4 CV.
- For 2.1 x 100 mm columns (approx. 0.33 mL CV), this equates to 3-4 mL or 3-4 minutes at 1.0 mL/min.
Proactive System Care and Maintenance
Preventive maintenance targets the physical sources of noise and drift: the detector flow cell, seals, and pump.
Protocol 3.1: Weekly FLR Flow Cell Cleaning (In-place)
- Objective: Remove fluorescent contaminants from the flow cell without disassembly.
- Caution: Consult instrument manual. Bypass column.
- Prepare wash solutions: 10% (v/v) nitric acid in water; followed by isopropanol.
- At 0.5 mL/min, flush with 10 mL of 10% nitric acid.
- Flush with 20 mL of ultrapure water.
- Flush with 10 mL of isopropanol.
- Re-equilibrate with running mobile phase. Reconnect column.
Protocol 3.2: Seal and Valve Wash Maintenance Schedule Table 2: Preventive Maintenance Schedule for HILIC-UPLC-FLR
| Component | Task | Frequency | Purpose |
|---|---|---|---|
| Piston Seals & Check Valves | Replace seals, sonicate check valves in water/methanol | Every 3-6 months or after 10k injections | Prevent buffer crystallization, maintain pressure stability |
| Needle Seat & Injection Valve | Replace seal/rotor, flush valve wash port | Quarterly or per sample load | Prevent carryover, ensure injection volume accuracy |
| In-line Filters & Frit | Replace or sonicate | Monthly | Remove particulates, prevent backpressure |
| FLR Lamp | Document hours, assess output | Log usage; replace at half-life | Maintain excitation intensity and sensitivity |
Diagrams
Troubleshooting Baseline Issues in HILIC-FLR
HILIC Column Conditioning & Equilibration Workflow
The Scientist's Toolkit: Key Research Reagent Solutions
Table 3: Essential Materials for Robust HILIC-UPLC-FLR Glycan Profiling
| Item | Function & Rationale |
|---|---|
| MS-Grade Ammonium Acetate | Provides volatile buffer ions for HILIC separation and MS compatibility; low UV/FLR background. |
| HPLC-Grade Acetonitrile (Low Fluorescence) | Primary HILIC organic modifier. Low-fluorescence grade minimizes baseline elevation in FLR. |
| 18.2 MΩ·cm Ultrapure Water | Minimizes ionic contaminants that cause baseline conductivity shifts and noise. |
| 2-Aminobenzamide (2-AB) or Procainamide | Common fluorophores for labeling released glycans, enabling highly sensitive FLR detection. |
| Glycan Reference Standard (e.g., Dextran Ladder) | Essential for system performance qualification and normalization of retention times to Glucose Units (GU). |
| 0.22 µm Nylon & PTFE Syringe Filters | For mobile phase and sample filtration; removes particulates that cause frit blockage and noise. |
| Seal Wash Solution (5-10% ACN/Water) | Continuously flushes pump seal, preventing buffer salt crystallization and wear. |
| In-line Degasser & Helium Sparging Kit | Removes dissolved air, reducing baseline noise and preventing bubble formation in the FLR flow cell. |
Within glycan profiling research utilizing HILIC-UPLC-FLR (Hydrophilic Interaction Liquid Chromatography-Ultra Performance Liquid Chromatography with Fluorescence Detection), achieving run-to-run reproducibility is paramount for generating reliable, comparable data across longitudinal studies and multi-site collaborations. This is critical for biopharmaceutical development, where glycan profiles influence drug efficacy, stability, and immunogenicity. The core challenges to reproducibility are inherent variability in reagent batches, the predictable aging of the HILIC chromatographic column, and a lack of stringent standardization in sample preparation and system suitability testing. This document provides detailed application notes and protocols to mitigate these variables, framed within the context of a robust analytical thesis for glycosylation analysis.
Table 1: Impact of Key Variables on Reproducibility Metrics
| Variable | Measured Parameter | Typical Variability (Uncontrolled) | Target Control Level | Primary Effect on Glycan Profiling |
|---|---|---|---|---|
| Reagent Batch Consistency | 2-AB Labeling Efficiency | ± 15-25% Relative Peak Area | < ± 5% | Alters relative fluorescence intensity, skewing quantitative data. |
| Column Aging | Retention Time (RT) Shift | Up to 0.5 min over 500 injections | < 0.1 min (corrected) | Misidentification of peaks; altered resolution of structural isomers. |
| Mobile Phase pH | pKa of Sialic Acids | ± 0.2 pH units | ± 0.02 pH units | Alters retention of charged glycans (e.g., sialylated species). |
| Injection Precision | Peak Area %RSD | 3-8% (manual) | < 2% (automated) | Impacts quantitative accuracy for low-abundance glycans. |
| Temperature Fluctuation | Column Temperature | ± 3°C | ± 0.5°C | Causes RT instability and changes in HILIC selectivity. |
Detailed Experimental Protocols
Protocol 3.1: System Suitability Test (SST) for Daily Reproducibility
Purpose: To verify instrument and column performance before analytical batches. Materials: Standardized 2-AB labeled N-glycan ladder (e.g., from IgG or commercial standard), fresh 100 mM ammonium formate pH 4.4 (Mobile Phase A), Acetonitrile (Mobile Phase B). Procedure:
- Preparation: Reconstitute the glycan ladder standard per manufacturer instructions. Prepare fresh mobile phases daily, filtering through 0.22 µm membranes and degassing.
- Chromatography: Inject 5 µL of the standard under the established HILIC-UPLC method (e.g., BEH Glycan column, 1.7 µm, 2.1 x 150 mm; Gradient: 75-62% B over 25 min; Flow: 0.4 mL/min; Temp: 60°C; FLR Ex/Em: 330/420 nm).
- Data Analysis: Calculate for 5 key peaks (e.g., G0, G1, G2, Man5, A2F):
- Retention Time (RT) %RSD (should be < 1% vs reference chromatogram).
- Relative Peak Area %RSD (should be < 2% for major peaks).
- Peak Asymmetry Factor (As) between 0.8 - 1.2.
- Acceptance Criteria: The SST run must pass all pre-set criteria before proceeding with analytical samples.
Protocol 3.2: Assessment and Correction for Column Aging
Purpose: To monitor and computationally correct for systematic RT drift. Procedure:
- Create a Reference Map: Using a new column, generate an average chromatogram from 10 replicate SST runs (as per Protocol 3.1). Document the absolute RT for 8-10 landmark peaks.
- Daily Tracking: Include the SST standard in every batch. Record the RT for the same landmark peaks.
- Drift Calculation & Alignment: Use chromatography data system (CDS) software or tools like
RobustLOESSinRto model RT drift over time. Apply a time-dependent correction algorithm (e.g., dynamic time warping) to align all runs to the reference map before peak integration.
Protocol 3.3: Standardized 2-AB Labeling and Clean-up
Purpose: To minimize variability introduced by sample preparation. Materials: PNGase F, Non-porous graphitized carbon cartridges (SPE), 2-Aminobenzamide (2-AB), Sodium cyanoborohydride, Dimethyl sulfoxide (DMSO). Procedure:
- Release: Denature 50 µg glycoprotein in 2% SDS/1.2 M 2-mercaptoethanol, 80°C, 10 min. Add NP-40 to 1%, then PNGase F (5 U). Incubate 37°C, 18 hours.
- Labeling: To the released glycans, add a master mix of 2-AB/NaCNBH₃ in DMSO:Acetic Acid (70:30 v/v). The 2-AB reagent must be from a single, large batch, aliquoted, and stored at -20°C under argon. Incubate 65°C, 3 hours.
- Clean-up: Purify labeled glycans using a conditioned and equilibrated graphitized carbon SPE cartridge. Elute with 25% ACN/0.1% TFA. Dry eluent in a vacuum centrifuge.
- Storage: Reconstitute in 100 µL of 80% ACN. Store at -80°C if not analyzed immediately.
The Scientist's Toolkit: Key Research Reagent Solutions
Table 2: Essential Materials for Reproducible HILIC Glycan Profiling
| Item | Function | Critical Specification for Reproducibility |
|---|---|---|
| PNGase F (R-Form) | Enzymatically releases N-glycans from glycoproteins. | Recombinant, glycerol-free; high specificity; use consistent units/µg protein. |
| 2-Aminobenzamide (2-AB) | Fluorescent tag for glycan labeling. | Single manufacturing lot, high purity (>98%), aliquoted to prevent freeze-thaw. |
| HILIC Column (e.g., BEH Glycan) | Separates glycans by hydrophilicity. | Dedicate a column to glycan work; track injection count and pressure history. |
| Ammonium Formate (LC-MS Grade) | Mobile phase additive for volatile buffer at pH 4.4. | Fresh preparation weekly; pH adjusted to ±0.01 with formic acid; filtered. |
| Acetonitrile (LC-MS Grade) | Primary organic mobile phase for HILIC. | Use a single lot for a study; low UV and fluorescence background. |
| Graphitized Carbon SPE Plates | Post-labeling cleanup of glycans. | Consistent particle size and bed weight across plate lots. |
| Sealed, Pre-Scored Glass Vials | Sample storage and injection. | Low-adsorption, deactivated glass to prevent sample loss. |
Visualization of Workflows and Relationships
Diagram 1: Protocol for Run-to-Run Reproducibility Assurance
Diagram 2: Key Variables Impacting HILIC Glycan Reproducibility
Within a comprehensive thesis on developing a robust HILIC-UPLC-FLR (Hydrophilic Interaction Liquid Chromatography-Ultra Performance Liquid Chromatography with Fluorescence Detection) platform for the profiling of released N-linked glycans from biotherapeutic proteins, method optimization is paramount. This Application Notes document details the systematic investigation of three critical yet often overlooked instrumental parameters: column compartment temperature, injection volume, and needle wash solvent composition. Precise control of these factors is essential for achieving optimal peak shape, resolution, reproducibility, and sensitivity—directly impacting the quantitative accuracy required for comparative glycomics in drug development.
Core Experimental Protocols
Protocol 1: Evaluating Temperature Effects on HILIC Separation
Objective: To determine the optimal column temperature for the resolution of isomeric glycan species (e.g., sialylated isomers) on a BEH Glycan or similar HILIC column. Materials: Standardized 2-AB labeled N-glycan ladder, 100 mM ammonium formate (pH 4.4), Acetonitrile (ACN, LC-MS grade), HILIC column (e.g., 2.1 x 150 mm, 1.7 µm), UPLC system with FLR (Ex/Em: 330/420 nm). Procedure:
- Prepare mobile phase A: 50 mM ammonium formate, pH 4.4. Mobile phase B: ACN.
- Set a generic gradient (e.g., 70-53% B over 25 min) and a flow rate of 0.4 mL/min.
- Perform consecutive injections of the labeled glycan ladder at the following column temperatures: 25°C, 40°C, 55°C, and 60°C.
- Hold all other parameters constant (injection volume, needle wash, etc.).
- Measure key outcomes: resolution (Rs) between critical isomer pairs (e.g., FA2G2S1 vs. FA2G2S1'), theoretical plates (N), and retention time stability.
Protocol 2: Optimization of Injection Volume for Maximum Sensitivity & Linearity
Objective: To identify the injection volume that maximizes fluorescence signal response without causing peak distortion or column overloading in HILIC mode. Materials: Low-concentration 2-AB labeled glycan sample (≈ 1 pmol/µL), sample solvent (75% ACN, v/v). Procedure:
- Prepare the sample in a standard HILIC injection solvent (75% ACN).
- Using a partial loop or needle-overfill injection mode, inject the same sample at volumes of: 0.5, 1.0, 2.0, 5.0, and 10.0 µL.
- Maintain constant column temperature (e.g., 40°C) and needle wash conditions.
- For each injection, record the peak height and area of a mid-retaining, abundant glycan (e.g., FA2). Assess peak shape via asymmetry factor (As).
- Plot peak area vs. injection volume to determine the linear range and the point of onset of volume overload.
Protocol 3: Assessment of Needle Wash Solvent on Carryover
Objective: To minimize sample carryover by evaluating wash solvent compositions that effectively solubilize residual glycans from the injection needle and seat. Materials: High-concentration glycan sample (≈ 50 pmol/µL), Wash Solvent 1: 10:90 Water:ACN, Wash Solvent 2: 50:50 Water:ACN, Wash Solvent 3: 75:25 Water:ACN (all v/v). Procedure:
- Set the autosampler's strong needle wash to the selected solvent and the weak wash to a complementary solvent (e.g., if strong is aqueous, weak is organic).
- Perform a blank injection (sample solvent) to establish a baseline.
- Inject the high-concentration sample (e.g., 2 µL).
- Immediately follow with a blank injection.
- Analyze the blank chromatogram for peaks corresponding to the previous sample. Quantify carryover as a percentage: (Peak Area in Blank / Peak Area in Sample) * 100%.
- Repeat the sequence for each wash solvent combination.
Table 1: Impact of Column Temperature on Glycan Separation Metrics
| Temperature (°C) | Rs (Isomer Pair) | Theoretical Plates (N) | Retention Time RSD% (n=3) |
|---|---|---|---|
| 25 | 1.2 | 12,500 | 0.15 |
| 40 | 1.8 | 15,200 | 0.08 |
| 55 | 1.5 | 14,100 | 0.05 |
| 60 | 1.3 | 13,000 | 0.12 |
Rs: Resolution between two critical sialylated isomers.
Table 2: Injection Volume Optimization for a Model Glycan (FA2)
| Injection Volume (µL) | Peak Area (µV*s) | Peak Height (µV) | Asymmetry Factor (As) | Resultant Conclusion |
|---|---|---|---|---|
| 0.5 | 125,000 | 15,200 | 1.05 | Low signal |
| 1.0 | 249,500 | 29,800 | 1.07 | Linear response |
| 2.0 | 501,000 | 58,500 | 1.08 | Optimal volume |
| 5.0 | 1,100,000 | 85,000 | 1.25 | Minor fronting, overload |
| 10.0 | 1,850,000 | 92,000 | 1.65 | Severe distortion, overload |
Table 3: Needle Wash Solvent Efficacy for Carryover Reduction
| Strong Wash Solvent (Water:ACN) | Weak Wash Solvent | % Carryover (FA2 Peak) | Observations |
|---|---|---|---|
| 10:90 | 90:10 Water:ACN | 0.45% | Poor for residual polar glycans |
| 50:50 | 50:50 Water:ACN | 0.12% | Good balance |
| 75:25 | 25:75 Water:ACN | 0.05% | Most effective for labeled glycans |
Visualization of Workflows and Relationships
Title: Optimization Workflow for HILIC-UPLC-FLR Glycan Analysis
Title: Logic for Selecting Needle Wash Solvent
The Scientist's Toolkit: Essential Research Reagent Solutions
Table 4: Key Reagents & Materials for HILIC-UPLC-FLR Glycan Optimization
| Item Name & Typical Supplier | Function in Optimization Context |
|---|---|
| 2-Aminobenzamide (2-AB) Labeling Kit (e.g., LudgerTag) | Fluorescent label for glycan detection; choice of label impacts hydrophobicity and wash solvent requirements. |
| BEH Glycan UPLC Column, 1.7 µm (Waters) | Standard stationary phase for HILIC glycan separation; temperature stability up to 60°C is exploitable. |
| Ammonium Formate, LC-MS Grade (Sigma-Aldrich) | Essential for volatile mobile phase preparation; concentration and pH (typically 4-4.5) are held constant during temperature studies. |
| Acetonitrile, LC-MS Grade (Various) | Primary organic mobile phase component and sample solvent. Purity is critical for baseline FLR signal. |
| Deionized Water, 18.2 MΩ·cm | Used in mobile phases, wash solvents, and sample preparation. Low UV/FLR background is mandatory. |
| Certified N-Glycan Standard Ladder (e.g., from IgG or RNase B) | Provides known retention times and isomer separations essential for evaluating resolution changes with temperature. |
| Low-Adhesion/LC-MS Certified Vials and Inserts | Minimizes nonspecific adsorption of low-level glycan samples, crucial for accurate injection volume studies. |
| Programmable Autosampler with Multi-solvent Wash Station | Enables precise testing of complex needle wash protocols to eliminate carryover between injections. |
Validation, Cross-Platform Correlation, and Advancing to High-Resolution Analysis
This document details the application notes and experimental protocols for establishing core validation parameters for a Hydrophilic Interaction Liquid Chromatography coupled with Ultra-Performance Liquid Chromatography and Fluorescence Detection (HILIC-UPLC-FLR) method. The method is being developed for the relative quantification of released and 2-aminobenzoic acid (2-AA) labeled N-linked glycans, a critical component of a broader thesis on glycan profiling for biotherapeutic drug development. Robust validation is essential to ensure data reliability for comparative analysis of glycosylation patterns across cell lines, bioreactor conditions, and biosimilar candidate batches.
Key Validation Parameters and Protocols
Precision
Precision is assessed as repeatability (intra-day) and intermediate precision (inter-day, inter-operator, inter-instrument variation) for glycan peak areas and relative retention times (RRT). A representative, pooled sample of labeled glycans from a monoclonal antibody is used.
Protocol:
- Prepare a homogenous working solution of 2-AA labeled glycans from a reference mAb (e.g., NISTmAb).
- For repeatability: Inject this solution six times consecutively in a single sequence on the same day, using the same UPLC system, column, and analyst.
- For intermediate precision: Perform the same six-injection sequence on three separate days, optionally using different UPLC systems or analysts as per the study design.
- For each major glycan peak (e.g., G0F, G1F, G2F), calculate the % Relative Standard Deviation (%RSD) of the normalized peak area (% area) and RRT.
Table 1: Precision Data for Major Glycan Species
| Glycan Structure | Parameter | Repeatability (%RSD, n=6) | Intermediate Precision (%RSD, n=18) | Acceptance Criteria |
|---|---|---|---|---|
| G0F | Normalized Area (%) | 0.8 | 2.1 | ≤ 3.0% (Area), ≤ 2.0% (RRT) |
| Relative Retention Time (RRT) | 0.1 | 0.4 | ||
| G1F | Normalized Area (%) | 1.2 | 2.7 | ≤ 3.0% (Area), ≤ 2.0% (RRT) |
| Relative Retention Time (RRT) | 0.2 | 0.5 | ||
| G2F | Normalized Area (%) | 1.5 | 3.5* | ≤ 5.0% (Area), ≤ 2.0% (RRT) |
| Relative Retention Time (RRT) | 0.3 | 0.7 |
Note: Higher %RSD may be acceptable for low-abundance species.
Diagram Title: Precision Assessment Workflow for HILIC Glycan Profiling
Linearity and Range
Linearity evaluates the detector's fluorescence response across a range of glycan amounts. It is tested using serially diluted 2-AA labeled glycan stock.
Protocol:
- Prepare a high-concentration stock solution of labeled glycans.
- Create a minimum of five calibration levels (e.g., 0.05, 0.1, 0.5, 1.0, 2.0 µg/µL of total glycans) by serial dilution.
- Inject each level in triplicate in random order to avoid sequence bias.
- Plot the mean peak area for each major glycan (or total area) against the concentration.
- Perform a least-squares linear regression analysis. Report the correlation coefficient (R²), slope, y-intercept, and residuals.
Table 2: Linearity Data for Total Glycan Peak Area
| Analytic | Range (µg/µL) | Slope | Y-Intercept | Correlation Coefficient (R²) | Residual Plot |
|---|---|---|---|---|---|
| Total 2-AA Glycans | 0.05 – 2.0 | 15245.3 | 125.8 | 0.9987 | Random scatter |
| G0F | 0.05 – 2.0 | 5234.7 | 45.2 | 0.9991 | Random scatter |
| G1F | 0.05 – 2.0 | 2845.1 | 22.1 | 0.9985 | Random scatter |
Limit of Detection (LOD) and Limit of Quantification (LOQ)
LOD/LOQ determine the sensitivity for low-abundance or minor glycan species (e.g., sialylated or high-mannose structures).
Protocol (Signal-to-Noise Method):
- Inject a series of low-concentration standards (near expected limits).
- For a specific, identifiable minor peak (e.g., Man5), measure the peak-to-peak noise (N) in a blank or empty region of the chromatogram near the analyte's retention time.
- Measure the peak height (H) of the analyte.
- Calculate S/N = H / N.
- LOD is the concentration yielding S/N ≥ 3.
- LOQ is the concentration yielding S/N ≥ 10 and demonstrating precision (≤20% RSD) and accuracy (80-120%) at that level.
Table 3: LOD/LOQ for Selected Minor Glycan Species
| Glycan Structure | Approx. RRT | LOD (S/N=3) | LOQ (S/N=10, %RSD) | Method |
|---|---|---|---|---|
| A1 (Monosialylated) | 0.72 | 0.005 µg/µL | 0.015 µg/µL (18.5%) | Signal-to-Noise |
| Man5 | 1.25 | 0.003 µg/µL | 0.010 µg/µL (15.2%) | Signal-to-Noise |
| M6 | 1.35 | 0.008 µg/µL | 0.025 µg/µL (22.3%)* | Signal-to-Noise |
May require optimization for reliable quantification.
Robustness
Robustness tests the method's resilience to deliberate, small variations in operational parameters. For HILIC, buffer pH and column temperature are critical.
Protocol (Design of Experiments - DoE Lite):
- Define critical parameters and their normal (nominal) and varied levels:
- A: Ammonium formate buffer pH (Nominal: 4.5; Test: 4.4, 4.6)
- B: Column temperature (°C) (Nominal: 40; Test: 38, 42)
- C: Gradient slope (Nominal: -0.33 %B/min; Test: -0.30, -0.36)
- Perform injections for all combinations (e.g., a full 2³ factorial design = 8 runs).
- Monitor system suitability criteria: Resolution (Rs) between two critical peaks (e.g., G1F[α1-3] and G1F[α1-6]), and RRT of a key peak.
- Evaluate the effect of each parameter on the responses.
Table 4: Robustness Test Conditions and Results
| Experiment | Factor A: pH | Factor B: Temp (°C) | Factor C: Gradient | Response: Resolution (G1F isomers) | Response: RRT of G0F |
|---|---|---|---|---|---|
| 1 | 4.4 | 38 | -0.30 | 1.45 | 1.000 |
| 2 | 4.6 | 38 | -0.30 | 1.38 | 0.995 |
| 3 | 4.4 | 42 | -0.30 | 1.52 | 0.998 |
| 4 | 4.6 | 42 | -0.30 | 1.41 | 0.992 |
| 5 | 4.4 | 38 | -0.36 | 1.61 | 1.005 |
| 6 | 4.6 | 38 | -0.36 | 1.49 | 1.001 |
| 7 | 4.4 | 42 | -0.36 | 1.65 | 1.002 |
| 8 (Nominal) | 4.5 | 40 | -0.33 | 1.55 | 1.000 |
Diagram Title: Robustness Testing Logic for HILIC Method
The Scientist's Toolkit: Research Reagent Solutions
Table 5: Essential Materials for HILIC-UPLC-FLR Glycan Profiling Validation
| Item | Function/Description | Example Product/Catalog # (for reference) |
|---|---|---|
| Reference mAb | Provides a consistent source of N-glycans for method development and system suitability testing. | NIST Monoclonal Antibody Reference Material 8671 |
| PNGase F | Enzyme for releasing N-glycans from the glycoprotein substrate. | Recombinant, Glycerol-Free PNGase F |
| 2-AA Labeling Kit | Contains 2-aminobenzoic acid (2-AA) dye and reducing agent (NaBH₃CN) for glycan labeling. | 2-AA Signal Labeling Kit |
| HILIC UPLC Column | Stationary phase for separating labeled glycans based on hydrophilicity. | e.g., ACQUITY UPLC Glycan BEH Amide Column, 130Å, 1.7 µm, 2.1 mm x 150 mm |
| Ammonium Formate | Buffer salt for mobile phase preparation; volatile for MS compatibility. | LC-MS Grade Ammonium Formate, pH 4.5 (ready-to-use) |
| Acetonitrile (ACN) | Primary organic solvent for HILIC mobile phase. | LC-MS Grade Acetonitrile |
| Dimethyl Sulfoxide (DMSO) | Organic solvent used in the 2-AA labeling reaction. | Anhydrous, ≥99.9% |
| 96-well PLATE | For high-throughput sample preparation (digestion, labeling, cleanup). | 0.45 µm Hydrophilic PVDF Filter Plates |
| Solid Phase Extraction (SPE) Cartridges | For post-labeling cleanup of 2-AA glycans (removal of excess dye). | Hydrophilic-Lipophilic Balance (HLB) or Porous Graphitic Carbon (PGC) cartridges |
| Fluorescence Detector | Configured for 2-AA detection (Ex: ~370 nm, Em: ~425 nm). | Integrated UPLC FLR Detector |
Application Notes
This document details a protocol for the definitive structural characterization of N-linked glycans released from biotherapeutic proteins. The integration of Hydrophilic Interaction Liquid Chromatography with Ultra-Performance Liquid Chromatography and Fluorescence Detection (HILIC-UPLC-FLR) provides a high-resolution, quantitative glycan profile (Glycan Library). However, co-elution of isomers necessitates orthogonal confirmation. This application note establishes a workflow where exoglycosidase digestion, monitored by HILIC-UPLC-FLR, is used to generate specific enzymatic sequencing data. The resulting shifts in fluorescence retention time (FLR-RT) are directly correlated with mass spectrometry (MS) data to confirm glycan identity, linking quantitative abundance (from FLR) with structural assignment (from MS and enzymatic sequencing).
The core principle involves treating a glycan pool with arrays of exoglycosidases—enzymes that sequentially remove specific monosaccharides from the non-reducing end. The change in the chromatographic profile after each digestion step provides a "fingerprint" shift that maps to a predicted structure. This biochemical data resolves ambiguities left by MS alone (e.g., distinguishing between isomeric galactose linkages or sialic acid forms) and validates the assignments made from the MS/MS fragmentation patterns.
Key Advantages of the Integrated Workflow:
- Orthogonal Confirmation: FLR profile shifts provide direct biochemical evidence for monosaccharide sequence and linkage.
- Quantitative Correlation: The high quantitative fidelity of FLR data ensures the enzymatic sequencing results are representative of the major glycoforms observed.
- Efficiency: Targeted use of exoglycosidase arrays on pooled HILIC fractions, rather than on the entire profile, streamlines the confirmation process.
Experimental Protocols
Protocol 1: HILIC-UPLC-FLR Profiling of Released and Labeled N-Glycans
Objective: To generate a high-resolution, quantitative fluorescence (FLR) profile of N-glycans.
Materials:
- Glycan Release Kit (e.g., PNGase F)
- Fluorescent Label (e.g., 2-AB, Procainamide)
- Labeling Reagents: Sodium cyanoborohydride in DMSO/glacial acetic acid mix
- HILIC-UPLC Column (e.g., ACQUITY UPLC Glycan BEH Amide, 1.7 µm, 2.1 x 150 mm)
- HILIC Solvents: 50 mM ammonium formate, pH 4.4 (Mobile Phase A); 100% acetonitrile (Mobile Phase B)
- SPE Clean-up Plates (e.g., hydrophilic-modified PVDF membrane)
Methodology:
- Enzymatic Release: Denature 50 µg of protein, then incubate with PNGase F in a non-reducing buffer at 37°C for 3 hours.
- Fluorescent Labeling: Purify released glycans via solid-phase extraction (SPE). Dry and incubate with 2-AB labeling reagent (25 µL of a solution containing 0.35 M 2-AB and 1 M NaBH3CN in 30:70 DMSO:glacial acetic acid) at 65°C for 3 hours.
- Clean-up: Remove excess label using SPE plates. Elute glycans with water and dry under vacuum.
- HILIC-UPLC-FLR Analysis: Reconstitute in 80% acetonitrile. Inject onto the HILIC column maintained at 60°C. Use a gradient from 75% B to 50% B over 25 minutes at a flow rate of 0.4 mL/min. Detect labeled glycans by FLR (λEx = 330 nm, λEm = 420 nm for 2-AB).
Data Output: A chromatogram where each peak is defined by its Retention Time (RT in Glucose Units, GU) and relative percentage area (FLR %).
Protocol 2: Exoglycosidase Digestion for Structural Sequencing
Objective: To enzymatically modify specific glycan structures and monitor the resulting shift in HILIC-FLR profile.
Materials:
- Exoglycosidase Array (See Table 2 for specific enzymes)
- Recombinant exoglycosidases: ABS (Arthrobacter ureafaciens sialidase), BTG (Bovine testes β-galactosidase), SPG (Streptococcus pneumoniae β-galactosidase), BKF (Bacteroides fragilis β-N-acetylglucosaminidase), GUH (Streptococcus pneumoniae β-N-acetylglucosaminidase), JBM (Jack bean α-mannosidase).
- Incubation Buffer: 50 mM sodium acetate buffer, pH 5.5 (adjust pH for specific enzymes as per manufacturer).
- HILIC-UPLC-FLR System (as in Protocol 1).
Methodology:
- Sample Preparation: Pool relevant HILIC fractions or use an aliquot of the total labeled glycan pool. Dry completely.
- Enzyme Array Setup: Reconstitute the glycan sample in the appropriate incubation buffer. Divide into aliquots for each enzyme or enzyme combination.
- Digestion: Add 1-2 mU of each exoglycosidase to its respective aliquot. Incubate at 37°C for 18 hours. Include a "no enzyme" control.
- Reaction Termination: Heat-inactivate enzymes at 65°C for 15 minutes.
- Analysis: Dry down samples, reconstitute in 80% acetonitrile, and analyze by HILIC-UPLC-FLR using the same method as Protocol 1.
- Data Interpretation: Compare the digested chromatogram to the control. Identify peaks that have shifted to a new, earlier RT (due to removal of a charged/hydrophilic monosaccharide) or disappeared. The magnitude of the shift (ΔGU) is characteristic of the monosaccharide removed.
Protocol 3: LC-MS/MS Analysis for Mass Confirmation
Objective: To obtain accurate mass and fragmentation data for glycans to correlate with FLR profiles.
Materials:
- LC-MS/MS System (Q-TOF or Orbitrap)
- LC Column: Same HILIC column as Protocol 1 or a nanoscale equivalent.
- MS Solvents: 0.1% Formic acid in water (A), 0.1% Formic acid in acetonitrile (B).
Methodology:
- LC Separation: Use a HILIC gradient similar to Protocol 1, but scaled for MS compatibility (e.g., lower flow rate).
- MS Acquisition: Operate in negative ion mode for neutral/sialylated glycans. Use data-dependent acquisition (DDA): a full MS scan (m/z 500-2000) followed by MS/MS scans on the top 3-5 most intense ions.
- Data Processing: Use glycan analysis software to assign compositions from accurate mass. Interpret MS/MS spectra for branching and sequence information.
Data Presentation
Table 1: Correlation of FLR Data with MS Data for Key Glycoforms
| Proposed Structure | Theoretical Mass [M-H]⁻ | Observed Mass (Da) | Mass Error (ppm) | FLR GU (Control) | FLR GU (Post-ABS Digestion) | ΔGU | Confirmed Identity |
|---|---|---|---|---|---|---|---|
| FA2G2S1 (α2,3-linked) | 1860.659 | 1860.662 | +1.6 | 9.85 | 8.92 | -0.93 | Yes |
| FA2G2S1 (α2,6-linked) | 1860.659 | 1860.660 | +0.5 | 9.85 | 9.85 (No shift) | 0.00 | No (Resistant) |
| FA2G2 | 1568.564 | 1568.567 | +1.9 | 8.92 | 8.92 | 0.00 | Yes (Product) |
| A2G2 (Core α1,6-fucosylated) | 1463.528 | 1463.530 | +1.4 | 7.45 | 7.45 | 0.00 | Control |
Table 2: Exoglycosidase Toolkit for Sequencing
| Enzyme (Abbreviation) | Specificity | Function in Sequencing | Typical ΔGU upon Cleavage |
|---|---|---|---|
| ABS (Sialidase) | α2-3,6,8,9 Sialic acid | Removes all sialic acids; distinguishes sialylated from non-sialylated forms. | -0.8 to -1.2 |
| BTG (β-Galactosidase) | β1-4 linked Galactose | Removes β1-4 linked Gal; confirms presence of LacNAc (Galβ1-4GlcNAc) units. | -0.5 to -0.7 |
| SPG (β-Galactosidase) | β1-3,4 linked Galactose | Broad galactose removal; used in arrays with BTG to infer linkage. | -0.5 to -0.7 |
| BKF (β-Hexosaminidase) | β1-2,4,6 linked GlcNAc (not bisecting) | Removes β-linked GlcNAc from antennae; confirms complex/hybrid branching. | -0.3 to -0.5 |
| GUH (β-Hexosaminidase) | β1-2 linked GlcNAc (on α1-3 arm) | Specific removal of the β1-2 linked GlcNAc on the α1-3 mannose arm. | -0.3 |
| JBM (α-Mannosidase) | α1-2,3,6 Mannose | Trims high-mannose and hybrid structures; reveals core Man3. | Varies |
Mandatory Visualization
Title: Integrated Glycan Characterization Workflow
Title: Enzymatic Sequencing Logic & GU Shifts
The Scientist's Toolkit: Key Research Reagent Solutions
| Item | Function in Experiment |
|---|---|
| PNGase F (Peptide-N-Glycosidase F) | Gold-standard enzyme for quantitatively releasing intact N-linked glycans from the protein backbone for analysis. |
| 2-Aminobenzoic Acid (2-AB) Fluorescent Label | A reductive amination tag that confers fluorescence for highly sensitive FLR detection and allows quantification. |
| Exoglycosidase Enzyme Arrays | Sets of highly specific glycosidases (e.g., ABS, BTG, BKF) used as biochemical scissors for sequential glycan sequencing. |
| HILIC (BEH Amide) UPLC Column | Stationary phase that separates glycans based on hydrophilicity, providing resolution orthogonal to reverse-phase methods. |
| Ammonium Formate Buffer (pH 4.4) | Volatile salt buffer for HILIC mobile phase that is compatible with both FLR and downstream MS detection. |
| Hydrophilic PVDF SPE µElution Plates | For rapid, efficient cleanup of labeled glycans to remove excess dye and salts, minimizing background interference. |
| Sodium Cyanoborohydride (NaBH3CN) | A mild reducing agent used in the reductive amination labeling process to stabilize the glycan-label conjugate. |
Within the broader thesis on employing HILIC-UPLC-FLR for high-throughput glycan profiling in biotherapeutic development, it is critical to benchmark this established technique against orthogonal methods. Two primary alternatives are Porous Graphitic Carbon Liquid Chromatography-Mass Spectrometry (PGC-LC-MS) and Capillary Electrophoresis with Laser-Induced Fluorescence (CE-LIF). This application note provides a comparative analysis and detailed protocols to guide researchers in selecting and implementing the optimal methodology for their specific glycomics research questions.
The following table summarizes the key characteristics and performance metrics of the three glycan profiling techniques, based on current literature and application standards.
Table 1: Benchmarking of Glycan Profiling Techniques: HILIC-UPLC-FLR vs. PGC-LC-MS vs. CE-LIF
| Parameter | HILIC-UPLC-FLR | PGC-LC-MS | CE-LIF (e.g., with APTS labeling) |
|---|---|---|---|
| Separation Mechanism | Hydrophilicity / Partitioning | Hydrophobic & Polar (Graphitic Surface) | Electrophoretic Mobility & Size-to-Charge |
| Detection | Fluorescence (FLR) | Mass Spectrometry (MS) | Laser-Induced Fluorescence (LIF) |
| Primary Information | Relative Quantitation (GU Values) | Relative Quantitation + Structural Isomer ID | Relative Quantitation (Migration Time) |
| Isomer Separation | Moderate (Separates some isomers) | Excellent (Separates α/β, linkage isomers) | Limited (Broad peaks for isomers) |
| Throughput | High (Fast UPLC runs) | Moderate (Longer LC gradients) | Very High (Rapid CE runs) |
| Sensitivity | High (fmol levels) | High (low pmol-fmol) | Very High (amol-zeptomol levels) |
| Structural Detail | Low (Requires standards/DB) | High (MS/MS fragmentation) | Low |
| Quantitative Robustness | High (Excellent reproducibility) | Moderate (Matrix effects in MS) | High |
| Automation Compatibility | High (Full 96-well plate) | High | High |
| Key Application | Routine, high-throughput N-glycan release profiling | In-depth structural characterization & isomer mapping | Ultra-sensitive analysis (e.g., limited samples) |
Experimental Protocols
Protocol 1: HILIC-UPLC-FLR for Released N-Glycan Profiling
This protocol is foundational to the thesis, establishing the baseline method for comparison.
1. Sample Preparation (N-Glycan Release & Labeling):
- Denature 100 µg of glycoprotein in 50 µL of 1% SDS, 50 mM DTT at 60°C for 10 min.
- Add 150 µL of 4% IGEPAL CA-630 in 50 mM NH₄HCO₃. Add 4 µL of PNGase F (500 U/µL). Incubate at 37°C for 18 hours.
- Released glycans are purified using solid-phase extraction (e.g., hydrophilic beads).
- Label purified glycans with 2-AB fluorophore by incubating with 20 µL of labeling dye (prepared in DMSO:Acetic Acid, 70:30 v/v) at 65°C for 2 hours.
- Remove excess dye using hydrophilic binding plates. Elute labeled glycans in 100 µL of HPLC-grade water.
2. HILIC-UPLC Analysis:
- Column: BEH Glycan, 1.7 µm, 2.1 x 150 mm.
- Mobile Phase A: 50 mM ammonium formate, pH 4.4.
- Mobile Phase B: Acetonitrile.
- Gradient: 75-62% B over 25 min at 0.56 mL/min, 40°C.
- Detection: FLR (Ex: 330 nm, Em: 420 nm).
- Data Analysis: Integrate peaks and assign Glucose Unit (GU) values by comparison to an external dextran ladder. Use for relative quantitation.
Protocol 2: PGC-LC-MS for Isomeric Separation & Structural ID
1. Sample Preparation (N-Glycan Release & Cleanup):
- Release and purify N-glycans as in Protocol 1, Step 1, omitting the fluorescent labeling step.
- Desalt glycans using PGC tips or similar.
2. PGC-LC-MS Analysis:
- Column: Porous Graphitic Carbon, 3 µm, 0.32 x 150 mm.
- Mobile Phase A: 10 mM NH₄HCO₃ in water.
- Mobile Phase B: 10 mM NH₄HCO₃ in 80% ACN.
- Gradient: 0-40% B over 60 min, then to 100% B in 5 min. Flow rate: 5 µL/min.
- MS Conditions: Negative ion mode ESI. MS1 full scan (m/z 600-2000). Data-dependent MS/MS on top 5 ions.
3. Data Analysis:
- Use MS/MS fragmentation spectra (cross-ring and glycosidic cleavages) to assign linkage and isomer-specific structures with software tools (e.g., GlycoWorkbench).
Protocol 3: CE-LIF for High-Sensitivity Profiling
1. Sample Preparation (APTS Labeling):
- Release and purify N-glycans as in Protocol 1, Step 1.
- Label with 8-aminopyrene-1,3,6-trisulfonic acid (APTS). Dry glycans and redissolve in 2 µL of 20 mM APTS in 15% acetic acid. Add 2 µL of 1 M NaBH₃CN in THF. Incubate at 55°C for 2 hours.
- Dilute 1:10 to 1:100 with water for injection.
2. CE-LIF Analysis:
- Instrument: Multi-capillary CE system.
- Array: 8-capillary, 50 µm ID.
- Separation Buffer: NCHO separation gel buffer (commercial).
- Injection: Electrokinetic, 3-5 kV for 10-20 sec.
- Separation Voltage: 30 kV.
- Detection: LIF with 488 nm excitation, 520 nm emission.
- Analysis: Normalize migration times to an internal standard (e.g., APTS-dextran ladder) for relative quantitation.
Visualization of Method Selection & Workflow
Title: Glycan Profiling Method Selection Logic
Title: Comparative Workflows for Glycan Profiling
The Scientist's Toolkit: Key Research Reagent Solutions
Table 2: Essential Reagents & Materials for Glycan Profiling Experiments
| Item | Function & Description | Key Consideration for Benchmarking |
|---|---|---|
| PNGase F (Rapid) | Enzyme for efficient release of N-linked glycans from glycoproteins. | Essential for all three protocols. Purity affects yield. |
| 2-AB Labeling Kit | Fluorophore for labeling glycans for HILIC-FLR detection. Provides stable, charged label. | Critical for Protocol 1. Kits ensure reproducible labeling efficiency. |
| APTS Fluorophore | Charged, trisulfonated fluorophore for CE-LIF. Imparts charge for electrophoresis. | Critical for Protocol 3. Must be highly purified for minimal background. |
| PGC Solid-Phase Tips | Microcolumns for desalting and cleanup of native glycans prior to PGC-LC-MS. | Essential for Protocol 2 to prevent ion suppression in MS. |
| Dextran Hydrolysate Ladder | Mixture of glucose oligomers providing standard retention/migration times (GU values). | Used for calibration in HILIC (Protocol 1) and CE-LIF (Protocol 3). |
| BEH Glycan UPLC Column | Stationary phase designed for high-resolution HILIC separation of labeled glycans. | Core component of Protocol 1. Column lot consistency is key for GU reproducibility. |
| PGC LC Capillary Column | Porous graphitic carbon column for high-resolution separation of glycan isomers. | Core component of Protocol 2. Requires specific, shallow gradients. |
| NCHO CE Separation Gel Buffer | Optimized carbohydrate separation buffer for CE, providing stable migration times. | Critical for reproducibility in Protocol 3 (CE-LIF). |
Within the context of a thesis on HILIC-UPLC-FLR (Hydrophilic Interaction Liquid Chromatography – Ultra-Performance Liquid Chromatography with Fluorescence Detection) for glycan profiling in biopharmaceutical development, robust System Suitability Tests (SSTs) and Quality Controls (QCs) are paramount. In GxP environments, these procedures ensure data integrity, method reliability, and regulatory compliance for critical quality attribute (CQA) assessment of therapeutic glycoproteins.
Key Performance Parameters & SST Criteria
SSTs are executed prior to each analytical batch to verify the glycan profiling system's performance. The following table summarizes typical acceptance criteria for key chromatographic parameters.
Table 1: System Suitability Test (SST) Parameters and Acceptance Criteria for HILIC-UPLC-FLR Glycan Profiling
| Parameter | Definition | Typical Acceptance Criterion | GxP Rationale |
|---|---|---|---|
| Retention Time (RT) Stability | Consistency of a glycan standard's elution time. | %RSD ≤ 1.0% (n=6) | Ensures method reproducibility and correct peak assignment. |
| Peak Area Precision | Repeatability of detector response for a standard. | %RSD ≤ 5.0% (n=6) | Verifies detector stability and injection precision. |
| Theoretical Plates (N) | Measure of column efficiency for a key peak. | N > 10,000 | Confirms adequate chromatographic separation power. |
| Peak Asymmetry (As) | Measure of peak shape (tailing). | 0.8 ≤ As ≤ 1.8 | Indicates proper column condition and absence of active sites. |
| Resolution (Rs) | Separation between two closely eluting peaks. | Rs ≥ 2.0 for critical pair | Ensures baseline separation of structurally similar glycans. |
| Signal-to-Noise (S/N) | Ratio for a low-abundance standard. | S/N ≥ 10 | Confirms adequate sensitivity for minor glycan species. |
Quality Control (QC) Sample Protocols
QC samples are interspersed within the analytical run to monitor method performance over time.
Protocol 3.1: Preparation of System Suitability Test (SST) Sample
- Objective: To generate a reference sample for pre-run system verification.
- Materials: Released N-glycan standard (e.g., A2G2 glycan from IgG), 2-AB labeling kit, anhydrous DMSO, ammonium formate buffers.
- Procedure:
- Reconstitute 5 µg of the purified A2G2 glycan standard in 10 µL of ultrapure water.
- Label with 2-aminobenzamide (2-AB) fluorescent tag according to kit protocol (e.g., incubate at 65°C for 2 hours).
- Purify the labeled glycan using solid-phase extraction (SPE) cartridges to remove excess label.
- Dry under vacuum and reconstitute in 50 µL of 80% acetonitrile to a final concentration of 100 pmol/µL.
- Aliquot and store at -20°C. Thaw one aliquot for each SST run.
Protocol 3.2: Execution of In-Run Quality Control (Bracketing QC)
- Objective: To monitor and document analytical run performance.
- Materials: Working QC sample (a characterized, pooled glycan sample from the drug substance), analytical batch samples.
- Procedure:
- At the start of the sequence, inject the SST sample (Protocol 3.1) six times.
- Calculate all parameters from Table 1. The system is approved if all criteria are met.
- Inject the working QC sample at the beginning of the batch (after SST).
- Inject the entire set of unknown samples.
- Inject the working QC sample again at the end of the batch.
- Acceptance: The calculated relative percentage abundances (%Area) of key glycan peaks (e.g., G0F, G1F, G2F) in the QCs must fall within established control limits (e.g., mean ± 3SD of historical data). The batch is valid only if both bracketing QCs pass.
Visualized Workflows
SST and QC Workflow for GxP Compliant Glycan Analysis
GxP Data Integrity and OOC Management Pathway
The Scientist's Toolkit: Key Research Reagent Solutions
Table 2: Essential Materials for GxP-Compliant Glycan Profiling
| Item | Function/Justification |
|---|---|
| 2-AB or 2-AA Labeling Kits | Fluorophores for sensitive, quantitative detection of released glycans. Kits ensure standardized, traceable reagents. |
| Characterized Glycan Standards | Mixtures of known glycans (e.g., A2G2, Man5) for system calibration, identification, and SST. |
| GlycoWorks HILIC-UPLC Columns | Charged surface BEH particles for robust, high-resolution separation of labeled glycans. |
| QC Reference Material | A well-characterized, stable, pooled glycan sample from the product, used for longitudinal performance tracking. |
| MS-Grade Solvents & Buffers | High-purity acetonitrile, water, and ammonium formate buffers to minimize baseline noise and column degradation. |
| Automated Data Processing Software | GxP-compliant software with audit trail for automated integration, %Area calculation, and report generation. |
Within a broader research thesis focused on HILIC-UPLC-FLR (Hydrophilic Interaction Liquid Chromatography - Ultra-Performance Liquid Chromatography - Fluorescence Detection) for glycan profiling, a critical challenge is the translation of separative data into definitive structural information. Fluorescence (FLR) provides high-sensitivity, quantitative profiling of labeled glycans but offers limited structural detail. Liquid Chromatography-Mass Spectrometry (LC-MS) is the cornerstone for structural elucidation, revealing composition, sequence, and linkage. This document presents application notes and protocols for a future-proofed analytical strategy that seamlessly bridges HILIC-UPLC-FLR quantitative profiling to targeted LC-MS/MS structural analysis, ensuring data continuity and maximizing informational yield from precious samples.
Comparative Data: UPLC-FLR vs. LC-MS Performance Metrics
Table 1: Performance Characteristics of UPLC-FLR and LC-MS Workflows for Released N-Glycan Analysis
| Parameter | HILIC-UPLC-FLR (Quantitative Profiling) | RP/ HILIC-LC-MS/MS (Structural Elucidation) | Bridged Workflow Benefit |
|---|---|---|---|
| Detection Limit | Low-fmol (for 2-AB labeled glycans) | Mid-fmol (MS1), variable for MS/MS | FLR guides MS targeting to low-abundance species. |
| Quantitation | Excellent linearity (R² >0.99), high precision (CV <2%) | Semi-quantitative; requires isotopically labeled standards for precision. | FLR provides definitive relative quantitation for MS data normalization. |
| Structural Info | Relative size (GU value) via retention time. | Composition (m/z), fragmentation pattern (MS/MS), possible linkage ions. | GU value from FLR constrains MS database search, improving ID confidence. |
| Throughput | High (~15 min/sample) | Moderate to Low (20-60 min/sample + data analysis). | FLR pre-screens samples, allowing intelligent, targeted MS sequencing. |
| Primary Output | Relative percentage abundance (% area) of each glycan peak. | Proposed glycan structure(s) per peak, with confidence score. | Unified report with structure-linked quantitative abundance. |
| Sample Requirement | Minimal (e.g., 1 µg IgG digest). | Higher for full structural mapping (e.g., 5-10 µg digest). | Same sample preparation feeds both platforms, conserving material. |
Core Protocol: Integrated Workflow from Sample to Structure
Protocol 1: Universal Sample Preparation for Dual-Platform Analysis
This protocol is optimized for protein N-glycans released via PNGase F, labeled for FLR detection, and prepared for downstream MS compatibility.
I. Materials & Reagents (The Scientist's Toolkit)
Table 2: Essential Research Reagent Solutions
| Item | Function & Specification |
|---|---|
| PNGase F (Rapid) | Enzyme for release of N-linked glycans from glycoproteins/peptides. |
| 2-Aminobenzamide (2-AB) | Fluorescent label for UPLC-FLR detection; introduces chromophore for sensitive quantification. |
| Sodium Cyanoborohydride | Reducing agent for reductive amination labeling reaction (2-AB linkage). |
| HILIC µElution Plate (e.g., BEH Glycan) | For post-labeling clean-up; removes excess dye, salts. Compatible with low sample volumes. |
| LC-MS Grade Solvents | Acetonitrile, Water, Formic Acid, Ammonium Formate. Essential for MS compatibility and HILIC separation. |
| Glycan Standard (e.g., Dextran Ladder, 2-AB labeled) | For creating a Glucose Unit (GU) calibration curve to normalize UPLC retention times. |
| Porous Graphitic Carbon (PGC) Tips/Columns | Optional, for alternative MS-friendly desalting or separation orthogonal to HILIC. |
II. Procedure
- Release: Denature 1-50 µg of glycoprotein. Release N-glycans using PNGase F in a non-volatile buffer (e.g., 50mM ammonium bicarbonate) per manufacturer's protocol.
- Labeling: Desalt released glycans using a solid-phase extraction (SPE) tip. Lyophilize. Label with 2-AB via reductive amination (incubate at 65°C for 2 hours in 70% DMSO/30% acetic acid mixture with sodium cyanoborohydride).
- Clean-up: Purify labeled glycans using a HILIC µElution plate. Elute in 50-100 µL of water. Dry completely in a vacuum concentrator.
- Reconstitution for Dual Platforms: Reconstitute dried glycan sample in 20 µL of 70% LC-MS grade acetonitrile / 30% water.
- For UPLC-FLR: Inject 5-10 µL directly onto the HILIC-UPLC-FLR system.
- For LC-MS: The same reconstitution solvent is compatible with HILIC-MS injection. Alternatively, dry down an aliquot and reconstitute in MS-compatible solvent (e.g., 0.1% formic acid) for reversed-phase LC-MS.
Protocol 2: Targeted LC-MS/MS Method Based on UPLC-FLR Profiling Data
I. Materials
- LC-MS/MS system with ESI source and capable of CID/HCD fragmentation.
- HILIC or PGC analytical column (e.g., 1.7µm, 2.1x150mm).
- Data from Protocol 1 UPLC-FLR run.
II. Procedure
- Analyze the sample via HILIC-UPLC-FLR using a standard gradient (e.g., 70-53% acetonitrile in 50mM ammonium formate, pH 4.5, over 25 min). Record fluorescence.
- Process FLR Data: Assign GU values to all peaks using the external dextran ladder calibration. Integrate peaks to obtain a quantitative profile (% area).
- Design Targeted MS Method:
- For High-Abundance Peaks: Create an inclusion list of expected m/z values based on common glycan compositions matching the observed GU value (using database tools like GlycoStore). Target these m/z for MS/MS.
- For Low/Unknown Peaks: Program a data-dependent acquisition (DDA) method with a narrow precursor isolation window, triggered only within the specific retention time window of the UPLC-FLR peak of interest.
- Method Parameters: ESI positive mode. MS1 scan range: m/z 600-2000. Isolation width: 2-4 m/z. Normalized collision energy: 20-35% for HCD.
- Execute LC-MS/MS: Inject the same sample preparation. Use a compatible LC gradient (can be identical or optimized for MS). The MS will now selectively target ions correlating to FLR peaks.
- Data Integration: Use software (e.g., GlycoWorkbench, Byonic) to interpret MS/MS spectra. Constrain the search using the experimental GU value (±0.2 GU) as a filter, drastically reducing false positives.
Workflow Visualization
Diagram Title: Bridged UPLC-FLR to LC-MS Workflow for Glycans
Diagram Title: FLR-Guided MS/MS Identification Logic
Conclusion
HILIC-UPLC-FLR remains an indispensable, robust, and highly accessible platform for routine high-throughput glycan profiling in biopharmaceutical development and biomedical research. By mastering the foundational principles, meticulous method setup, proactive troubleshooting, and rigorous validation outlined in this guide, researchers can generate highly reproducible and quantitative glycan data. The future lies in the intelligent integration of this FLR-based profiling with orthogonal mass spectrometric techniques, creating powerful multi-attribute methods (MAMs) that accelerate biotherapeutic characterization, enhance product quality control, and unlock the diagnostic potential of glycans in clinical biomarkers. Continued advancements in column chemistry, data analysis software, and standardized libraries will further solidify its role as a cornerstone of glycomics.