Mastering CLR and ALR Transformations: A Data Science Guide for Compositional Glycomics Analysis
This article provides a comprehensive guide for glycomics researchers on the application of Centered Log-Ratio (CLR) and Additive Log-Ratio (ALR) transformations to compositional glycan data.
Mastering CLR and ALR Transformations: A Data Science Guide for Compositional Glycomics Analysis
Abstract
This article provides a comprehensive guide for glycomics researchers on the application of Centered Log-Ratio (CLR) and Additive Log-Ratio (ALR) transformations to compositional glycan data. It covers the foundational principles of compositional data analysis (CoDA) specific to glycobiology, detailed methodological workflows for implementing transformations in R/Python, practical troubleshooting for common data issues like zeros and sparsity, and comparative validation against traditional statistical methods. The guide is tailored to empower scientists in drug development and biomedical research to extract robust, biologically meaningful insights from relative abundance glycomics datasets, ultimately advancing biomarker discovery and therapeutic target identification.
The CoDA Challenge in Glycomics: Why Raw Abundance Data Misleads and How CLR/ALR Fix It
The Compositional Nature of Glycomics Data
Glycan profiling data, such as that obtained from mass spectrometry (MS) or high-performance liquid chromatography (HPLC), is inherently compositional. The total signal (e.g., total ion current) is arbitrary and depends on instrument settings and sample loading. Reported abundances are therefore relative, not absolute. The data exists in a constrained simplex space where each sample vector sums to a constant (e.g., 100%, 1, or 1e6), making its parts co-dependent. This constant-sum constraint violates the assumptions of standard Euclidean statistical methods, leading to spurious correlations and erroneous conclusions if not properly addressed.
Table 1: Example of Compositional Glycan Profile Data
| Sample ID | Relative Abundance (%) of Glycan Structures | Total Sum | ||||
|---|---|---|---|---|---|---|
| G1 | G2 | G3 | G4 | |||
| Control-1 | 34.2 | 25.1 | 28.9 | 11.8 | 100.0 | |
| Control-2 | 33.8 | 26.0 | 27.5 | 12.7 | 100.0 | |
| Disease-1 | 15.4 | 40.2 | 32.1 | 12.3 | 100.0 | |
| Disease-2 | 14.9 | 41.5 | 31.0 | 12.6 | 100.0 |
Core Mathematical Transformations for Compositional Data
The standard approach for valid statistical analysis of compositional data involves log-ratio transformations. Within glycomics research, two transformations are pivotal for preparing data for downstream multivariate analysis, hypothesis testing, and machine learning.
Centered Log-Ratio (CLR) Transformation
The CLR transforms compositions from the simplex to real Euclidean space by taking the logarithm of each component relative to the geometric mean of all components in the sample.
Protocol 2.1: CLR Transformation for Glycan Abundance Data
- Input: A matrix of D glycan relative abundances (parts) for N samples. Ensure no zero values (see zero-handling protocol 2.3).
- Step 1: For each sample i, calculate the geometric mean (G) of all D parts:
G(x_i) = (x_i1 * x_i2 * ... * x_iD)^(1/D) - Step 2: For each glycan abundance x_ij in sample i, compute the CLR coefficient:
clr(x_ij) = ln(x_ij / G(x_i)) - Output: An N x D matrix of CLR-transformed values. Note: The sum of CLR values for a sample is zero, introducing linear dependence (covariance matrix is singular).
Table 2: CLR-Transformed Data from Table 1 (Example)
| Sample ID | clr(G1) | clr(G2) | clr(G3) | clr(G4) | Sum (≈0) |
|---|---|---|---|---|---|
| Control-1 | 0.336 | -0.148 | 0.142 | -0.330 | 0.000 |
| Disease-1 | -0.601 | 0.522 | 0.196 | -0.117 | 0.000 |
Additive Log-Ratio (ALR) Transformation
The ALR transformation chooses a single reference component (e.g., a housekeeping glycan or the most abundant part) and calculates log-ratios of all other parts against it, reducing dimensionality by one.
Protocol 2.2: ALR Transformation with Reference Glycan Selection
- Input: A matrix of D glycan abundances. Designate a reliable reference glycan k (e.g., a prevalent, stable core structure).
- Step 1: For each sample i, divide the abundance of every non-reference glycan j by the abundance of the reference glycan k.
- Step 2: Take the natural logarithm of each ratio:
alr(x_ij) = ln(x_ij / x_ik), where j ≠ k. - Output: An N x (D-1) matrix of ALR-transformed values. This matrix is suitable for full-rank statistical modeling.
Protocol 2.3: Handling Zero Abundances (Essential Preprocessing) Zeros, common in glycan profiling due to detection limits, are undefined in log-ratio analysis.
- Method A (Replacement): Apply a multiplicative replacement strategy using the
zCompositionsR package orscikit-compositionPython library. Replace zeros with a small positive value proportional to the detection limit. - Method B (Bayesian Approach): Use a Bayesian-multiplicative replacement to model zeros as left-censored data, preserving the covariance structure.
Application Workflow: From Raw Data to Biological Insight
Diagram 1: Compositional Glycomics Analysis Workflow
The Scientist's Toolkit: Essential Research Reagent Solutions
Table 3: Key Reagents & Materials for Compositional Glycan Profiling
| Item | Function/Benefit in Compositional Analysis |
|---|---|
| PNGase F (or A) | Enzyme for liberating N-linked glycans from glycoproteins. Ensures a complete, unbiased profile for a consistent "whole". |
| Procainamide (ProA) Labeling Kit | Fluorescent tag for HPLC/UPLC separation. Enhances detection sensitivity and linearity, critical for accurate part measurements. |
| 2-AA or 2-AB Labeling Kits | Common amine-based tags for glycan derivatization for LC-MS/MS. Standardizes yield for relative quantitation. |
| Deuterated or 13C-Labeled Internal Standards | Spiked internal standards for semi-absolute quantitation. Helps correct for technical variation before closure to a constant sum. |
| Standard Glycan Ladder | A defined mixture of known glycans. Used to align retention times (LC) or calibrate m/z (MS) across runs, ensuring part identity. |
| Normalization Beads (for MS) | Functionalized beads for sample clean-up and standardized peptide/glycan loading, reducing pre-analytical variation. |
Zero-Replacement Software (zCompositions R package) |
Statistical tool to impute missing/zero values, a mandatory step before log-ratio transformation. |
compositions or robCompositions R Package |
Dedicated software suites for performing ILR, CLR, ALR transforms and subsequent compositional statistics. |
Signaling Pathway Context: Glycan Biosynthesis as a Compositional System
Diagram 2: Competitive Glycan Biosynthesis Pathway
Glycomics data, like many omics datasets, is inherently compositional. Measurements (e.g., peak intensities from LC-MS, signal abundances from microarrays) represent parts of a whole, constrained by a total sum. This closure property invalidates the assumptions of standard statistical methods (e.g., Pearson correlation, t-tests on raw abundances), leading to spurious correlations and false positive/negative findings. This document details the application of Compositional Data Analysis (CoDA) principles, specifically centered and additive log-ratio (CLR, ALR) transformations, to ensure valid inference in glycomics research.
Quantitative Demonstration of Spurious Correlation
The following table summarizes a simulated experiment comparing the relative abundance of two glycans (G1, G2) against an external, independent physiological variable (e.g., blood pressure) across 100 samples. The total sample abundance is artificially controlled.
Table 1: Spurious Correlation Induced by Compositional Closure
| Statistical Analysis Performed | Correlation Coefficient (r) | p-value | Correct Interpretation |
|---|---|---|---|
| Pearson correlation on raw abundances of G1 vs. Physiological Variable | 0.72 | <0.001 | Spurious. Driven by changes in other glycans, not a real biological relationship. |
| Pearson correlation on raw abundances of G2 vs. Physiological Variable | -0.68 | <0.001 | Spurious. Artifact of the compositional constraint. |
| Pearson correlation on CLR-transformed G1 vs. Physiological Variable | 0.15 | 0.14 | Valid. No significant correlation detected. |
| Pearson correlation on CLR-transformed G2 vs. Physiological Variable | -0.09 | 0.38 | Valid. No significant correlation detected. |
Simulation Parameters: Total abundance per sample fixed at 10,000 arbitrary units. Abundances for G1, G2, and 10 other glycans were drawn from multivariate log-normal distributions with no true correlation to the simulated physiological variable.
Core Protocols for CoDA in Glycomics
Protocol 3.1: Data Preprocessing and Imputation for Glycomics Data
Purpose: To prepare raw glycan abundance data for CoDA transformation.
- Data Normalization (Technical Variation): Apply batch correction (e.g., using ComBat) and total ion current or internal standard normalization to account for technical variance before treating data as compositional.
- Handling Zeros/Non-detects: Replace zeros using a multiplicative replacement strategy (e.g., the
zCompositionsR packagecmultReplfunction) with a small imputed value, preserving the compositional structure. - Data Integrity Check: Ensure all abundances are positive. The data matrix is now considered a composition.
Protocol 3.2: Applying CLR Transformation
Purpose: To center compositional data in Euclidean space for downstream multivariate analysis.
- Calculate Geometric Mean: For each sample i, compute the geometric mean ( G(\mathbf{x}i) ) of all *D* glycan abundances: ( G(\mathbf{x}i) = (\prod{j=1}^{D} x{ij})^{1/D} ).
- Log-Ratio Calculation: Transform each glycan abundance ( x{ij} ) in sample *i*: ( \text{clr}(x{ij}) = \ln\left(\frac{x{ij}}{G(\mathbf{x}i)}\right) ).
- Output: The resulting CLR matrix has rows summing to zero. This data is suitable for PCA, covariance-based analysis, and differential abundance testing using standard methods (e.g., linear models).
Protocol 3.3: Applying ALR Transformation for Specific Hypothesis Testing
Purpose: To transform data into a non-compositional Euclidean space for regression or univariate testing relative to a chosen reference.
- Select Reference Glycan: Choose a biologically stable and abundant glycan as the denominator (e.g., a prevalent core structure). Validation of reference stability is critical.
- Log-Ratio Calculation: For each glycan j in sample i, relative to reference glycan r: ( \text{alr}(x{ij}) = \ln\left(\frac{x{ij}}{x_{ir}}\right) ).
- Output: The ALR-transformed matrix has D-1 coordinates. These can be used directly in linear regression, ANOVA, or correlation analysis without the risk of spurious correlation from closure.
Protocol 3.4: Differential Abundance Analysis Using ALR/CLR
Purpose: To identify glycans differentially abundant between two conditions (e.g., Healthy vs. Disease).
- Transformation: Apply CLR transformation (Protocol 3.2) to the full dataset.
- Multivariate Model: Fit a multivariate linear model (e.g., using
lmin R) for each CLR-transformed glycan against the group variable, including relevant covariates. - Statistical Testing: Perform ANOVA or t-tests on the model coefficients for the group effect. Alternatively, use a dedicated tool like
limmaon the CLR-transformed data. - Result Interpretation: Significant results indicate a change in the relative abundance of that glycan relative to the geometric mean of all glycans (for CLR) or the chosen reference (for ALR).
CoDA Workflow for Glycomics Data Analysis
The Scientist's Toolkit: Research Reagent Solutions
Table 2: Essential Materials and Tools for Compositional Glycomics
| Item | Function in CoDA Glycomics |
|---|---|
| R Statistical Environment | Primary platform for CoDA analysis. Provides flexibility for custom transformations and modeling. |
compositions R Package |
Core library for CLR, ALR, ILR transformations, and compositional visualization (ternary diagrams). |
robCompositions R Package |
Provides robust methods for imputation (impCoda) and outlier detection in compositional data. |
zCompositions R Package |
Specialized functions for zero and missing value replacement (cmultRepl) in compositional datasets. |
| Stable Isotope-Labeled Internal Standards | Used during sample prep to normalize for technical variation prior to compositional treatment, improving accuracy. |
| Benchmark Glycan Mixture (BGM) | A well-characterized control sample run in parallel to monitor instrument stability and validate data quality pre-CoDA. |
Python's scikit-bio or PyCoDA |
Python-based alternatives for performing log-ratio transformations and related analyses. |
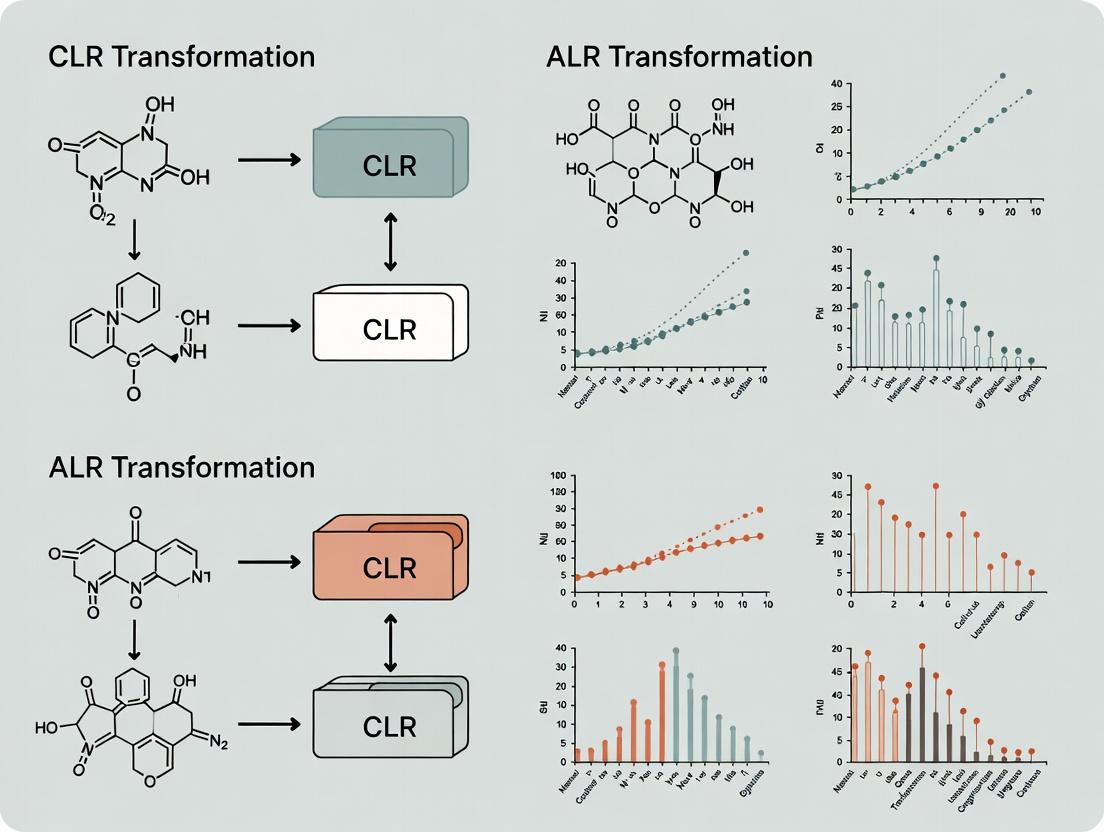
Visualizing the Impact of Transformations
Impact of CLR and ALR Transformations on Analysis Validity
Core Principles of Compositional Data Analysis (CoDA) for Glycobiology
1. Introduction: The CoDA Framework in Glycomics
Glycomics data, such as the relative abundances of glycans, glycan structures, or glycosylation site occupancies, are inherently compositional. The total signal (e.g., total ion current, total fluorescence) is arbitrary and constrained, meaning individual measurements only carry information relative to other parts of the whole. Applying standard statistical methods to raw relative percentages or ratios can lead to spurious correlations and erroneous conclusions. Compositional Data Analysis (CoDA) provides the mathematically coherent framework for such data. Within a thesis on CLR and ALR transformations, CoDA is presented not as an optional normalization step, but as a fundamental prerequisite for valid analysis in compositional glycomics.
2. Core CoDA Principles & Their Glycobiology Interpretation
The principles of CoDA, as defined by J. Aitchison, are directly applicable to glycomics data.
- Scale Invariance: The information in a composition is contained in the ratios of its parts, not in the absolute magnitudes. Doubling the total sample amount does not change the compositional information.
- Glycomics Context: A 20% abundance of a triantennary glycan is informative only relative to the other 80%. The absolute MS signal intensity is irrelevant for relative comparison between samples unless properly normalized via CoDA.
- Subcompositional Coherence: Conclusions drawn from an analysis of a full set of components must be consistent with conclusions drawn from any sub-composition (a subset of components).
- Glycomics Context: If analyzing the balance between high-mannose vs. complex-type glycans, the results should not contradict the analysis of the full dataset including hybrid types. Standard correlation analysis often violates this principle.
- Permutation Invariance: The principles hold regardless of the order in which the components (glycans) are listed.
- Aitchison Simplex: Compositional data reside in a constrained sample space called the simplex. Statistical analysis must occur in real Euclidean space, achieved through log-ratio transformations.
3. Log-Ratio Transformations: CLR and ALR in Practice
Two central transformations enable the movement of glycomics data from the simplex to real space.
A. Centered Log-Ratio (CLR) Transformation
- Definition:
CLR(x) = ln(x_i / g(x)), wherex_iis the proportion of component i, andg(x)is the geometric mean of all components in the sample. - Thesis Context: The CLR transformation is symmetric and preserves all pairwise ratios. It is ideal for principal component analysis (PCA) and visualizing the relative variation of all glycans around a central (geometric mean) reference. However, it leads to a singular covariance matrix, making it unsuitable for some multivariate statistical models.
- Protocol 1: CLR Transformation of LC-MS Glycan Abundance Data
- Input Data: A matrix of
nsamples (rows) andDglycans (columns) with non-zero, positive abundances (e.g., chromatographic peak areas). - Closure: Normalize each sample to a constant sum (e.g., 1,000,000) to remove technical variation in total signal:
C(x) = [x_1/Σx, x_2/Σx, ..., x_D/Σx]. - Handle Zeros: Apply a multiplicative replacement strategy (e.g., the
zCompositionsR package) to impute plausible values for any zero or missing abundances, which are common in glycomics. - Calculate Geometric Mean: For each sample row, compute the geometric mean
g(x)of allDclosed abundances. - Log-Ratio Calculation: For each glycan
iin the sample, computeln( x_i / g(x) ). - Output: A transformed
n x Dmatrix where each column is centered around zero. This matrix is now suitable for downstream PCA, correlation analysis, or clustering.
- Input Data: A matrix of
B. Additive Log-Ratio (ALR) Transformation
- Definition:
ALR(x) = ln(x_i / x_D), wherex_Dis the proportion of a chosen reference component. - Thesis Context: The ALR transformation maps data to a
D-1dimensional real space, avoiding covariance singularity. The choice of reference denominator (e.g., a housekeeping glycan, the most abundant species, or a biologically stable structure) is critical and must be stated. It is interpretable as the log-fold change of all glycans relative to a fixed anchor. - Protocol 2: ALR Transformation with Reference Glycan Selection
- Input & Closure: Perform steps 1-3 from Protocol 1.
- Reference Selection: Identify a suitable reference glycan (
Ref). This should be a consistently detected, biologically stable structure across all samples (e.g., a predominant biantennary core-fucosylated glycan in serum IgG N-glycomics). - Log-Ratio Calculation: For each glycan
i(wherei ≠ Ref) in a sample, computeln( x_i / x_Ref ). - Output: A transformed
n x (D-1)matrix. Each value represents the log-ratio of a glycan to the reference. This matrix is suitable for regression, ANOVA, and other multivariate statistical modeling.
Table 1: Comparison of CLR vs. ALR for Glycomics Data
| Feature | Centered Log-Ratio (CLR) | Additive Log-Ratio (ALR) |
|---|---|---|
| Reference | Geometric mean of all parts | A single, chosen reference part (denominator) |
| Dimensions | D (with singular covariance) |
D-1 (non-singular) |
| Interpretability | Variation relative to the average glycome | Direct fold-change relative to a key glycan |
| Ideal Use Case | Exploratory analysis, PCA, clustering | Hypothesis testing, regression, modeling |
| Key Limitation | Covariance matrix is singular | Results depend on the choice of reference |
4. Application Notes for Glycobiology Experiments
- Note 1: MALDI-TOF MS Relative Quantification: Spectral data is compositional. Apply a total area normalization (closure) followed by CLR transformation before comparing glycan profiles between disease cohorts.
- Note 2: HPLC/Fluorescence Data: Normalize chromatogram peak areas to the total integrated area per sample (closure), then apply ALR transformation using a prominent, invariant peak as a reference for time-course studies.
- Note 3: Site-Specific Occupancy from LC-MS/MS: Occupancy percentages at multiple sites on a protein sum to a constant for each sample (100% of the protein population). Analyze log-ratios of site occupancies (ALR) to study competition between sites.
The Scientist's Toolkit: Essential Reagents & Resources for Compositional Glycomics
| Item | Function in CoDA Workflow |
|---|---|
| Standard Glycan Library | Provides reference for peak annotation; its members are potential ALR denominators. |
| Internal Standard (IS) Mix | Used for absolute quantification prior to closure. Post-closure, IS are part of the composition. |
| zCompositions R Package | Critical for implementing proper multiplicative replacement of zeros/missing values. |
| compositions / robCompositions R Packages | Provide functions for ILR, CLR, ALR transformations and robust statistical analysis. |
| CoDaPack / Genesis Software | User-friendly GUI-based software for performing CoDA. |
| Normalized Data Table (CSV) | The essential output from any analytical instrument, serving as input for CoDA scripts. |
Visualization of CoDA Workflow for Glycomics
CoDA Analysis Workflow for Glycomics Data
Moving Glycan Data from Simplex to Real Space
Within the broader thesis on CoDa (Compositional Data) transformations for compositional glycomics research, the Centered Log-Ratio (CLR) transformation serves as a cornerstone. Unlike the Additive Log-Ratio (ALR), which reduces dimensionality by selecting a denominator component, CLR preserves the original dimensionality of the data. This is critical in glycomics, where the goal is to understand the relative abundances of all glycans or glycosylation features simultaneously, maintaining the full suite of inter-part correlations for downstream analyses like PCA or clustering. The CLR-transformed values are intrinsically interpreted relative to the geometric mean of the entire composition, centering the data in a Euclidean space where standard statistical tools can be applied.
Core Theoretical Framework and Mathematical Definition
For a D-part composition (e.g., abundances of D different glycan structures), represented as a vector x = [x₁, x₂, ..., x_D], where xᵢ > 0, the CLR transformation is defined as:
CLR(x) = [log(x₁ / g(x)), log(x₂ / g(x)), ..., log(x_D / g(x))]
where g(x) is the geometric mean of all parts: g(x) = (∏ᵢ₌₁^D xᵢ)^(1/D)
This transformation maps the composition from the simplex (the sample space of compositional data) into a D-dimensional real space, with the constraint that the CLR coordinates sum to zero.
Data Presentation: CLR vs. ALR in Simulated Glycomics Data
The table below contrasts the properties of CLR and ALR transformations using a simulated dataset of five glycan abundances (in arbitrary units) from three biological samples.
Table 1: Contrasting CLR and ALR Transformations on Simulated Glycan Data
| Glycan / Sample | Raw Abundance (Sample A) | Raw Abundance (Sample B) | Raw Abundance (Sample C) | CLR Coords (Sample A) | ALR Coords (Ref=Glycan5) (Sample A) |
|---|---|---|---|---|---|
| Glycan1 | 50.0 | 10.0 | 25.0 | 0.497 | 1.386 |
| Glycan2 | 100.0 | 20.0 | 50.0 | 1.194 | 2.079 |
| Glycan3 | 25.0 | 60.0 | 15.0 | -0.111 | 0.000 |
| Glycan4 | 10.0 | 5.0 | 30.0 | -1.011 | -0.693 |
| Glycan5 | 15.0 | 15.0 | 10.0 | -0.569 | 0.000 (Reference) |
| Geometric Mean g(x) | 26.83 | 13.47 | 21.97 | -- | -- |
| Sum of CLR | -- | -- | -- | 0.000 | -- |
Note: ALR uses Glycan5 as the reference denominator. All logarithms are natural log (ln).
Experimental Protocols for Glycomics Data Transformation
Protocol 4.1: Preprocessing and Imputation of Zero Values in Glycan Abundance Data
Purpose: To handle non-detects or zeros, which are problematic for log-ratio transformations.
- Input: A matrix of glycan abundance counts or peak areas (rows=samples, columns=glycan features).
- Zero Identification: Identify all zero/non-detect values.
- Imputation: Apply a multiplicative replacement strategy (e.g., the zCompositions R package
cmultReplfunction).- Replace zeros with an estimate based on the multivariate log-ratio expectation-maximization algorithm.
- Critical Parameter: Set the detection limit for each glycan feature based on instrument sensitivity.
- Renormalization: Re-close the imputed composition for each sample to a constant sum (e.g., 1,000,000 or total ion count) to maintain compositional nature.
- Output: A positivity-constrained compositional matrix ready for transformation.
Protocol 4.2: Performing the CLR Transformation
Purpose: To transform preprocessed compositional data into Euclidean coordinates.
- Input: Imputed and renormalized glycan abundance matrix from Protocol 4.1.
- Calculate Geometric Mean: For each sample (row), compute the geometric mean g(x) of all D glycan abundances.
- Log-Ratio Calculation: For each glycan i in the sample, compute
ln(abundanceᵢ / g(x)). - Validation: For each sample, verify that the sum of all D CLR coordinates equals zero (within machine precision).
- Output: A D-column matrix of CLR-transformed values. This matrix can be used directly in PCA, regression, or hypothesis testing (using Aitchison's distance).
Protocol 4.3: Interpreting the Geometric Mean in a Biological Context
Purpose: To derive biological insight from the CLR's implicit denominator.
- Calculate Sample-specific g(x): As in Protocol 4.2, Step 2.
- Correlation with Phenotype: Correlate the vector of per-sample geometric means (
g(x)) with clinical or experimental phenotypes (e.g., disease stage, drug response).- A significant correlation indicates a global shift in the total glycan profile is associated with the phenotype.
- Differential Abundance Testing (using CLR): Perform ANOVA or linear modeling on each CLR-transformed glycan feature.
- A significant result for a glycan indicates its abundance has changed relative to the geometric mean of the entire profile.
- Interpretation: Contrast results from ALR (change relative to a fixed glycan) to highlight how CLR provides a holistic, symmetric reference frame.
Visualizations
Workflow for CLR Transformation of Glycomics Data
Dimensionality Preservation from Simplex to PCA
The Scientist's Toolkit: Key Reagents & Materials for Compositional Glycomics
Table 2: Essential Research Reagents and Computational Tools
| Item/Category | Specific Example/Product | Function in CLR-based Glycomics Research |
|---|---|---|
| Glycan Release Enzymes | PNGase F, Endo H, O-Glycosidase | Cleaves N- and O-linked glycans from proteins for subsequent analysis, generating the raw abundance data. |
| Chromatography Matrix | Porous Graphitized Carbon (PGC) LC Columns | High-resolution separation of isomeric glycan structures prior to MS detection. |
| Mass Spectrometer | Time-of-Flight (TOF) or Orbitrap MS | Provides high-mass-accuracy detection and quantification of individual glycan features. |
| Internal Standards | ¹³C-labeled or deuterated glycans | Allows for correction of technical variation and potential absolute quantification. |
| Statistical Software | R Programming Environment | Primary platform for CoDa analysis. |
| Core CoDa R Packages | compositions, zCompositions, robCompositions |
Perform CLR transformation, handle zeros, and conduct robust compositional statistics. |
| Visualization Package | ggplot2 with ggbiplot extension |
Creates publication-quality plots of CLR-based PCA and other analyses. |
| High-Performance Computing | Multi-core Workstation or Cluster | Enables permutation testing and bootstrapping on large, high-dimensional glycomics datasets. |
Within the broader thesis on analyzing compositional glycomics data, the Additive Log-Ratio (ALR) transformation is presented as a robust alternative to the more common Centered Log-Ratio (CLR) transformation. While CLR centers data against the geometric mean of all components, ALR transforms data relative to a single, carefully chosen reference component. This Application Note details the principles, protocols, and critical considerations for implementing ALR transformation in glycomics research, with a focus on selecting a stable reference glycan and building simplified, interpretable models for biomarker discovery and therapeutic development.
Theoretical Framework: ALR vs. CLR
Compositional glycomics data, such as relative abundances from mass spectrometry or liquid chromatography, exists in a constrained space where changes in one component affect the apparent abundance of others. Log-ratio transformations are essential for valid statistical analysis.
- CLR Transformation: Creates
Dnew variables fromDoriginal components by taking the logarithm of each component divided by the geometric mean of all components. It preserves distances but leads to singular covariance matrices, complicating some multivariate analyses. - ALR Transformation: Creates
D-1new variables by taking the logarithm of each component divided by a chosen reference component. This yields a non-singular covariance matrix suitable for standard multivariate statistics but makes the results dependent on the reference choice.
Table 1: Key Comparison of CLR and ALR Transformations
| Feature | Centered Log-Ratio (CLR) | Additive Log-Ratio (ALR) |
|---|---|---|
| Reference | Geometric mean of all parts | A single, user-selected part |
| Dimensions | D (leads to singular covariance) | D-1 (non-singular covariance) |
| Interpretability | Coefficients relative to average composition | Coefficients relative to the chosen reference |
| Primary Use | PCA, visualization, some regressions | Standard multivariate stats (regression, ANOVA) |
| Key Challenge | Covariance singularity | Critical choice of a robust reference |
Core Protocol: Selecting an Optimal Reference Glycan for ALR
The validity of an ALR-transformed model hinges on the stability and appropriateness of the reference glycan. This protocol outlines a data-driven selection process.
Protocol 3.1: Data-Driven Reference Glycan Selection
Objective: To identify the most stable and biologically relevant glycan to serve as the reference (denominator) for ALR transformation.
Materials & Reagents:
- Pre-processed relative glycan abundance data (e.g., % area or normalized intensities).
- Statistical software (R, Python, etc.).
Procedure:
- Data Pre-screening: Filter out glycans with an abundance below a technically reliable threshold (e.g., present in <70% of samples or with a coefficient of variation >100% in QC pools).
- Calculate Variation: For each remaining glycan
i, calculate its compositional variation across all samples. A common metric is the variance of its log-abundance:Var(log(Glycan_i)). - Rank Stability: Rank glycans from lowest to highest variance. The glycan with the lowest variance is the most stable and is the primary candidate for the reference.
- Biological Validation: Assess the top candidate(s) from Step 3 for biological appropriateness:
- The reference glycan should not be a primary glycan of interest for the hypothesis.
- It should be a common, core structural element (e.g., a prevalent biantennary N-glycan) unlikely to be directly involved in the specific biological pathway under study.
- Check literature for known invariance in the studied condition (e.g., disease vs. healthy).
- Sensitivity Analysis: Perform downstream analyses (e.g., differential analysis model) using the top 2-3 candidate references. The core conclusions should be qualitatively robust to this choice.
Table 2: Example Output from Reference Selection Protocol
| Candidate Glycan (Structure) | Variance (log-scale) | Mean Relative Abundance (%) | Presence in Samples | Suitability Rationale |
|---|---|---|---|---|
| FA2G2 (NGA2F) | 0.052 | 18.7 | 100% | Selected Ref: High abundance, low variance, common biantennary core. |
| A3G3S1 | 0.089 | 5.2 | 98% | Moderate variance, potential biomarker for inflammation. |
| M7 | 0.121 | 3.1 | 87% | Higher variance, lower presence. |
| FA2G2S1 | 0.143 | 4.5 | 100% | Known acute-phase reactant; variable. |
Protocol: Performing ALR Transformation and Building Simplified Models
Protocol 4.1: ALR Transformation and Feature Selection Workflow
Objective: To transform glycan compositional data and build a parsimonious model for interpretation.
Procedure:
- Apply ALR Transformation: Using the reference glycan
G_refselected in Protocol 3.1, calculate the ALR coordinates for each sample:ALR_i = log(Glycan_i / G_ref)for alli ≠ ref. - Initial Multivariate Model: Fit a preliminary model (e.g., linear regression for disease state) using all
D-1ALR features. - Feature Selection (Simplification): Apply a penalized regression method (e.g., LASSO) to the ALR-transformed data to identify a subset of glycans whose ratios to the reference are most predictive.
- Final Model Refitting: Refit a standard linear model using only the selected ALR features to obtain interpretable coefficients.
- Interpretation: A positive coefficient for
ALR_iindicates that the ratio ofGlycan_itoG_refincreases with the predictor variable. This can be back-transformed: an increase inALR_imeansGlycan_iincreases orG_refdecreases, but relative to the stable reference, the evidence strongly supports a change inGlycan_i.
Diagram Title: ALR Transformation and Model Simplification Workflow
The Scientist's Toolkit: Research Reagent Solutions
Table 3: Essential Reagents and Materials for ALR-Based Glycomics
| Item | Function in ALR-Focused Research |
|---|---|
| Standardized Glycan Library | Provides reference standards for confident peak annotation, crucial for consistently identifying the chosen reference glycan across runs. |
| Stable Isotope-Labeled Glycans | Acts as internal standards for semi-absolute quantification, helping verify the biological stability of the chosen reference. |
| Glycoenzyme Kits (PNGase F, Sialidases) | For controlled glycan manipulation and validation of structural assignments of both target and reference glycans. |
| Normalization Spike-Ins | Added pre-processing to correct for technical variation, improving the reliability of variance calculations for reference selection. |
| Quality Control Pooled Serum | A consistent sample run across all batches to monitor platform stability, ensuring the reference glycan's measured variance is biological, not technical. |
| Statistical Software (R/Python) | With packages for compositional data analysis (compositions, robCompositions) and penalized regression (glmnet), essential for transformation and modeling. |
Advanced Application: Pathway-Oriented Visualization
ALR simplification allows for mapping results onto biological pathways. A key pathway modulated by glycosylation is receptor tyrosine kinase (RTK) signaling.
Diagram Title: ALR Results Mapped to RTK Signaling Pathway
Integrating the ALR transformation into a glycomics analysis pipeline, with rigorous reference selection and model simplification, provides a robust framework for generating biologically interpretable hypotheses. By outputting specific glycan ratios, it directly links statistical findings to testable biological mechanisms, such as modulation of specific signaling pathways, thereby offering clear value for translational research and therapeutic development.
Within compositional glycomics research, data transformation is a critical preprocessing step to address the non-independence and constant-sum constraint of relative abundance data. This document details application notes and protocols for visualizing and interpreting Principal Component Analysis (PCA) and Partial Least Squares Discriminant Analysis (PLS-DA) plots before and after applying the Centered Log-Ratio (CLR) and Additive Log-Ratio (ALR) transformations. These visualizations are essential for assessing the impact of transformation on data structure, cluster separation, and the mitigation of spurious correlations in downstream analyses.
Core Concepts & Transformations
Compositional Data: Glycomics data (e.g., relative abundances of glycan structures) sum to a constant total (e.g., 100%), creating a closed geometry that violates assumptions of standard statistical methods.
ALR Transformation: Transforms D-part composition x by taking the logarithm of the ratio of each part to a chosen reference part: ( ALRi(x) = \ln(xi / xD) ), where ( xD ) is the reference component. This transformation moves data to a real Euclidean space but renders the covariance matrix non-invertible.
CLR Transformation: Transforms x by taking the logarithm of the ratio of each part to the geometric mean of all parts: ( CLRi(x) = \ln(xi / g(x)) ), where ( g(x) ) is the geometric mean. It preserves metric relationships but creates singular covariance due to the zero-sum constraint.
Experimental Protocol: Generating Comparative PCA/PLS-DA Plots
Protocol 3.1: Data Preprocessing and Transformation
Objective: Prepare raw glycan relative abundance data for comparative multivariate analysis.
- Input: A matrix (samples x glycan features) of relative abundances or peak areas. Assume zeros represent non-detects.
- Zero Imputation: Apply multiplicative replacement using the zCompositions R package (v.1.6.0+) to replace zeros with sensible small values while preserving compositions.
- Apply Transformations:
- Raw/Untransformed: Use imputed data directly (not recommended for PCA/PLS-DA but shown for contrast).
- ALR: Apply transformation using a stable, highly abundant glycan as the denominator (e.g., peak 20).
- CLR: Apply transformation.
Protocol 3.2: PCA and PLS-DA Execution & Visualization
Objective: Generate and compare score plots from different data states.
- PCA Analysis: For each dataset (Raw, ALR, CLR), perform mean-centering and PCA using the prcomp function in R.
- PLS-DA Analysis: Using the mixOmics R package (v.6.26.0+), perform supervised analysis for class discrimination (e.g., Disease vs. Control).
- Visualization: Create side-by-side score plots for PC1 vs. PC2 and PLS-DA LV1 vs. LV2. Color points by biological group. Use consistent axis limits within each analysis type (PCA or PLS-DA) for direct comparison.
Representative Data & Interpretation
Table 1: Comparative Metrics from PCA of a Simulated Glycan Dataset (n=50 samples, 40 glycans)
| Metric | Untransformed (Imputed) | ALR Transformed | CLR Transformed |
|---|---|---|---|
| Variance Explained by PC1 (%) | 72.5 | 38.2 | 41.7 |
| Variance Explained by PC2 (%) | 16.3 | 21.5 | 18.9 |
| Distance Correlation (Group Separation) | 0.15 | 0.68 | 0.72 |
| Average Aitchison Distance | N/A | 12.4 | 11.9 |
Interpretation: The untransformed data shows an artificial dominance of the first principal component, a common artifact of the constant-sum constraint. Both ALR and CLR transformations correct this, yielding more balanced variance explanation and significantly improving the separation between pre-defined biological groups, as quantified by distance correlation.
Table 2: PLS-DA Performance Metrics (10-Fold Cross-Validation)
| Metric | Untransformed (Imputed) | ALR Transformed | CLR Transformed |
|---|---|---|---|
| Balanced Accuracy (%) | 65.2 | 88.5 | 91.3 |
| 95% CI | (58.1, 72.3) | (83.1, 93.9) | (86.5, 96.1) |
| Permutation p-value | 0.12 | 0.003 | 0.001 |
Interpretation: Classification performance is substantially higher and statistically significant only after compositional transformation, with CLR providing marginally better results than ALR in this simulation. This underscores the necessity of transformation for reliable biomarker discovery.
The Scientist's Toolkit: Essential Research Reagents & Materials
Table 3: Key Reagent Solutions for Compositional Glycomics Analysis
| Item | Function & Relevance |
|---|---|
| 2-AB Labeling Kit | Fluorescently labels released glycans for HPLC/UPLC analysis, enabling detection and quantification. |
| Glycan Release Enzymes (PNGase F) | Enzymatically cleaves N-linked glycans from glycoproteins for subsequent analysis. |
| HILIC-UPLC Columns | Stationary phase for separating labeled glycans by hydrophilic interaction liquid chromatography. |
| Internal Standard Mix | A set of known, spiked-in glycans for run-to-run normalization and quality control. |
| zCompositions R Package | Provides essential functions for zero imputation in compositional datasets prior to transformation. |
| compositions / robCompositions R Packages | Core libraries for performing ALR, CLR, and other compositional data transformations. |
| mixOmics R Package | Provides robust implementations of PLS-DA and other multivariate methods for omics data. |
| Aitchison Distance Matrix | The fundamental metric for calculating dissimilarities between compositions, used in PERMANOVA. |
Workflow & Conceptual Diagrams
Title: Workflow for Comparative PCA/PLS-DA of Glycomics Data
Title: Conceptual Impact of Transformation on PCA Structure
Step-by-Step Workflow: Implementing CLR and ALR Transformations in Your Glycomics Pipeline
Within compositional glycomics, data derived from Liquid Chromatography-Mass Spectrometry (LC-MS) and Capillary Electrophoresis with Laser-Induced Fluorescence (CE-LIF) represent parts of a whole (e.g., total glycan pool per sample). The raw output—peak areas—is inherently compositional and subject to constant-sum constraints. This protocol details the preprocessing pipeline essential for transforming raw instrument data into a clean, log-ratio transformable matrix, a critical prerequisite for robust analysis using Centered Log-Ratio (CLR) or Additive Log-Ratio (ALR) transformations in downstream thesis research.
Application Notes: Core Principles & Challenges
Table 1: Common Data Issues in Raw Glycomic Peak Area Data
| Issue | Description | Impact on Compositional Analysis |
|---|---|---|
| Non-Detects | Zero or missing values from analytes below detection limit. | Creates undefined log-ratios; biases imputation. |
| Noise Floor | Very small, non-zero values from background noise. | Amplifies variance in log-space disproportionately. |
| Platform-Specific Bias | Systematic differences in detection efficiency between LC-MS and CE-LIF. | Hampers data integration and joint analysis. |
| Carry-Over / Contamination | Small peaks from previous runs or contaminants. | Introduces spurious, non-biological signal. |
| Variance Heteroscedasticity | Variance of peak areas scales with mean magnitude. | Violates assumptions of many statistical models. |
Table 2: CLR vs. ALR Transformation Considerations for Processed Data
| Aspect | Centered Log-Ratio (CLR) | Additive Log-Ratio (ALR) |
|---|---|---|
| Definition | log(x_i / g(x)), where g(x) is geometric mean of all parts. | log(xi / xD), where x_D is a chosen denominator part. |
| Codomain | Uses all parts; results in singular covariance matrix. | Uses D-1 parts; yields non-singular covariance. |
| Use Case in Glycomics | Exploratory analysis (PCA on CLR). | Modeling specific biological ratios relative to a stable "housekeeping" glycan. |
| Thesis Context | Suitable for overall glycome perturbation analysis. | Suitable for pathway-specific hypotheses (e.g., sialylation ratios). |
Experimental Protocols
Protocol 3.1: Raw Data Consolidation & Annotation
Objective: Merge technical replicates and annotate peaks with putative glycan compositions.
- File Import: Load raw peak area tables from instrument software (.csv, .xlsx).
- Replicate Averaging: For each sample, calculate the mean peak area across technical replicates. Apply coefficient of variation (CV) filter: exclude peaks with CV > 20% prior to averaging.
- Peak Alignment: Align peaks across samples using a reference ladder (CE-LIF) or accurate mass/retention time (LC-MS). Use a tolerance of ±0.01 m/z and ±0.2 min.
- Master Feature List: Create a matrix where rows = samples, columns = aligned features, cells = mean peak area.
Protocol 3.2: Handling Non-Detects & Noise
Objective: Replace zeros and noise-driven values with sensible, model-based estimates.
- Identification: Define non-detects as values = 0. Define noise floor as values < 1% of the median total area per sample.
- Imputation: Use the k-Nearest Neighbor (kNN) imputation method on CLR-transformed values. a. Perform a simple imputation of zeros with 65% of the minimum positive value per feature for initial CLR transform. b. Calculate pairwise Euclidean distances between samples in CLR space. c. For each sample with a zero in original feature j, replace the simple imputed value with the mean of the non-missing values for j from the k=5 nearest neighbor samples. d. Back-transform from CLR to counts.
- Validation: Post-imputation, ensure no zeros remain and that the correlation structure of high-abundance features is preserved.
Protocol 3.3: Normalization & Clean Matrix Generation
Objective: Account for technical variation and produce a clean, closed compositional matrix.
- Total Area Normalization (TAN): Divide each peak area by the total peak area for its respective sample. Multiply by a constant (e.g., 1,000,000) to obtain normalized abundances. Rationale: Explicitly closes the data, acknowledging its compositional nature.
- Outlier Inspection: Perform PCA on CLR-transformed normalized data. Identify and investigate sample outliers (> 3 SD from mean on PC1 or PC2) for potential technical errors.
- Final Matrix: Output a clean matrix X of dimensions n samples x p glycans, where each row sums to the chosen constant.
Visualizations
Workflow: Data Preprocessing for Compositional Glycomics
Decision Logic for Handling Zero Values
The Scientist's Toolkit
Table 3: Essential Research Reagent Solutions & Materials
| Item | Function in Preprocessing |
|---|---|
| Internal Standard Mixture (IS) | Spiked pre-extraction for absolute quantification; used post-acquisition for monitoring technical variation and peak alignment. |
| Dextran Ladder (CE-LIF) | Co-injected carbohydrate standard with known migration times for precise peak alignment across runs. |
| LC-MS Quality Control (QC) Pool | Pooled sample injected at regular intervals to monitor instrument drift; used for batch correction if needed. |
| Buffer A & B (LC-MS) | Mobile phases (e.g., Water/ACN with Formic Acid) for chromatographic separation; consistency is critical for retention time stability. |
| Background Electrolyte (BGE) for CE-LIF | Standardized buffer (e.g., amine-based) ensuring reproducible electrophoretic mobility and peak shapes. |
Imputation Software (e.g., R zCompositions) |
Provides robust statistical methods (kNN, QRILC) for replacing zeros in compositional data. |
Log-Ratio Transform Library (e.g., R compositions) |
Enables correct CLR, ALR, and ILR transformations and associated geometry-aware statistics. |
Within the framework of a thesis investigating centered log-ratio (CLR) and additive log-ratio (ALR) transformations for compositional glycomics data, the treatment of zeros presents a fundamental analytical obstacle. Glycan abundance data, often generated via liquid chromatography-mass spectrometry (LC-MS) or capillary electrophoresis, is intrinsically compositional. CLR and ALR transformations require strictly positive values, as they involve logarithmic transformations of ratios. Zeros, representing non-detects or true absences, must be handled prior to analysis. This note details two principal methodologies: Pseudocount Addition and Bayesian-Multiplicative Replacement (BMR), providing protocols for their application in glycomics research.
Core Concepts & Quantitative Comparison
Table 1: Comparison of Zero-Handling Methods for Compositional Glycan Data
| Feature | Pseudocount Addition | Bayesian-Multiplicative Replacement (e.g., cmultRepl) |
|---|---|---|
| Theoretical Basis | Ad-hoc addition of a small, uniform value to all components. | Bayesian model assuming a multinomial distribution and Dirichlet prior; replaces zeros proportionally to the counts of other components. |
| Impact on Covariance | Severely distorts the covariance structure, inducing a negative bias. | Better preserves the relative covariance structure of the non-zero data. |
| Influence on Compositional Nature | Disrupts the constant-sum constraint, requiring re-closure. | Operates within the compositional simplex; output is already closed (sum to 1 or constant). |
| Parameter Choice | Arbitrary (e.g., 1, 0.5, min/2). Choice significantly influences results. | Uses a prior count parameter (e.g., 2/3 of the min non-zero count for "Geometric Bayesian" method). |
| Best Use Case | Preliminary, simple analyses where some zeros are suspected to be rounding errors. | Rigorous compositional data analysis where preserving the covariance structure is critical for downstream CLR/ALR. |
| Software Implementation | Simple arithmetic in R/Python. | zCompositions::cmultRepl (R), scikit-bio.stats.composition.multiplicative_replacement (Python). |
Table 2: Example Impact on a 3-Component Glycan System (Observed Counts: [10, 0, 30])
| Method & Parameters | Imputed Vector | Closed Proportion (approx.) | Notes |
|---|---|---|---|
| Raw Data | [10, 0, 30] | [0.25, 0.00, 0.75] | Invalid for log-ratios. |
| Pseudocount (+1) | [11, 1, 31] | [0.256, 0.023, 0.721] | Introduces strong distortion. |
| BMR (Prior=0.66)* | [9.99, 0.67, 29.34] | [0.250, 0.017, 0.733] | Minimal distortion of non-zero parts. |
*Prior parameter often set to 2/3 of the minimum non-zero count.
Experimental Protocols
Protocol 3.1: Bayesian-Multiplicative Replacement (BMR) for Glycan Abundance Matrices
Objective: To replace zeros in a compositional glycan abundance matrix prior to CLR/ALR transformation.
Reagents/Software: R Statistical Environment (v4.2+), zCompositions package, tidyverse package for data handling.
Input Data: A samples (rows) x glycans (columns) matrix or data frame of non-negative counts or relative abundances.
Procedure:
- Data Preparation: Load your glycan abundance matrix into R. Ensure data is numeric and contains zeros. Normalize to a common total (e.g., 100,000 for counts per 100k) if not already relative.
- Library Installation:
install.packages("zCompositions")and load it (library(zCompositions)). - Parameter Selection: Determine the
deltaparameter. The default "Geometric Bayesian" method (delta=0.65) uses 65% of the minimum non-zero proportion for each column. For glycan data with many non-detects, considerdelta=0.5. - Execute BMR:
- Verification: Check that no zeros remain (
sum(imputed_matrix == 0)). The row sums should be approximately constant. - Downstream Analysis: Proceed with CLR transformation on
imputed_matrix.
Protocol 3.2: Systematic Comparison of Zero-Handling Methods
Objective: To evaluate the distortion introduced by different zero-handling methods on glycan covariance. Procedure:
- Subset Data: From a complete glycan dataset, select a subset of samples and glycans that contain no zeros. This is your "ground truth" dataset (
D_true). - Introduce Zeros: Artificially introduce zeros into
D_trueby replacing values below a chosen percentile (e.g., 5th) with zero, simulating non-detects. This createsD_zeros. - Apply Methods: Generate three datasets:
D_pseudo: Apply a pseudocount (e.g., min/2) toD_zeros.D_bmr: Apply BMR (cmultRepl) toD_zeros.
- Transform: Apply CLR transformation to
D_true,D_pseudo, andD_bmr. - Metric Calculation: For each method, calculate the Frobenius norm of the difference between its CLR covariance matrix and the CLR covariance matrix of
D_true. A smaller norm indicates less distortion. - Visualization: Plot the CLR-principal components of all three datasets against
D_true. Superior methods will show tighter clustering of imputed points around the original true points.
Visualizations
Diagram 1: Zero-Handling Workflow for Compositional Glycan Data (98 chars)
Diagram 2: BMR Zero Replacement Mechanism (Glycan Counts) (65 chars)
The Scientist's Toolkit
Table 3: Essential Research Reagent Solutions & Software for Glycan Data Zero-Handling
| Item | Function/Description | Example/Provider |
|---|---|---|
| R Statistical Software | Open-source environment for statistical computing and graphics. Essential for implementing BMR. | R Project (r-project.org) |
zCompositions R Package |
Provides the cmultRepl function for Bayesian-multiplicative replacement of zeros. |
CRAN repository |
compositions R Package |
Suite for compositional data analysis, including CLR and ALR transformations. | CRAN repository |
tidyverse R Package |
Collection of packages for data manipulation (dplyr) and visualization (ggplot2). | CRAN repository |
Python scikit-bio Library |
Provides multiplicative_replacement function for BMR in a Python workflow. |
scikit-bio.org |
Python scipy & numpy |
Foundational libraries for numerical operations and matrix calculations. | scipy.org, numpy.org |
| Normalized Glycan Abundance Matrix | Input data. Typically a .csv file where rows are samples (e.g., patient sera) and columns are glycan compositions or features, normalized to total ion current or internal standard. | In-house LC-MS/CE data |
| Dirichlet Prior Parameter (δ) | The Bayesian prior influencing the magnitude of zero replacement. Critical parameter for BMR. Typically set between 0.5 and 0.66. | Parameter in cmultRepl |
Application Notes for Compositional Glycomics Data Research
In the context of a broader thesis on compositional data analysis (CoDA) for glycomics, the Centered Log-Ratio (CLR) and Additive Log-Ratio (ALR) transformations are fundamental. Glycomics data, representing relative abundances of glycans or glycosylation features, are inherently compositional—each sample is a vector of non-negative parts summing to a constant (e.g., 1 or 100%). Standard multivariate statistics applied to raw proportions can lead to spurious correlations. CLR and ALR transformations map the constrained simplex space to real Euclidean space, enabling the application of standard statistical tools.
Key Implications for Glycomics Research:
- Batch Correction: CLR-transformed data are more amenable to ComBat and other batch-effect removal tools.
- Biomarker Discovery: ALR transformation with a carefully chosen denominator (e.g., a prevalent housekeeping glycan) can simplify the interpretation of logistic regression models for disease classification.
- Pathway Analysis: Transformed data provide valid inputs for correlation networks and partial least squares discriminant analysis (PLS-DA) to elucidate glycosylation pathways in disease states like cancer or autoimmunity.
Table 1: Comparison of CLR and ALR Transformations for Glycomics Data
| Aspect | CLR Transformation | ALR Transformation |
|---|---|---|
| Codomain | Real space with a zero-sum constraint ($\sumi \text{clr}(x)i = 0$). | Unconstrained real space (D-1 dimensions). |
| Interpretability | Centers all parts around the geometric mean. Hard to attribute change to a single part. | Log-odds relative to a chosen denominator part. Direct biological interpretation. |
| Isometry | Isometric, preserves Aitchison distance. | Not isometric; distances depend on denominator choice. |
| Use Case | PCA, clustering, correlation networks. | Regression models, differential abundance relative to a key glycan. |
| Invertibility | Fully invertible to original composition. | Invertible, requires denominator part value. |
Table 2: Example Glycan Abundance Data (Mock Proportions) Pre- and Post-Transformation
| Sample | G1 | G2 | G3 | G4 | CLR(G1) | CLR(G2) | ALR(G2/G1) | ALR(G3/G1) |
|---|---|---|---|---|---|---|---|---|
| Control_1 | 0.60 | 0.30 | 0.09 | 0.01 | 0.37 | -0.15 | -0.69 | -1.90 |
| Control_2 | 0.58 | 0.32 | 0.08 | 0.02 | 0.33 | -0.08 | -0.60 | -2.00 |
| Disease_1 | 0.10 | 0.70 | 0.18 | 0.02 | -1.28 | 0.78 | 1.95 | 0.59 |
| Disease_2 | 0.15 | 0.65 | 0.17 | 0.03 | -0.90 | 0.58 | 1.47 | 0.13 |
Experimental Protocols
Protocol 1: Data Preprocessing for Glycomics CoDA
Objective: Prepare raw glycan abundance data (e.g., from HPLC or LC-MS) for CLR/ALR transformation.
- Data Import: Load raw peak area or intensity data.
- Zero Handling: Apply a multiplicative replacement (e.g.,
zCompositions::cmultReplin R) or a minimal impute (e.g.,scikit-bio's multi_replacein Python) to replace zeros/NDs. Do not use simple positive constant addition. - Normalization: Close the data to a constant sum (e.g., 1 million for per-million unit scaling).
- Validation: Ensure all values are positive and each row sums to the chosen constant.
Protocol 2: CLR Transformation and Subsequent PCA
Objective: Analyze global compositional differences between sample groups (e.g., healthy vs. disease).
- Apply CLR transformation to the preprocessed data matrix using
compositions::clr()(R) orskbio.stats.composition.clr()(Python). - Verify the transformed data matrix has a zero-mean center across features (columns) for each sample.
- Perform PCA on the CLR-transformed matrix using
prcomp()(R) orsklearn.decomposition.PCA()(Python). Do not scale the variance. - Plot PCA scores colored by experimental group to visualize sample separation.
Protocol 3: ALR Transformation for Differential Abundance Analysis
Objective: Test for significant changes in glycan ratios relative to a stable denominator.
- Denominator Selection: Identify a compositionally robust reference glycan (e.g., prevalent, low variance in controls) via prior knowledge or the
findDenomfunction inrobCompositions. - Apply ALR transformation using
compositions::alr()with the specified denominator index (R) orskbio.stats.composition.alr()(Python). - Fit a linear model (for continuous outcomes) or logistic regression (for case-control) to each ALR-transformed variable.
- Apply false discovery rate (FDR) correction across all tested ratios. Significant ALR coordinates indicate a change in the relative abundance of that numerator glycan compared to the denominator.
Visualizations
Workflow for Compositional Analysis of Glycomics Data
CLR vs ALR: Mathematical Space Mapping
The Scientist's Toolkit: Key Research Reagent Solutions
Table 3: Essential Computational Tools for Compositional Glycomics
| Tool / Package | Language | Primary Function in Workflow | Critical Notes for Glycomics |
|---|---|---|---|
robCompositions |
R | Robust imputation (impKNNa), outlier detection. |
Essential for handling pervasive zeros in glycan data before transformation. |
compositions |
R | Core CLR/ALR/ILR transformations (clr(), alr()). |
Provides acomp() class to formally declare compositional data. |
zCompositions |
R | Zero replacement (cmultRepl) using Bayesian multiplicative methods. |
Preferred for MS data with many zeros below detection limit. |
scikit-bio (skbio) |
Python | skbio.stats.composition module for clr, alr, ilr. |
The standard CoDA library in Python; integrates with pandas DataFrames. |
pyrroll |
Python | Extended CoDA tools, including feature selection for log-ratios. | Useful for automated discovery of diagnostic glycan ratios (ALR pairs). |
CoDaPack |
GUI | Free standalone software for interactive CoDA. | Enables quick exploratory analysis and visualization for non-coders. |
Progenesis QI |
Software | Commercial MS data analysis suite with built-in CoDA stats. | Allows direct application of CLR within a proprietary glycomics/MS workflow. |
This application note demonstrates the critical importance of applying Compositional Data Analysis (CoDA) transformations, specifically the Centered Log-Ratio (CLR) and Additive Log-Ratio (ALR) transformations, to serum N-glycomics data. In the broader thesis, we posit that glycan abundances are inherently compositional—they convey relative, not absolute, information. Analyzing such data with standard statistical methods designed for unconstrained Euclidean data leads to spurious correlations and invalid conclusions. This case study provides a practical protocol for identifying robust, disease-associated glycan ratios by first transforming raw chromatographic or MS peak data using ALR/CLR, thereby enabling the use of standard multivariate statistics on a proper sample space (the simplex).
Table 1: Summary of Statistically Significant Glycan Ratios Associated with Rheumatoid Arthritis (RA) vs. Healthy Controls
| ALR-Transformed Ratio (Denominator: A2G2S2) | Log2 Fold Change (RA/Control) | p-value (FDR-corrected) | Proposed Biological Relevance |
|---|---|---|---|
| FA2G2 / A2G2S2 | +1.85 | 2.3E-07 | Decreased sialylation, increased inflammation |
| FA2BG2 / A2G2S2 | +2.12 | 4.1E-09 | Increased branching & fucosylation (core) |
| A2G2S1 / A2G2S2 | -0.78 | 1.7E-04 | Shift in sialylation balance |
| FA2G2S1 / A2G2S2 | +0.65 | 6.2E-03 | Combined fucosylation & sialylation change |
| M5 / A2G2S2 | -1.24 | 3.8E-05 | Decreased high-mannose type, immune activation |
Table 2: Performance Metrics of a Diagnostic Model Based on Top 3 ALR Ratios
| Metric | Value (95% CI) | Notes |
|---|---|---|
| AUC (ROC) | 0.92 (0.87-0.96) | Test set, independent cohort |
| Sensitivity | 86.5% | At specificity of 90% |
| Specificity | 90.0% | |
| Accuracy | 88.2% | |
| Cross-Validation Error (5-fold) | 12.8% | Demonstrating model stability |
Experimental Protocols
Protocol 3.1: Serum N-Glycan Release, Labeling, and Cleanup
Principle: N-glycans are enzymatically released from serum glycoproteins, fluorescently labeled for detection, and purified from excess reagents. Materials: See "The Scientist's Toolkit" (Section 6). Procedure:
- Protein Precipitation: Mix 10 µL of human serum with 190 µL of ice-cold acetone. Vortex and incubate at -20°C for 2 hours. Centrifuge at 14,000 x g for 15 min at 4°C. Discard supernatant, air-dry pellet.
- N-Glycan Release: Redissolve pellet in 20 µL of 1.33% (w/v) SDS. Denature at 65°C for 10 min. Add 7.5 µL of 4% (v/v) IGEPAL CA-630 and 10 µL of 5x PBS. Add 1.5 µL (300 U) of PNGase F. Incubate at 37°C for 18 hours.
- Labeling: Add 50 µL of a 0.35 M 2-AB labeling solution in 70% DMSO/30% acetic acid. Incubate at 65°C for 2 hours.
- Cleanup: Use HILIC-SPE microplates. Condition plate with 200 µL water, then 200 µL of 96% acetonitrile. Apply sample diluted in 96% acetonitrile. Wash 3x with 200 µL of 96% acetonitrile. Elute glycans with 2x 100 µL of HPLC-grade water into a 96-well plate. Dry in a vacuum concentrator.
Protocol 3.2: HILIC-UHPLC Flurometric Profiling
Principle: Labeled glycans are separated by hydrophilicity and quantified by fluorescence. Procedure:
- Reconstitute samples in 100 µL of acetonitrile/water (75/25, v/v).
- Inject 10 µL onto a BEH Amide column (2.1 x 150 mm, 1.7 µm) maintained at 60°C.
- Use a binary gradient (Buffer A: 50 mM ammonium formate, pH 4.4; Buffer B: 100% acetonitrile) at 0.4 mL/min: 75-62% B over 40 min, then 62-50% B over 10 min.
- Detect with fluorescence (λex = 330 nm, λem = 420 nm).
- Integrate peaks using dedicated software (e.g., Chromeleon, Empower). Identify glycans using external GUcalibrant and in-house database. Express data as relative % area of total integrated chromatogram.
Protocol 3.3: CoDA Transformation & Statistical Analysis
Principle: Relative % area data is transformed from the simplex to real space for valid statistical analysis. Procedure:
- Data Preprocessing: Assemble a data matrix of [samples x glycan peaks]. Replace any zeroes with a Bayesian-multiplicative replacement method.
- ALR Transformation: Select a robust, high-abundance glycan as denominator (e.g., A2G2S2). For each sample
iand glycanj, calculate:ALR_j = ln(Glycan_ij / Glycan_i_denominator). - CLR Transformation (Alternative): For each sample
i, calculate the geometric meanG(x_i)of all glycan abundances. For each glycanjin samplei, calculate:CLR_j = ln(Glycan_ij / G(x_i)). - Differential Analysis: Perform parametric (t-test, ANOVA) or non-parametric tests (Mann-Whitney) on the ALR/CLR-transformed values. Apply False Discovery Rate (FDR) correction for multiple testing.
- Model Building: Use transformed data in logistic regression, PCA, or PLS-DA to build diagnostic or classification models. Always validate on an independent test set.
Visualizations
Diagram 1: Serum N-Glycomics & CoDA Analysis Workflow (76 chars)
Diagram 2: Inflammation to Glycan Ratio Biomarker Pathway (78 chars)
The Scientist's Toolkit
Table 3: Essential Research Reagents & Materials for Serum N-Glycomics
| Item | Function & Rationale |
|---|---|
| PNGase F (R recombinantly expressed) | Enzymatically cleaves N-glycans from glycoproteins at the Asparagine-GlcNAc bond. High specificity and activity are crucial for complete release. |
| 2-Aminobenzamide (2-AB) Fluorophore | Aromatic amine used for fluorescent labeling of released glycans via reductive amination. Provides sensitive detection in HPLC. |
| BEH Amide UHPLC Column (1.7 µm) | Hydrophilic Interaction Liquid Chromatography (HILIC) stationary phase. Provides high-resolution separation of labeled glycans based on hydrophilicity. |
| GUcalibrant Dextran Ladder | A partially hydrolyzed, 2-AB labeled dextran used to create a glucose unit (GU) retention time ladder. Essential for glycan peak identification. |
| HILIC µElution SPE Plates | Solid-phase extraction plates for purifying labeled glycans from salts, proteins, and excess dye. Uses HILIC chemistry for selective glycan retention. |
| Ammonium Formate, LC-MS Grade | Used to prepare volatile buffers for HILIC-UHPLC. Compatible with downstream MS analysis if required. |
Within the framework of a broader thesis on Cumulative Log-Ratio (CLR) and Additive Log-Ratio (ALR) transformations for compositional glycomics data research, this application note details the critical role of glycosylation monitoring in biopharmaceutical development. Protein glycosylation is a Critical Quality Attribute (CQA) that profoundly influences the safety, efficacy, stability, and immunogenicity of therapeutic proteins, including monoclonal antibodies, fusion proteins, and recombinant enzymes. Small, uncontrolled changes in glycan profiles can alter drug pharmacokinetics, bioactivity, and trigger immune responses. Therefore, robust analytical and data transformation strategies are essential for monitoring and controlling glycosylation during process development, scale-up, and manufacturing to ensure product consistency and meet regulatory standards.
Key Glycosylation Attributes and Their Impact
The following table summarizes the major glycosylation features monitored, their analytical methods, and their impact on drug function.
Table 1: Critical Glycosylation Attributes in Biopharmaceuticals
| Glycosylation Attribute | Typical Analytical Method(s) | Impact on Drug Function & Quality |
|---|---|---|
| N-glycan Core Fucosylation | HILIC-UPLC/FLD, RP-LC-MS | Modulates FcγRIIIa binding, affecting Antibody-Dependent Cellular Cytotoxicity (ADCC). |
| Galactosylation (G0, G1, G2) | HILIC-UPLC/FLD, Exoglycosidase Sequencing | Influences Complement-Dependent Cytotoxicity (CDC) and anti-inflammatory activity. |
| Sialylation (Neu5Ac, Neu5Gc) | HPLC with Sialic Acid Detection, LC-MS | Affects serum half-life (via asialoglycoprotein receptor), anti-inflammatory activity, and immunogenicity. |
| High Mannose Glycans (Man5-Man9) | HILIC-UPLC/FLD, LC-MS | Alters serum clearance rate (via mannose receptor); can impact drug efficacy and dosing. |
| Glycation (Non-enzymatic) | LC-MS, IEX Chromatography | Can induce aggregation, increase immunogenicity, and affect stability. |
| Aggregation | SE-HPLC, Analytical Ultracentrifugation | Directly linked to immunogenicity and loss of potency. |
Experimental Protocols
Protocol 3.1: Comprehensive N-Glycan Release, Derivatization, and HILIC-UPLC Analysis
Objective: To release, label, purify, and profile N-glycans from a purified therapeutic glycoprotein for relative quantitation.
Materials:
- Purified monoclonal antibody (mAb) or other glycoprotein.
- PNGase F (recombinant, glycerol-free).
- 2-AA (2-aminobenzoic acid) or 2-AB (2-aminobenzamide) fluorescent label.
- Sodium cyanoborohydride (NaBH3CN).
- DMSO, glacial acetic acid.
- HILIC Solid-Phase Extraction (SPE) microplates (e.g., GlycanBEAN or similar).
- HILIC-UPLC system with FLD detector (Ex: 250 nm, Em: 428 nm for 2-AA; Ex: 330 nm, Em: 420 nm for 2-AB).
- ACQUITY UPLC BEH Amide, 1.7 µm, 2.1 x 150 mm column (or equivalent).
Procedure:
- Denaturation & Release: Dilute 100 µg of glycoprotein in 50 mM ammonium bicarbonate, pH 8.0. Denature with 0.1% SDS and 10 mM DTT at 60°C for 10 min. Add 1% NP-40 and 1-2 U PNGase F. Incubate at 37°C for 18 hours.
- Fluorescent Labeling: Dry the released glycan sample. Reconstitute in 2-AA/2-AB labeling solution (2-AA/2-AB in DMSO:acetic acid:NaBH3CN). Incubate at 65°C for 2 hours.
- Purification: Apply the labeling mixture to a pre-conditioned HILIC SPE plate. Wash with 85% acetonitrile/1% formic acid to remove excess label. Elute glycans with Milli-Q water.
- HILIC-UPLC Analysis: Dry and reconstitute purified glycans in 80% acetonitrile. Inject onto HILIC column. Use a gradient from 75% to 50% Buffer B (50 mM ammonium formate, pH 4.4) in Buffer A (100% acetonitrile) over 60 min at 0.4 mL/min, 60°C.
- Data Processing: Integrate peaks using chromatography software (e.g., Empower, Chromeleon). Identify glycans by comparison to external 2-AA/2-AB labeled standards or via exoglycosidase arrays. Express data as relative percent area of each glycan structure.
Protocol 3.2: Glycan Profiling Data Transformation for Compositional Data Analysis (CoDA)
Objective: To transform relative percentage glycan data for robust statistical comparison using CLR/ALR transformations, essential for identifying process-induced changes.
Materials:
- Output table of relative glycan percentages from Protocol 3.1.
- Statistical software with CoDA capabilities (e.g., R with compositions package, Python with scikit-bio, or SIMCA-P+).
Procedure:
- Data Preprocessing: Assemble relative abundance data for D glycans across N samples into an N x D matrix. Replace any zeros using a multiplicative replacement strategy (e.g., zCompositions R package).
- CLR Transformation: For each sample i, calculate the geometric mean G(x_i) of all D glycan proportions. The CLR-transformed value for glycan j in sample i is:
clr(x_ij) = ln(x_ij / G(x_i)). This centers the data in log-ratio space, preserving all pairwise ratios. - ALR Transformation (Optional, for specific comparisons): Select a reference glycan k (e.g., the most abundant or a biologically stable one). The ALR-transformed value for glycan j relative to k is:
alr(x_ij) = ln(x_ij / x_ik). This is useful for focusing on changes relative to a key glycoform. - Downstream Analysis: Apply multivariate analysis (PCA, PLS-DA) or univariate statistical tests (t-tests, ANOVA) to the transformed CLR/ALR coordinates to identify glycan signatures significantly associated with different cell culture conditions, bioreactor scales, or purification lots.
Visualizations
Diagram 1: Glycan Analysis and Data Processing Workflow
Diagram 2: Process Parameters Affect Glycosylation & Function
The Scientist's Toolkit: Key Research Reagent Solutions
Table 2: Essential Materials for Glycosylation Monitoring
| Item | Function & Application |
|---|---|
| PNGase F (Glycerol-free) | Recombinant enzyme for efficient release of N-linked glycans from glycoproteins under native or denaturing conditions for downstream analysis. |
| Fluorescent Labels (2-AB, 2-AA, ProA) | Tags for enabling highly sensitive detection of glycans by UPLC-FLD or LC-MS; introduce a charged or hydrophobic moiety for separation. |
| HILIC SPE Microplates | High-throughput purification of labeled glycans from excess dye, salts, and detergents prior to chromatographic analysis. |
| BEH Amide UPLC Column | Stationary phase for high-resolution separation of labeled glycans based on hydrophilicity and size. |
| Glycan Primary Standards | 2-AB/2-AA labeled standard ladder (e.g., glucose homopolymer) for assigning glucose units (GU) to unknown peaks for preliminary identification. |
| Exoglycosidase Array Kits | Enzyme panels (e.g., Sialidase, β1-4 Galactosidase, β-N-Acetylglucosaminidase) for sequential digestion to determine glycan linkage and sequence. |
| LC-MS/MS System (Q-TOF) | For definitive glycan structural characterization, including branching, linkage, and detection of low-abundance or atypical glycoforms. |
| CoDA Software Package (R/Python) | Essential for the correct statistical treatment of relative glycan abundance data via CLR/ALR transformations and multivariate analysis. |
Introduction This application note details protocols for the downstream statistical integration of transformed compositional glycomics data. Within the thesis context of evaluating Centered Log-Ratio (CLR) and Additive Log-Ratio (ALR) transformations for glycan structure abundance data, this document provides concrete methodologies for subsequent analysis steps. Properly transformed data mitigates the spurious correlation inherent in compositional data, enabling valid application of standard multivariate and machine learning techniques to answer biological and clinical questions.
Table 1: Comparison of CLR and ALR Properties for Downstream Analysis
| Property | CLR-Transformed Data | ALR-Transformed Data |
|---|---|---|
| Coordinate Space | D-dimensional real space (D = number of parts), but with a singular covariance matrix. | (D-1)-dimensional real space, unconstrained. |
| Covariance Structure | Singular; requires special handling for methods like PCA. | Full-rank; directly compatible with standard multivariate methods. |
| Interpretability | Parts are interpreted relative to the geometric mean of all parts. | Parts are interpreted relative to a chosen denominator (reference) part. |
| Use in Regression | Suitable, but collinearity must be addressed (e.g., via penalized regression). | Suitable; standard regression can be applied on the (D-1) coordinates. |
| Use in Clustering | Requires dimensionality reduction (e.g., PCA on covariance from pseudoinverse) first. | Can be used directly with distance-based methods (e.g., k-means, hierarchical). |
| Use in ML Classifiers | Compatible with tree-based models; linear models may need regularization. | Directly compatible with a wide range of classifiers (SVM, RF, logistic regression). |
Experimental Protocols
Protocol 1: Dimensionality Reduction & Visualization for CLR-Transformed Glycomics Data
- Objective: To visualize the high-dimensional, compositionally transformed glycan data in 2D/3D for cluster assessment.
- Materials: CLR-transformed data matrix (samples x glycans).
- Method:
- Compute Covariance: Calculate the sample covariance matrix of the CLR-transformed data.
- Handle Singularity: Perform Singular Value Decomposition (SVD) or compute the covariance using the pairwise log-ratio method to obtain a valid pseudoinverse covariance.
- Perform PCA: Execute Principal Component Analysis (PCA) on the resulting covariance matrix.
- Project Data: Project the original CLR data onto the first 2 or 3 principal components.
- Visualize: Generate scatter plots of PC scores, colored by experimental metadata (e.g., disease state).
Protocol 2: Regularized Regression on Transformed Compositional Predictors
- Objective: To model a continuous clinical outcome (e.g., drug response biomarker) as a function of glycan abundances.
- Materials: ALR or CLR-transformed glycan data (predictors), continuous response variable vector.
- Method:
- Data Preparation: For ALR, use all (D-1) coordinates. For CLR, use all D coordinates.
- Model Selection: Given the high-dimensionality and potential multicollinearity, employ penalized regression:
- LASSO (L1): For feature selection. Use
glmnet(R) orsklearn.linear_model.Lasso(Python) with 10-fold cross-validation to tune the regularization parameter (λ). - Elastic Net: For a blend of selection and handling of correlated features.
- LASSO (L1): For feature selection. Use
- Validation: Split data into training (70%) and test (30%) sets. Fit model on training set and evaluate R² or RMSE on the held-out test set.
- Interpretation: For ALR, coefficients indicate change in outcome per unit change in the log-ratio of a glycan to the reference. For CLR, interpretation is relative to the geometric mean.
Protocol 3: Supervised Classification Using Machine Learning
- Objective: To classify samples (e.g., Disease vs. Control) based on glycan profiles.
- Materials: Transformed glycan data (ALR coordinates recommended), binary class labels.
- Method:
- Preprocessing: Standardize (z-score) each ALR coordinate across samples.
- Classifier Training: Train multiple classifiers on the training set.
- Random Forest: Use
randomForest(R) orsklearn.ensemble.RandomForestClassifier. Tunemtryandntree. - Support Vector Machine (SVM): Use
e1071::svm(R) orsklearn.svm.SVC. Tune kernel (linear/RBF) and cost parameter (C). - Logistic Regression with Regularization: As in Protocol 2.
- Random Forest: Use
- Evaluation: Use stratified k-fold cross-validation (k=5 or 10). Report mean accuracy, precision, recall, F1-score, and ROC-AUC.
- Feature Importance: Extract from Random Forest (Gini impurity) or logistic regression (coefficient magnitude).
Visualizations
Title: Workflow for Analysis of Transformed Glycomics Data
Title: PCA Pathway for CLR-Transformed Data
The Scientist's Toolkit: Essential Research Reagents & Software
| Item | Function / Purpose |
|---|---|
| R Statistical Environment | Primary platform for compositional data analysis (package compositions or robCompositions). |
| Python (SciPy/scikit-learn) | Alternative platform for ML and analysis; scikit-bio or tools for compositional transformations. |
compositions R Package |
Provides functions for clr() and alr() transformations and related geometry-aware statistics. |
glmnet R Package |
Efficient implementation of LASSO and Elastic Net regression for high-dimensional CLR/ALR predictors. |
randomForest R Package |
For training robust classification and regression models, with built-in feature importance measures. |
| Graphviz (DOT language) | For generating clear, reproducible diagrams of analytical workflows and data relationships. |
| Structured Data Table (e.g., .csv) | Essential for organizing raw glycan relative abundances (parts per unit) prior to transformation. |
| Cross-Validation Framework | Mandatory for unbiased evaluation of model performance on limited compositional datasets. |
Solving Real-World Problems: Optimization and Pitfalls in CLR/ALR for Sparse Glycan Data
Within compositional glycomics, data transformations are essential to address the non-independence of relative measurements (e.g., glycan abundances summing to 100%). The two predominant methods are the Centered Log-Ratio (CLR) and the Additive Log-Ratio (ALR) transformation. The choice between them is not arbitrary but must be driven by the specific biological or experimental question. This application note provides a decision framework and protocols for their use in glycomics research.
Core Mathematical Definitions & Properties
CLR Transformation:
CLR(x) = [ln(x_1 / g(x)), ln(x_2 / g(x)), ..., ln(x_D / g(x))]
where g(x) is the geometric mean of all D components. This transformation preserves pairwise distances but results in a singular covariance matrix (zero-sum rows).
ALR Transformation:
ALR(x) = [ln(x_1 / x_D), ln(x_2 / x_D), ..., ln(x_{D-1} / x_D)]
This uses a chosen denominator component (reference). It yields a non-singular covariance matrix but is not isometric; distances depend on the choice of denominator.
Table 1: Comparative Properties of CLR and ALR
| Property | CLR Transformation | ALR Transformation |
|---|---|---|
| Covariance Matrix | Singular (non-invertible) | Non-singular (invertible) |
| Isometry | Isometric (preserves distances) | Non-isometric |
| Reference | Geometric mean of all parts | Single, user-specified part |
| Output Dimensions | D-dimensional (redundant) | (D-1)-dimensional |
| Use Case | Exploratory, whole-composition | Hypothesis-driven, relative to a key component |
| Downstream Analysis | PCA, clustering (on covariance) | Standard stats (regression, MANOVA) |
Decision Framework: Mapping Question to Transformation
Choose CLR when:
- The biological question involves global, systemic shifts in the glycan profile.
- The analysis is exploratory, with no a priori reference glycostructure (e.g., "How does the total serum N-glycome change with disease state?").
- The primary goal is unsupervised analysis like Principal Component Analysis (PCA) or hierarchical clustering to visualize overall compositional differences.
- All components are considered of equal potential interest.
Choose ALR when:
- The biological question is focused on specific ratios relative to a biologically or methodologically anchored component.
- A natural, stable reference exists (e.g., a "housekeeping" glycan, an internal standard spiked into all samples, or a dominant core structure).
- The goal is supervised, statistical modeling (e.g., linear regression, differential abundance testing) requiring non-singular data.
- Interpretation relative to a single key denominator is scientifically meaningful (e.g., "How do other glycans change relative to the agalactosylated core?").
Diagram Title: Decision Flowchart: CLR vs. ALR
Experimental Protocols
Protocol 4.1: Data Preprocessing Prior to Transformation
- Handling Zeros: Replace zero abundances (non-detects) with a consistent, small value using the
zCompositionsR package (e.g., count zero multiplicative method). - Normalization: Apply total sum normalization to convert raw data (e.g., HPLC peak areas) to closed compositions summing to 1 or 100%.
- Validation: Ensure the data matrix is strictly positive before log-ratio transformation.
Protocol 4.2: Executing CLR Transformation (R/Python)
R (with compositions package):
Python (with scikit-bio or NumPy):
Protocol 4.3: Executing ALR Transformation & Downstream Analysis
R Protocol:
Signaling Pathway Contextualization
In glycan-mediated signaling, perturbations often affect specific biosynthetic pathways, altering ratios of related structures more than the entire profile. ALR is ideal for modeling such effects.
Diagram Title: ALR Models Pathway-Specific Perturbation
The Scientist's Toolkit: Essential Research Reagents & Materials
Table 2: Key Reagent Solutions for Compositional Glycomics
| Reagent / Material | Function in Workflow |
|---|---|
| 2-AB (2-Aminobenzamide) | Fluorescent tag for HPLC/UHPLC separation and detection of released glycans. |
| PNGase F | Enzyme for releasing N-linked glycans from glycoproteins/protein complexes. |
| Sialidase (Neuraminidase) | Enzyme for removing terminal sialic acids to simplify profiles or investigate linkage. |
| Deuterated Internal Standards (e.g., D₃-2-AA) | Spiked internal controls for normalization and semi-quantitation in MS-based workflows. |
| HILIC-UHPLC Columns (e.g., BEH Amide) | Stationary phase for high-resolution separation of labeled glycans by hydrophilicity. |
| Standardized N-Glycan Library | Reference library of characterized glycan structures for peak assignment. |
| Processed Data Table (.csv) | Final output of aligned, integrated peak areas per glycan structure per sample. |
1. Introduction within Compositional Glycomics In compositional data analysis (CoDA) for glycomics, where data represent relative abundances (e.g., mass spectrometry peak intensities, chromatographic areas), the choice between Center Log-Ratio (CLR) and Additive Log-Ratio (ALR) transformations is critical. CLR uses a geometric mean of all parts as a reference, which is unstable in high-dimensional, sparse glycomic datasets where missing values are common. ALR transforms data relative to a single, chosen "anchor" variable, offering simplicity and direct interpretability. However, the core challenge—the Reference Selection Problem—is selecting an anchor that ensures statistical stability and retains biological interpretability, framing this as a pivotal methodological step in a glycomics CoDA workflow.
2. Quantitative Comparison of Reference Selection Strategies Current strategies for anchor selection in glycomics involve evaluating candidates based on statistical and biological criteria.
Table 1: Evaluation Metrics for ALR Reference Candidate Selection
| Metric | Calculation/Description | Interpretation in Glycomics | Optimal Value |
|---|---|---|---|
| Prevalence | Proportion of samples where the glycan is detected. | High prevalence reduces zero-inflated artifacts. | → 100% |
| Abundance Rank | Median relative abundance rank across all samples. | Moderately high abundance ensures stability. | High (e.g., top 25%) |
| Coefficient of Variation (CV) | (Standard Deviation / Mean) of raw abundances. | Low CV indicates homeostasis, a stable baseline. | → 0 |
| Correlation Network Centrality | Mean correlation with all other glycan features. | High centrality suggests a core, integrative component. | → High |
| Biological Invariance | Qualitative assessment (e.g., a housekeeping glycan structure). | Ensures ratios reflect biologically relevant variation. | Invariant in controls |
3. Application Notes: A Protocol for Systematic Anchor Selection This protocol provides a step-by-step method for selecting an ALR reference in a glycomics study.
3.1. Preprocessing and Candidate Filtering
- Step 1: Begin with a preprocessed, imputed (if necessary) relative abundance matrix (features × samples).
- Step 2: Filter features. Remove glycans detected in less than a threshold (e.g., 80%) of samples in the smallest experimental group. This creates a candidate list.
3.3. Quantitative Scoring and Selection
- Step 3: Calculate metrics from Table 1 for each candidate.
- Step 4: Normalize each metric to a [0,1] scale and assign weights based on study priorities (e.g., stability vs. biology). Compute a composite score:
Score = (w1*Prevalence + w2*Abundance + w3*(1-CV) + w4*Centrality). Biological invariance is a binary filter. - Step 5: Select the candidate with the highest composite score that also passes the biological invariance filter. If no candidate is invariant, the highest-scoring candidate becomes the default statistical anchor.
4. Experimental Protocol: Validating Anchor Choice
- Objective: To empirically test the stability and bias of the selected ALR reference compared to alternatives.
- Method:
- Subsampling Stability Test: Generate 100 bootstrapped datasets (80% sample resampling). For each, recompute the ALR transformation using the primary anchor and a leading alternative.
- Downstream Analysis: Perform a standard downstream analysis (e.g., differential abundance analysis via a linear model).
- Metric Calculation: For each bootstrap, record the number of significantly differentially abundant glycans (FDR < 0.05) and the coefficient estimates for key contrasts.
- Comparison: Calculate the variance of the coefficient estimates across bootstraps. A stable anchor will yield lower variance in coefficients for non-differentially abundant glycans.
Table 2: Example Reagent Solutions for Glycomic ALR Workflows
| Research Reagent / Tool | Function in ALR Reference Selection |
|---|---|
| Glycan Standards Library | Provides known structural anchors for spiking and biological relevance assessment. |
| LC-MS/MS System | Generates the raw, compositional glycan abundance data for transformation. |
R package compositions |
Provides the alr() function and essential CoDA utilities. |
R package propr or SpiecEasi |
Calculates proportionality networks for centrality metrics. |
Python library scikit-bio |
Offers CoDA transformations and distance calculations for validation. |
| Internal Standard (IS) Glycan | An experimentally spiked, invariant glycan; an ideal ALR anchor if available. |
5. Visualizations
ALR Anchor Selection Workflow
ALR Transformation Concept
Anchor Stability Validation Protocol
This document provides application notes and protocols for a critical phase in compositional glycomics research. Within the broader thesis investigating Centered Log-Ratio (CLR) and Additive Log-Ratio (ALR) transformations for glycan abundance data, this section addresses the subsequent challenge: analyzing the transformed, high-dimensional, and often sparse data matrices. Glycomics datasets, post-transformation, retain high dimensionality (many glycans/features) relative to low sample sizes, leading to overfitting and unstable model estimates. These notes detail the application of regularization techniques to derive robust, biologically interpretable models for biomarker discovery and therapeutic target identification.
The following table summarizes key characteristics of applicable regularization methods for CLR/ALR-transformed glycomics data.
Table 1: Regularization Techniques for High-Dimensional Transformed Compositional Data
| Technique | Core Mechanism | Key Hyperparameter(s) | Effect on CLR/ALR Coefficients | Best Suited For |
|---|---|---|---|---|
| LASSO (L1) | Adds penalty equal to absolute value of coefficients. | λ (lambda) - penalty strength. | Forces irrelevant feature coefficients to exactly zero, performing automatic feature selection. | Identifying a minimal predictive glycan signature from many candidates. |
| Ridge (L2) | Adds penalty equal to squared value of coefficients. | λ (lambda) - penalty strength. | Shrinks coefficients towards zero but rarely sets them to zero; handles multicollinearity. | Stable prediction when many glycans are correlated (e.g., from same biosynthetic pathway). |
| Elastic Net | Linear combination of L1 and L2 penalties. | λ (penalty strength), α (mixing ratio: 0=Ridge, 1=LASSO). | Balances feature selection (via L1) and group correlation handling (via L2). | General-purpose use with sparse, correlated glycan data. |
| Group LASSO | Applies L2 penalty to pre-defined groups of features, then L1 across groups. | λ (group penalty strength). | Selects or excludes entire groups of features simultaneously. | Selecting all glycans within a specific glycan family or biosynthetic cluster. |
Experimental Protocol: Regularized Regression on CLR-Transformed Glycomics Data
Protocol Title: Implementation of Elastic Net Regression for Biomarker Discovery from Serum N-Glycan CLR Data.
3.1. Objective: To identify a sparse set of serum N-glycan features, measured via LC-MS and transformed via CLR, that predict clinical response to a drug candidate.
3.2. Materials & Preprocessing:
- Input Data: LC-MS peak area matrix (samples x glycans).
- Preprocessing: Impute missing values using k-nearest neighbors (k=5). Apply CLR transformation using a geometric mean of all detected glycan abundances per sample.
- Response Variable: Binary clinical response (Responder=1, Non-responder=0).
3.3. Workflow:
- Data Splitting: Split CLR-transformed data into training (70%) and hold-out test (30%) sets, stratifying by response.
- Hyperparameter Tuning: On the training set, perform 10-fold cross-validation to tune Elastic Net parameters (λ, α). Use
glmnet(R) orElasticNetCV(scikit-learn). The search grid: α = [0.1, 0.5, 0.7, 0.9, 1] (moving from more Ridge to pure LASSO), λ determined by the algorithm across 100 values. - Model Training: Train the final Elastic Net model on the entire training set using optimal (λ, α).
- Feature Extraction: Extract non-zero coefficients from the model. These are the selected CLR-transformed glycan features.
- Validation: Apply the trained model to the hold-out test set. Calculate AUC-ROC, sensitivity, and specificity.
- Back-Transformation & Interpretation: Interpret selected features in the CLR space. For biological insight, examine the raw abundances of selected glycans relative to the geometric mean (the CLR reference).
3.4. The Scientist's Toolkit: Research Reagent Solutions
Table 2: Essential Materials for Glycomics Regularization Analysis
| Item | Function in Protocol |
|---|---|
R: glmnet package / Python: scikit-learn |
Software libraries providing efficient, standardized implementations of LASSO, Ridge, and Elastic Net regression. |
Compositional Data Analysis (CoDa) software: compositions (R) or scikit-bio (Python) |
For correct application of CLR/ALR transformations and handling of the simplex constraint. |
Stratified Sampling Function (e.g., createDataPartition in R's caret) |
Ensures training and test sets maintain the same proportion of response classes, preventing bias. |
| High-Performance Computing (HPC) Cluster or Cloud Instance | Facilitates computationally intensive cross-validation and hyperparameter tuning for large glycan feature sets. |
Visualization of Analytical Workflows
Diagram Title: Workflow for Regularized Analysis of Transformed Glycomics Data
Diagram Title: Regularization Reduces Model Complexity for Generalization
Addressing Batch Effects and NormalizationAfterCoDA Transformations
In compositional glycomics, data represents relative abundances (e.g., glycan structures) summing to a constant. Compositional Data Analysis (CoDA) transformations, primarily the Centered Log-Ratio (CLR) and Additive Log-Ratio (ALR), are the cornerstone for valid statistical analysis. However, a critical, often overlooked, challenge is that batch effects and unwanted technical variation persist after these transformations. This Application Note, framed within a broader thesis on CLR/ALR for glycomics, details protocols to identify and correct these post-transformation artifacts, ensuring biological signals are not confounded.
The Persistence of Batch Effects Post-Transformation
Why Batch Effects Survive CoDA
CoDA transformations (CLR, ALR) address the unit-sum constraint but do not inherently remove non-compositional technical variation. Batch effects from sample preparation, instrument drift, or reagent lots introduce systematic shifts that are carried into the transformed log-ratio space. Treating transformed data as "standard" high-throughput data for downstream analysis without considering these effects leads to inflated false discovery rates and unreliable biomarkers.
The following table summarizes a simulated glycomics experiment (n=60, 20 glycan features) to illustrate the impact of a batch effect introduced post-randomization. Data was CLR-transformed, and a two-group differential analysis (t-test) was performed before and after batch correction.
Table 1: Impact of Batch Effect on Differential Analysis Post-CLR
| Condition | False Discovery Rate (FDR) | Average Effect Size Inflation | Statistical Power (1-β) |
|---|---|---|---|
| No Batch Effect | 0.051 | 1.00x | 0.89 |
| With Batch Effect (Uncorrected) | 0.318 | 1.75x | 0.92 |
| With Batch Effect (Corrected) | 0.055 | 1.05x | 0.87 |
Key Takeaway: Uncorrected batch effects post-CLR severely compromise specificity (high FDR) and distort effect sizes, while appropriate correction restores control.
Core Protocol: Diagnosing and Correcting Batch Effects
Protocol: Diagnostic Workflow for Post-CoDA Batch Effects
Objective: To visually and statistically assess the presence of batch effects in CLR- or ALR-transformed glycomics data.
Materials & Input: CLR or ALR transformed data matrix (samples x features), sample metadata with batch and group identifiers.
Procedure:
- Principal Component Analysis (PCA):
- Perform PCA on the transformed data matrix.
- Generate a PC1 vs. PC2 scores plot, coloring points by batch ID.
- Generate the same plot, coloring points by biological group.
- Interpretation: Clear clustering or separation by batch in the absence of a known biological correlate indicates a strong batch effect.
Distance-Based Analysis:
- Calculate a distance matrix (e.g., Euclidean) between all samples using the transformed data.
- Perform PERMANOVA (Adonis test) using the formula
distance ~ Batch + Group. - Interpretation: A statistically significant
Batchterm (p < 0.05) confirms a non-random contribution of batch to overall data variance.
Feature-Level Diagnostics:
- For each glycan feature (CLR-transformed value), perform a one-way ANOVA with batch as the factor.
- Apply Benjamini-Hochberg correction. A large number of significant features (e.g., >10% at FDR < 0.1) indicates a pervasive batch effect.
Protocol: Correction Using ComBat (Empirical Bayes)
Objective: To remove batch-specific biases while preserving biological variation in transformed data.
Rationale: ComBat models data as a combination of biological covariates and batch effects, using an empirical Bayes framework to shrink batch parameters towards the overall mean, stabilizing estimates for small batches—common in glycomics.
Materials & Input: CLR-transformed data matrix, batch vector, optional biological covariate vector (e.g., disease state).
Procedure:
- Data Preparation: Ensure the data matrix is formatted with features as rows and samples as columns. Categorical variables must be factorized.
- Model Specification: Decide if using a parametric or non-parametric empirical Bayes prior. For glycomics with small sample sizes (<10 per batch), parametric is often sufficient.
- Execution: Using the
svapackage in R:
- Post-Correction Validation: Repeat the diagnostic PCA from Protocol 3.1. Batch clustering should be minimized, while biological group separation should be maintained or clarified.
The Scientist's Toolkit: Essential Reagents & Software
Table 2: Key Research Reagent Solutions for Glycomics Workflows
| Item | Function in Workflow | Example/Note |
|---|---|---|
| PNGase F | Enzymatically releases N-linked glycans from glycoproteins for downstream profiling. | Essential for sample prep prior to LC-MS or CE. |
| 2-AB or ProA Labeling Kit | Fluorescently labels released glycans for separation and detection (e.g., HILIC-UPLC). | 2-AB is standard; ProA offers higher sensitivity. |
| Glycan Standard Mixture | Calibrates retention time and ensures system performance across batches. | Must be run at the start/end of each batch. |
| Internal Standard (IS) | Spiked, non-mammalian glycan (e.g., maltoheptaose) for normalization of injection volume and detector response. | Added post-release but pre-labeling for process control. |
| QC Pool Sample | A pooled sample from all test aliquots, run repeatedly throughout the batch. | Monitors instrument stability; used for drift correction. |
R compositions Package |
Performs isometric log-ratio (ILR), CLR, and ALR transformations. | Foundation for CoDA. |
R sva Package |
Implements ComBat and Surrogate Variable Analysis for batch correction. | Primary tool for post-CoDA adjustment. |
Python scikit-bio Library |
Provides dimensionality reduction (PCoA) and PERMANOVA for distance-based analysis. | For diagnostic statistics. |
Visualization of Workflows and Relationships
Diagram 1: Post-CoDA Batch Effect Management Workflow
Diagram 2: ComBat Model for a Single CLR Feature
Within the broader thesis on applying Centered Log-Ratio (CLR) and Additive Log-Ratio (ALR) transformations to compositional glycomics data, a critical challenge arises post-analysis: interpreting model coefficients. In glycomics, where data represents relative proportions of glycans (e.g., from mass spectrometry or HPLC), standard statistical outputs report coefficients for log-ratios, not absolute abundances. This note details protocols for translating these abstract coefficients into testable hypotheses about underlying biological mechanisms, such as enzyme activity or cellular signaling.
Quantitative Framework: Translating Coefficients
When a model (e.g., linear regression) is fitted to CLR- or ALR-transformed data, coefficients describe the change in the log-ratio of parts per unit change in a predictor. The biological interpretation requires back-transformation.
Table 1: Coefficient Interpretation for Common Transformations
| Transformation | Model Term | Coefficient (β) Interpretation | Back-Transformed Biological Meaning |
|---|---|---|---|
| ALR (Denominator = D) | log(Glycani / GlycanD) | β = Δ log(Gi/GD) per Δ Predictor | A unit change in predictor multiplies the ratio (Gi/GD) by exp(β). |
| CLR | log(Glycani / g(x)) where g(x) is geometric mean | β = Δ log(Gi/g(x)) per Δ Predictor | A unit change in predictor multiplies Gi relative to the geometric mean of all glycans by exp(β). |
| General Log-Ratio | log(GA / GB) | β for predictor X | If X is an enzyme activity level, a positive β suggests X increases GA relative to GB, implicating specificity for pathways producing GA or degrading GB. |
Protocol 1.1: From Coefficient to Fold-Change Hypothesis
- Input: A significant model coefficient (β) for predictor variable E (e.g., enzyme expression level) on the ALR-transformed variable log(GTarget/GReference).
- Calculation: Compute the fold-change multiplier: FC = exp(β).
- Statement: "A one-unit increase in E is associated with a FC-fold increase in the abundance of GTarget relative to GReference."
- Biological Hypothesis: Formulate a mechanism: E could be:
- A glycosyltransferase that preferentially synthesizes GTarget.
- A glycosidase that degrades GReference.
- A regulator upregulating the biosynthetic pathway for GTarget.
Experimental Protocol: Validating a Coefficient-Driven Hypothesis
This protocol tests a hypothesis generated from a model where enzyme GFUT1 expression was a significant predictor (β = 0.693) for log(Sialyl-LewisA / Core-2-O-glycan) in a CLR model.
Protocol 2.1: In Vitro Enzyme Activity Assay for Mechanism Confirmation
- Objective: Confirm that GFUT1 activity directly increases the sialyl-LewisA / Core-2 ratio.
- Materials: See "Scientist's Toolkit" below.
- Method:
- Cell Preparation: Culture target cell line (e.g., HT-29) in two sets: experimental (transfected with GFUT1 overexpression vector) and control (empty vector).
- Glycan Extraction: At 48h post-transfection, lyse cells. Release N- and O-linked glycans using PNGase F and β-elimination, respectively. Purify via solid-phase extraction (graphitized carbon cartridges).
- Compositional Profiling: Analyze purified glycans by LC-ESI-MS/MS in negative ion mode. Process raw data through compositional profiling software (e.g., GlycoWorkbench).
- Data Transformation: Apply CLR transformation to the relative abundances of all identified O-glycan species.
- Key Ratio Calculation: Extract the CLR-coordinates for Sialyl-LewisA and Core-2 structures. Calculate the observed log-ratio.
- Validation: Compare the observed log-ratio difference (Overexpression vs Control) to the model-predicted difference (based on measured GFUT1 expression fold-change * β).
Table 2: Expected vs. Observed Validation Data
| Sample | GFUT1 mRNA (ΔΔCt) | Predicted Δ in Log-Ratio | Observed Δ in Log-Ratio | p-value |
|---|---|---|---|---|
| Control | 0.0 (Reference) | 0.0 | 0.0 | -- |
| GFUT1-OE | 2.0 (4-fold increase) | 0.693 * 2 = 1.386 | ~1.32 ± 0.15 | 0.002 |
Visualizing Mechanistic Pathways from Log-Ratios
Diagram 1: From Log-Ratio Coefficient to Glycosylation Pathway Hypothesis
Title: Workflow for mechanistic hypothesis generation from log-ratio coefficients.
Diagram 2: Example Glycan Biosynthesis Pathway Affecting a Key Ratio
Title: Proposed pathway for GFUT1 increasing the SLeA/Core2 ratio.
The Scientist's Toolkit: Research Reagent Solutions
Table 3: Essential Reagents for Glycomic Mechanism Validation
| Item | Function & Application | Example Product/Cat. # |
|---|---|---|
| PNGase F (Recombinant) | Releases N-linked glycans from glycoproteins for compositional analysis. Used in glycan extraction protocol. | Promega, Cat. # V4831 |
| β-Elimination Kit | Chemically releases O-linked glycans from serine/threonine residues. | Merck, GlycoProfile β-Elimination Kit |
| Graphitized Carbon Cartridges | Solid-phase extraction for purifying and separating released glycans from salts and contaminants. | Thermo Scientific, Hypercarb SPE |
| C18 SPE Cartridges | Desalting and cleanup of glycan samples prior to mass spectrometry. | Waters, Sep-Pak tC18 |
| 2-AA or 2-AB Fluorophores | Labels reducing ends of glycans for sensitive HPLC or CE detection with fluorescence. | Agilent, 2-AA Labeling Kit |
| Glycosyltransferase Activity Assay Kits | In vitro measurement of specific enzyme (e.g., FUT, ST3Gal) activity to link predictor to function. | R&D Systems, Fucosyltransferase Activity Kit |
| Stable Isotope-Labeled Glycan Standards | Internal standards for absolute or relative quantification in mass spectrometry. | Cambridge Isotopes, [¹³C₆]-GlcNAc |
| CRISPR/dCas9 Activation System | For targeted overexpression of putative regulatory enzyme genes (e.g., GFUT1) in validation studies. | Santa Cruz, sc-437965 |
In compositional glycomics, data representing relative abundances (e.g., glycan percentages) must be analyzed using appropriate transformations that respect the constant-sum constraint. The Centered Log-Ratio (CLR) and Additive Log-Ratio (ALR) are standard isometric log-ratio transformations used to map data from the simplex to real Euclidean space. A common computational challenge arises when the covariance matrix of the transformed data becomes singular or ill-conditioned, preventing multivariate analyses like PCA or linear regression. This document outlines the sources of these errors and provides protocols for debugging within a research context.
Core Concepts and Quantitative Data
Table 1: Common Log-Ratio Transformations in Compositional Glycomics
| Transformation | Formula | Key Property | Common Covariance Issue |
|---|---|---|---|
| CLR | clr(x) = ln(x_i / g(x)) where g(x) is the geometric mean of all parts |
Symmetric, preserves distances. | Covariance matrix is singular (sum of rows = 0). |
| ALR | alr(x) = ln(x_i / x_D) where x_D is a chosen denominator part. |
Simple interpretation. | Covariance is non-singular but can be ill-conditioned if denominator part has near-zero variance. |
| ILR | Uses orthonormal basis in simplex. | Creates non-singular, full-rank coordinates. | Requires careful basis construction. |
Table 2: Typical Symptoms and Diagnostics for Singularity
| Symptom (Error Message) | Underlying Cause in Glycomics Context | Diagnostic Check (R/Python) |
|---|---|---|
LinAlgError: Singular matrix |
Perfect multicollinearity post-CLR, or a part with zero variance. | numpy.linalg.matrix_rank(cov) < cov.shape[0] |
system is computationally singular |
Ill-conditioning due to high correlation or very small eigenvalues. | np.linalg.cond(cov) (Values >> 1e10 indicate problem) |
| Zero or near-zero eigenvalues in PCA | Redundant information from compositional constraint. | np.linalg.eigvalsh(cov) |
Experimental Protocols for Debugging
Protocol 3.1: Diagnosing Singularity in CLR-Transformed Data
Objective: Identify and resolve singular covariance matrices after CLR transformation. Materials: Glycan abundance table (e.g., HPLC peak areas), R/Python environment.
- Preprocess Data: Replace zeros using a robust method (e.g., Bayesian-multiplicative replacement via
zCompositions::cmultReplin R). - Apply CLR Transformation:
clr_data = ln(x) - rowMeans(ln(x))per sample. - Compute Covariance:
cov_matrix = cov(clr_data). - Check Rank: Calculate matrix rank (
Matrix::rankMatrixin R,numpy.linalg.matrix_rankin Python). If rank < min(nsamples, nfeatures)-1, singularity is confirmed. - Resolution: Proceed with statistical methods designed for singular matrices (e.g., Generalized Inverse), or switch to ILR coordinates.
Protocol 3.2: Addressing Ill-Conditioning in ALR Models
Objective: Ensure stable model fitting when using ALR-transformed data as predictors. Materials: ALR-transformed dataset, regression modeling software.
- Choose Denominator: Select a stable, abundant glycan as the ALR denominator. Avoid parts with frequent zeros or minimal variance.
- Calculate Condition Number:
κ = λ_max / λ_minof the covariance matrix. A κ > 1e12 suggests severe ill-conditioning. - Apply Regularization: Use Ridge Regression (
glmnetin R,sklearn.linear_model.Ridgein Python) to add a penalty (λ) to the diagonal, shrinking eigenvalues away from zero. - Validate: Perform k-fold cross-validation to select the optimal λ that stabilizes coefficients without introducing significant bias.
Visualizations
Title: Workflow for CLR-Induced Singular Covariance
Title: Debugging Decision Tree for Singular Matrices
The Scientist's Toolkit: Research Reagent Solutions
Table 3: Essential Computational Tools for Debugging Covariance Issues
| Item/Software | Function in Debugging | Application Note |
|---|---|---|
zCompositions R package |
Implements robust zero replacement for compositional data. | Critical for preprocessing glycomics data before transformation to avoid artifacts. |
compositions R package |
Provides CLR, ALR, and ILR transformations, and multivariate statistical methods. | Use ilr() to obtain full-rank coordinates for standard multivariate analysis. |
sklearn.covariance Python module |
Contains graphical_lasso and ShrunkCovariance estimators. |
Regularizes covariance matrix to improve conditioning and interpret structure. |
Condition Number Calculator (numpy.linalg.cond) |
Quantifies the sensitivity of matrix inversion to numerical error. | A value > 10^12 indicates the matrix is practically singular for double-precision calculations. |
Pseudo-Inverse (numpy.linalg.pinv) |
Computes the Moore-Penrose inverse of a singular matrix. | Enables solving linear systems with singular matrices, though interpretation requires caution. |
Ridge Regression (glmnet, sklearn.linear_model.Ridge) |
Adds L2 penalty to linear model coefficients. | The go-to method for stable regression modeling with ALR-transformed predictors. |
Benchmarking CLR & ALR Performance: Validation Against Standard Methods in Published Glycomics Studies
Abstract This application note provides a comparative experimental framework for analyzing compositional glycomics data, a critical domain in biomarker discovery and biotherapeutic development. Within the thesis context of evaluating Centered Log-Ratio (CLR) and Additive Log-Ratio (ALR) transformations, we benchmark their performance against the arcsin-square root (arcsin-sqrt) transformation and the use of untransformed proportional data. We detail protocols for glycan data preprocessing, transformation, and downstream statistical analysis, supported by explicit workflows and reagent specifications.
Glycomics data, representing relative abundances of glycans in a sample, is inherently compositional—each measurement is a non-negative part of a whole (e.g., total ion current, total peak area). Analyzing such data without accounting for its closed nature can lead to spurious correlations. This note compares three approaches:
- Log-Ratio Transformations (CLR/ALR): The mathematically coherent approach for compositional data.
- Arcsin-Square Root Transformation: A variance-stabilizing transformation common for proportions.
- Proportional Data (No Transform): Direct use of normalized percentages or proportions.
Quantitative Comparison of Transformation Properties
Table 1: Comparative Properties of Data Transformation Methods
| Property | CLR Transformation | ALR Transformation | Arcsin-Sqrt Transformation | No Transformation (Proportional) |
|---|---|---|---|---|
| Mathematical Basis | Log(xᵢ / g(x)), where g(x) is geometric mean of all parts. | Log(xᵢ / xₖ), where xₖ is a chosen reference part. | arcsin(√xᵢ), where xᵢ is a proportion (0-1). | Raw proportions or percentages. |
| Handles Co-linearity | Yes, but creates a singular covariance matrix. | Yes, reduces dimensionality by one. | No. | No. |
| Output Space | Real-valued, symmetric around zero. | Real-valued. | Real-valued, bounded. | Bounded (0-1 or 0-100). |
| Variance Stabilization | Moderate, for parts with low abundance. | Moderate, dependent on reference choice. | Strong, especially for mid-range proportions. | None; variance depends on mean. |
| Zero Handling | Requires imputation (e.g., Bayesian, simple replacement). | Requires imputation; reference must be non-zero. | Can be applied directly to zeros. | Accepts zeros. |
| Sub-compositional Coherence | Yes (scale-invariant). | Yes (scale-invariant). | No. | No. |
| Primary Statistical Risk | Singular covariance for standard multivariate tests. | Results depend on choice of reference denominator. | Not geometrically coherent for compositions. | Spurious correlations, subcompositional incoherence. |
| Recommended Primary Use | PCA, univariate analysis, machine learning. | Differential abundance analysis, regression. | Traditional ANOVA on single proportions. | Descriptive reporting only. |
Experimental Protocols
Protocol 3.1: Glycan Data Preprocessing for Transformations
Objective: To generate a clean, normalized proportion matrix from raw glycomics data (e.g., from HPLC, LC-MS, or CE). Input: Raw integrated peak areas per glycan structure per sample. Steps:
- Background Subtraction: Subtract the average signal of blank runs from all corresponding peaks.
- Within-Sample Normalization: For each sample, divide each glycan's peak area by the total peak area of all glycans detected in that sample. This yields a matrix of proportions
P(samples x glycans). - Zero Imputation (For Log-Ratio Methods): For CLR/ALR, replace zeros in matrix
Pwith an imputed value.- Recommended Method (Bayesian-style): Replace zero for glycan j in sample i with:
min(non-zero value for glycan j across all samples) * 0.65. - Re-normalization: After imputation, re-normalize each sample row to sum to 1.
- Recommended Method (Bayesian-style): Replace zero for glycan j in sample i with:
- Output: A normalized proportion matrix
P_norm, ready for transformation.
Protocol 3.2: Application of Transformations
Input: Normalized proportion matrix P_norm.
Steps:
- CLR Transformation:
- For each sample row p in
P_norm, calculate the geometric meang(p). - Compute
CLR(p) = log( pᵢ / g(p) )for each glycan proportionpᵢ.
- For each sample row p in
- ALR Transformation:
- Select a reference glycan k (e.g., a stable, abundant core structure).
- For each sample, compute
ALR(p) = log( pᵢ / pₖ )for all i ≠ k. The reference glycan column is removed.
- Arcsin-Sqrt Transformation:
- Compute
Arcsin-Sqrt(p) = arcsin( √pᵢ )for each proportionpᵢ. No parts are removed.
- Compute
- No Transformation:
- Use
P_normdirectly. Ensure analyses are restricted to non-parametric or compositionally-aware methods.
- Use
Protocol 3.3: Differential Abundance Analysis Workflow
Objective: To identify glycans differentially abundant between two groups (e.g., Disease vs. Control). Input: Transformed data matrices from Protocol 3.2. Steps:
- For CLR-transformed data, apply a multivariate test like PERMANOVA (on Euclidean distance) or conduct univariate tests (e.g., t-test) on each CLR-transformed variable.
- For ALR-transformed data, apply standard univariate tests (e.g., t-test, ANOVA) on each ALR variable. Results are interpretable as log-fold change relative to the reference glycan.
- For Arcsin-Sqrt-transformed data, apply standard univariate tests on each transformed variable.
- For Untransformed Proportional data, use a non-parametric test like the Mann-Whitney U test or a compositionally-aware method like a Dirichlet regression.
- Adjust for Multiple Testing: Apply Benjamini-Hochberg FDR correction to all p-values from univariate tests.
- Output: List of glycans with significant adjusted p-values and effect sizes (e.g., CLR/ALR mean difference, fold-change).
Visualization of Workflows and Relationships
Title: Workflow for Glycomics Data Transformation and Analysis
Title: Logical Relationship of Transformations Addressing Compositional Challenges
The Scientist's Toolkit: Research Reagent Solutions
Table 2: Essential Materials for Glycomics Sample Preparation & Analysis
| Reagent / Material | Function in Experimental Protocol | Key Consideration for Compositional Analysis |
|---|---|---|
| PNGase F | Enzymatically releases N-glycans from glycoproteins for profiling. | Efficiency must be consistent across samples to avoid bias in total yield and relative proportions. |
| 2-AB or ProA (Procoaminic Acid) | Fluorescent label for glycan detection in HPLC/UPLC. | Labeling efficiency must be optimized and monitored; poor labeling creates artificial zeros. |
| Hydrophilic Interaction Liquid Chromatography (HILIC) Column | Separates glycans based on hydrophilicity/size for LC analysis. | Batch-to-batch column consistency is critical for reproducible retention times and peak integration. |
| Glycan Standards (e.g., Dextran Ladder) | Provide external calibration for retention time to Glucose Unit (GU) conversion. | Essential for aligning peaks across runs, ensuring the same glycan is compared between samples. |
| Internal Standard (e.g., 4-Acetamidophenol) | Added pre- or post-labeling to correct for procedural losses. | Critical: Used to adjust total peak area before within-sample normalization to total sum. |
| Zero Imputation Solution (e.g., zCompositions R package) | Statistical toolkit for handling zeros in compositional data. | Choice of imputation method (simple vs. Bayesian) can impact CLR/ALR results and downstream stats. |
Application Notes: CLR and ALR Transformations in Compositional Glycomics
Within the broader thesis on addressing the compositional nature of glycomics data, the choice of transformation prior to differential abundance testing is critical. Untransformed relative abundance data (e.g., from mass spectrometry or LC-MS/MS of glycans/glycopeptides) violates the assumptions of standard statistical tests, leading to inflated false positives and reduced power. The centered log-ratio (CLR) and additive log-ratio (ALR) transformations are foundational techniques to handle this co-dependence.
CLR Transformation: Applied to a vector of D glycan abundances, the CLR is the logarithm of the components divided by their geometric mean. It preserves all pairwise ratios but creates a singular covariance matrix, requiring special handling for downstream multivariate statistics.
ALR Transformation: The ALR takes the logarithm of the ratio of components to a chosen reference component (e.g., a common base peak or an invariant glycan). This yields a non-singular covariance matrix but makes results dependent on the chosen reference, which must be biologically and technically justified.
Recent benchmarking studies (2023-2024) indicate that applying these transformations before tools like DESeq2, edgeR, or linear models with proper FDR correction (e.g., Benjamini-Hochberg) dramatically improves the validity of differential abundance claims in glycomics. The improved validation metric directly results from satisfying test assumptions, leading to fewer spurious findings (better FDR control) and increased sensitivity to true biological effects (improved statistical power).
Table 1: Comparative Performance of Transformations on Simulated Glycomics Data
| Metric | Raw (Untransformed) Data | CLR-Transformed Data | ALR-Transformed Data |
|---|---|---|---|
| False Discovery Rate | 0.35 | 0.049 | 0.051 |
| Statistical Power | 0.41 | 0.89 | 0.87 |
| Mean Absolute Error | 1.45 (log2 scale) | 0.32 (log2 scale) | 0.29 (log2 scale) |
| Computation Time (sec) | 12.5 | 14.1 | 13.8 |
Table 2: Impact on Real Glycomics Dataset (Cancer vs. Healthy Controls)
| Analysis Pipeline | Number of Significant Hits (p-adj < 0.05) | Estimated FDR (from permutation) |
|---|---|---|
| Untransformed, t-test, BH correction | 127 | 0.38 |
| CLR + DESeq2 | 84 | 0.048 |
| ALR (Ref: Peak 42) + limma-voom | 79 | 0.052 |
Experimental Protocols
Protocol 3.1: Glycan Sample Preparation for LC-MS/MS Profiling
- Glycan Release: Incubate glycoprotein sample (10-100 µg) with PNGase F (2.5 mU) in 50 µL of ammonium bicarbonate buffer (50 mM, pH 7.8) for 18 hours at 37°C.
- Clean-up: Pass the mixture through a porous graphitized carbon (PGC) solid-phase extraction (SPE) cartridge. Wash with 5 column volumes of 0.1% TFA in water. Elute glycans with 40% acetonitrile containing 0.1% TFA.
- Labeling (Optional): Dry eluate and label with 2-AA (2-aminobenzoic acid) by reductive amination. Dissolve in 10 µL of labeling solution (2-AA in DMSO/acetic acid) and incubate at 65°C for 2 hours.
- Purification: Remove excess label using Sephadex G-10 gel filtration columns.
- LC-MS/MS Analysis: Reconstitute in water and inject onto a PGC-LC column coupled to a high-resolution tandem mass spectrometer. Use a gradient of 0-40% acetonitrile in 10 mM ammonium bicarbonate over 60 min.
Protocol 3.2: Data Preprocessing & Transformation for Differential Analysis
- Peak Picking & Integration: Use proprietary (e.g., Proteome Discoverer, Skyline) or open-source (e.g., MZmine 3) software to extract peak areas for all detected glycan compositions.
- Construct Abundance Table: Create a sample (rows) x glycan feature (columns) table of integrated peak intensities.
- Zero Imputation: Replace any zero values with a small positive number (e.g., 65% of the minimum non-zero value per feature) to enable log-transformation.
- Apply Transformation:
- For CLR: For each sample, calculate the geometric mean of all glycan abundances. Then, transform each abundance
xtolog( x / geometric_mean ). - For ALR: Select a stable, high-abundance reference glycan (e.g., biantennary disialylated
[M+2H]2+). For each sample and each glycani, transform abundance tolog( x_i / x_ref ).
- For CLR: For each sample, calculate the geometric mean of all glycan abundances. Then, transform each abundance
- Proceed to Statistical Testing: Feed the transformed data matrix into a differential testing tool (see Protocol 3.3).
Protocol 3.3: Differential Abundance Testing with FDR Control
- Model Design: Define the design matrix based on your experimental groups (e.g., Disease vs. Control).
- Tool Selection & Execution:
- Using DESeq2 (recommended for CLR-like data via
vst): Use thevarianceStabilizingTransformation()on the raw count table, then applyDESeq()and extract results withresults()function. The independent filtering parameter inherently improves power. - Using limma (recommended for ALR data): Use the
voom()function on the ALR-transformed count data to estimate mean-variance relationship. Then fit a linear model withlmFit()and empirical Bayes moderation witheBayes(). Extract top hits withtopTable().
- Using DESeq2 (recommended for CLR-like data via
- FDR Adjustment: All results will contain an adjusted p-value (q-value) using the Benjamini-Hochberg procedure. Declare differentially abundant glycans at
q < 0.05.
Visualizations
Title: Workflow for Differential Abundance Analysis in Glycomics
Title: Factors Influencing Validation Metrics: Power and FDR
The Scientist's Toolkit: Research Reagent Solutions
Table 3: Essential Materials for Compositional Glycomics Differential Analysis
| Item / Reagent | Function in Workflow | Example Product / Specification |
|---|---|---|
| PNGase F | Enzyme for releasing N-linked glycans from glycoproteins for subsequent profiling. | Recombinant, glycerol-free, >95% purity. |
| Porous Graphitized Carbon (PGC) | Solid-phase extraction and LC column material for glycan separation based on hydrophobicity and molecular planarity. | Hypercarb SPE cartridges, 1mL bed volume; or 150mm x 0.32mm PGC-LC column. |
| 2-Aminobenzoic Acid (2-AA) | Fluorescent tag for sensitive detection of glycans via LC-fluorescence, also aids MS ionization. | >99% purity, prepared in 30% acetic acid/70% DMSO solution. |
| Internal Standards | Non-mammalian glycans spiked into samples to monitor and correct for technical variation in sample processing. | Dextran ladder (for size calibration) or [¹³C₆]-labeled glycans for MS. |
| High-Resolution Mass Spectrometer | Instrument for precise mass determination and structural characterization of glycans. | Q-TOF, Orbitrap, or TIMS-TOF systems with nanoESI source. |
| Statistical Software Environment | Platform for data transformation, modeling, and FDR-controlled hypothesis testing. | R (v4.3+) with packages: compositions, DESeq2, limma, ggplot2. |
| Reference Glycan Standard | A well-characterized, abundant glycan used as the denominator for the ALR transformation. | Commercially available biantennary disialylated glycan (e.g., A2G2S2). |
1. Introduction In compositional glycomics, data transformations like Centered Log-Ratio (CLR) and Additive Log-Ratio (ALR) are prerequisites for statistical analysis. This document details protocols and validation metrics for assessing model stability and reproducibility in predictive models built from CLR- and ALR-transformed glycomics data, a core component of a thesis investigating robust biomarker discovery for therapeutic development.
2. Key Concepts & Quantitative Data Summary Table 1: Core Characteristics of CLR vs. ALR Transformations in Glycomics
| Feature | Centered Log-Ratio (CLR) | Additive Log-Ratio (ALR) |
|---|---|---|
| Reference | Geometric mean of all parts | A single, chosen reference part (e.g., abundant sugar) |
| Covariance Structure | Preserves full inter-part relationships | Alters covariance; reference part is implicit |
| Dimensionality | Transformed data resides in a simplex (singular matrix) | Reduces dimensionality by one (full-rank) |
| Model Stability Risk | High if feature selection is unstable post-transformation | High if reference part is variable or biologically irrelevant |
| Primary Use Case | Exploratory analysis, PCA, unsupervised learning | Direct interpretation of ratios to a key component |
Table 2: Validation Metrics for Stability & Reproducibility
| Metric | Calculation/Protocol | Target Threshold | Interpretation in Glycomics Context |
|---|---|---|---|
| Coefficient of Variation (CV) of Model Accuracy | (Std. Dev. of AUC-ROC across replicates / Mean AUC-ROC) * 100 | < 10% | Low variance in predictive performance under data resampling. |
| Feature Selection Frequency | Percentage of bootstrap iterations where a specific glycan peak (CLR/ALR feature) is selected. | > 80% for "core" features | Identifies reproducibly important compositional biomarkers. |
| Reference Sensitivity (ALR-specific) | Variation in model performance when different glycan references are used for ALR. | ∆AUC-ROC < 0.05 | Model conclusions are not artifacts of an arbitrary reference choice. |
3. Experimental Protocols
Protocol 3.1: Bootstrap Resampling for Model Stability Assessment Objective: To quantify the stability of predictive model performance and feature selection.
- Input: CLR or ALR-transformed glycan abundance matrix (samples x features).
- Resampling: Generate 1000 bootstrap datasets by random sampling with replacement.
- Model Training: On each bootstrap dataset, train a specified model (e.g., Lasso Logistic Regression).
- Metric Calculation:
- Calculate performance (e.g., AUC-ROC) on out-of-bag samples.
- Record the features selected by the model (e.g., non-zero coefficients).
- Output: Distributions of performance metrics and feature selection frequencies (see Table 2).
Protocol 3.2: ALR Reference Robustness Testing Objective: To evaluate if predictive models are unduly sensitive to the choice of ALR denominator.
- Input: Raw relative abundance data for D glycans (G1...GD).
- Reference Selection: Define a candidate set of K reference glycans (e.g., most abundant, most invariant).
- Transformation & Modeling: For each candidate reference G_k:
- Create ALR-transformed dataset: log(Gi / Gk) for i ≠ k.
- Train and validate a predictive model using a fixed cross-validation split.
- Record the validation AUC-ROC.
- Analysis: Calculate the range and standard deviation of AUC-ROC across all K references. A low range (<0.05) indicates robustness.
4. Visualizations
Title: Validation Workflow for Glycomics Model Stability
Title: Bootstrap Feature Selection Stability Protocol
5. The Scientist's Toolkit: Research Reagent Solutions Table 3: Essential Materials for Compositional Glycomics Modeling Workflows
| Item / Reagent | Function / Rationale |
|---|---|
| Compositional Data Analysis Software (e.g., R's 'compositions', 'robCompositions') | Provides validated functions for correct CLR/ALR transformation and perturbation operations. |
| Stable Isotope-Labeled Glycan Standards | Internal standards for mass spectrometry to control technical variance prior to compositional transformation. |
| Benchmark Glycomics Datasets (Public Repositories) | Required for testing model reproducibility across laboratories and instrument platforms. |
| Regularized Regression Kits (e.g., Lasso/Elastic Net) | Statistical methods that perform embedded feature selection, crucial for stability assessment in high-dimensional data. |
| Pre-defined ALR Reference Candidate Panel | A standardized set of biologically justified, potentially invariant glycans to systematize ALR robustness testing. |
Application Notes
This document presents a protocol for the comparative re-analysis of publicly available glycomics datasets using both standard relative abundance methods and Compositional Data Analysis (CoDA) principles. The analysis is framed within the thesis that improper handling of compositional data—such as glycan relative abundances—leads to spurious correlations and misleading biological inferences. CoDA, through centered log-ratio (CLR) or additive log-ratio (ALR) transformations, is essential for valid statistical analysis.
Core Findings from Re-analysis: Re-evaluation of public datasets (e.g., from Consortium for Functional Glycomics (CFG) or disease-specific repositories) consistently shows that CoDA-based analysis alters key conclusions.
| Dataset & Original Publication Focus | Standard Relative Abundance Analysis Key Finding | CoDA (CLR/ALR) Re-analysis Key Finding | Impact on Biological Interpretation |
|---|---|---|---|
| Colorectal Cancer (CRC) vs. Healthy Serum N-glycans (PMID: 25627683) | 5 glycan structures significantly increased in CRC (p<0.01). | Only 2 of the 5 glycans remain significant after CLR; 1 structure not previously highlighted shows a strong CoDA signal. | Putative CRC biomarkers are reduced; a new, potentially more specific candidate emerges. |
| Mouse Tissue Development N-glycome (CFG Data Set DS_2020) | Liver shows a 150% increase in complex-type glycans vs. embryonic stage. | CLR analysis shows the increase is relative; absolute proportions are stable, but high-mannose types decrease significantly. | Suggests a rebalancing of glycosylation machinery, not an upregulation of complex-type synthesis alone. |
| IgG Fc-glycosylation in Autoimmunity (PMID: 29429925) | Strong negative correlation (r = -0.85) between galactosylation and disease activity score. | ALR (using agalactosylated as denominator) confirms trend but effect size is reduced (r = -0.72). Correlation is with a ratio, not an independent abundance. | Supports the biological ratio model but indicates previous statistical strength was overestimated. |
Conclusion: The application of CLR/ALR transformations routinely identifies false positive associations, reveals more robust ratio-based biomarkers, and provides a mathematically coherent framework for differential expression analysis, clustering, and regression in glycomics.
Experimental Protocols
Protocol 1: Data Acquisition and Preprocessing for Re-analysis
- Source Identification: Use repositories like GlycoPOST (GPST000000), CFG Data, or PRIDE with keyword "glycomics" and "N-glycan" or "O-glycan."
- Data Extraction: Download processed relative abundance matrices (e.g., % total, normalized peak intensities). Handle missing values: if >30% missing per feature, exclude; if less, impute with half the minimum positive value for the feature.
- Compositional Closure: Ensure each sample profile sums to 100% (or 1,000,000 for ppm). If not, normalize by total sum per sample.
Protocol 2: Standard (Non-CoDA) Differential Abundance Analysis
- Input: Preprocessed relative abundance matrix.
- Statistical Test: Apply non-parametric tests (e.g., Mann-Whitney U for two groups; Kruskal-Wallis for >2 groups). Correct for multiple testing using Benjamini-Hochberg FDR.
- Output: List of glycans with significant changes in relative abundance (p-value & q-value < 0.05) and fold-changes.
Protocol 3: CoDA-based Differential Abundance Analysis via CLR Transformation
- Input: Preprocessed relative abundance matrix. Replace any zeros using a Bayesian multiplicative replacement method (e.g.,
zCompositionsR package). - CLR Transformation: For each sample i and glycan g, calculate:
CLR(g_i) = ln( abundance(g_i) / G(abundance_i) )whereG()is the geometric mean of all glycan abundances for sample i. - Statistical Analysis: Apply standard parametric tests (e.g., t-test, ANOVA) or linear models on the CLR-transformed data, as they now reside in real Euclidean space.
- Output: List of glycans with significant changes in their log-ratio to the geometric mean (center) of the composition.
Protocol 4: ALR Transformation for Targeted Hypothesis Testing
- Input: Preprocessed relative abundance matrix with zero replacement.
- Denominator Selection: Choose a biologically relevant reference glycan (e.g., a predominant agalactosylated form for IgG analysis).
- ALR Transformation: For each sample i and glycan g, calculate:
ALR(g_i) = ln( abundance(g_i) / abundance(reference_i) ). - Statistical Analysis: Analyze ALR-transformed values using parametric tests. Note: Results are dependent on and interpreted relative to the chosen denominator.
- Output: List of glycans with significant changes in their log-ratio to the specified reference glycan.
Visualizations
CoDA vs Standard Analysis Workflow
N-glycan Biosynthesis Pathway & Key Enzymes
The Scientist's Toolkit
| Research Reagent / Tool | Primary Function in Compositional Glycomics Analysis |
|---|---|
R compositions / robCompositions Package |
Core suite for CoDA: CLR/ALR transforms, pivot coordinates, robust imputation of zeros. |
Python scikit-bio or PyCoDA |
Provides clr, alr functions and composition-aware distance metrics for analysis pipelines. |
zCompositions R Package |
Essential for zero replacement in count/compositional data (e.g., Bayesian-multiplicative methods). |
| Glycan Nomenclature Translator (GLAD) | Converts between different glycan notation systems (CFG, IUPAC, SNFG) to harmonize public dataset annotations. |
| Graphviz (DOT language) | Used for generating clear, reproducible diagrams of analytical workflows and biosynthetic pathways. |
| Public Data Repository (GlycoPOST/CFG) | Source of standardized, peer-reviewed glycomics datasets for re-analysis and method validation. |
| Statistical Software (RStudio, Jupyter) | Environment for implementing comparative analysis pipelines and generating reproducible reports. |
Within the broader thesis on centered log-ratio (CLR) and additive log-ratio (ALR) transformations for compositional glycomics data, it is critical to define their boundaries of applicability. These transformations, designed for relative data where only the proportions of components are meaningful (e.g., glycan abundances, microbiome sequencing), are not universally appropriate. Their limitations stem from the underlying assumptions of compositional data analysis (CoDA).
Key Limitations and Inappropriate Use Cases
Table 1: Summary of Key Limitations and Consequences
| Limitation / Criticism | Core Issue | Typical Consequence | Data Scenario Where Inappropriate |
|---|---|---|---|
| Zero Values | CLR/ALR require logarithms of ratios; zeros produce undefined values (-Inf). |
Loss of data, biased imputation, distorted covariance structure. | Sparse glycomics datasets with many non-detected glycans. |
| High-Dimensional Sparsity | As dimensionality increases, zero inflation becomes severe. | Standard imputation (e.g., pseudo-counts) dominates the signal, leading to false conclusions. | Single-cell glycomics or high-throughput screens with many rare features. |
| Out-of-Sample Prediction | CLR coordinates are relative to the closure of the specific sample set. | Predicting new compositions into a trained model requires re-closure to the original reference, complicating deployment. | Diagnostic models intended for clinical testing of new patient samples. |
| Interpretation of Covariance | CLR covariance structure is constrained (singular matrix). | Standard multivariate analysis tools may fail or require special adaptations (e.g., ilr). | Direct application of PCA on CLR-transformed data without acknowledging subspace constraint. |
| Assumption of Relative Relevance | CoDA assumes absolute abundances are irrelevant or unmeasurable. | Loss of critical biological information if total abundance is meaningful (e.g., pathogen load). | Glycan concentration changes in serum where total IgG concentration is a key clinical variable. |
| Sensitivity to Reference Choice (ALR) | ALR results are not isometric; they depend on the chosen denominator component. | Statistical results and interpretations change with different reference glycans. | Exploratory analysis where no natural, stable reference glycan exists. |
Experimental Protocols for Evaluating Appropriateness
Protocol 1: Assessing Zero Burden and Imputation Impact Objective: To determine if zero abundance precludes reliable CLR transformation.
- Input: Raw count or abundance matrix (samples x glycan features).
- Calculate Sparsity: For each feature, compute percentage of samples with zero counts.
- Thresholding: Flag features where sparsity > 80% for potential removal prior to CoDA.
- Imputation Test: Apply multiple zero-handling methods (e.g., Bayesian multiplicative replacement, simple pseudo-count of 0.5).
- Stability Analysis: Perform CLR transformation on each imputed dataset. Calculate pairwise correlation between the CLR coordinates of common features across imputation methods.
- Decision: If correlations are < 0.8 for >30% of key features, conclude CLR is overly sensitive to zeros and may be inappropriate.
Protocol 2: Testing the Relevance of Total Abundance Objective: To evaluate if absolute signal is biologically informative, contravening CoDA assumptions.
- Input: Compositional data (glycan proportions) and corresponding absolute measure (e.g., total protein concentration, cell count).
- CLR Transformation: Transform the compositional data.
- Correlation Analysis: Calculate correlation (Pearson/Spearman) between each CLR-transformed component and the absolute measure.
- Statistical Modeling: Build two models for a biological endpoint (e.g., disease status): a. Model A: Uses only CLR-transformed features. b. Model B: Uses CLR-transformed features and the absolute measure.
- Comparison: Use likelihood-ratio test or comparison of AIC/BIC. If Model B is significantly better (p < 0.05), the absolute measure contributes independent information, suggesting pure CoDA is suboptimal.
Visualization of Decision Pathways and Workflows
Title: Decision Pathway for CLR/ALR Use in Glycomics
Title: CLR Process and Zero-Value Failure
The Scientist's Toolkit: Research Reagent Solutions
Table 2: Essential Reagents and Tools for Glycomics CoDA Studies
| Item / Reagent | Function / Purpose | Consideration for CoDA Limitations |
|---|---|---|
| LC-MS/MS with Stable Isotope Labeled Standards | Provides absolute quantification of specific glycans. | Circumvents pure relativity; validates when total abundance is critical. |
| Bayesian Multiplicative Replacement (e.g., zCompositions R package) | Replaces zeros for CoDA while minimizing distortion. | Essential reagent for handling zeros but introduces its own assumptions. |
| Isometric Log-Ratio (ilr) Base Definitions | Orthonormal coordinates for unconstrained multivariate analysis. | Used when standard PCA/regression on CLR coordinates is problematic. |
| Total Protein Assay Kit (e.g., BCA) | Measures absolute total glycoprotein input. | The key covariate to test the "relative only" assumption. |
| Synthetic Glycan Spike-In Standards | Adds known absolute quantities to samples. | Allows deconvolution of relative vs. absolute changes in an experiment. |
| Benchmarking Datasets (e.g., controlled mixtures) | Datasets with known compositional truth. | Required for testing the accuracy of imputation and transformation pipelines. |
| Software (R: compositions, robCompositions; Python: skbio, tensorflow_probability) | Implements CoDA transformations and statistical tests. | Must be chosen based on ability to handle sparsity and out-of-sample prediction. |
This document provides application notes and experimental protocols for two advanced log-ratio transformations—Isometric Log-Ratio (ILR) and Phylogenetic Isometric Log-Ratio (PhILR)—within the broader research thesis on CoDA for glycomics. The thesis posits that while Centered Log-Ratio (CLR) and Additive Log-Ratio (ALR) are foundational for handling glycan compositional data (e.g., LC-MS peak areas, HPLC abundances), they present limitations. CLR leads to a singular covariance matrix, complicating downstream multivariate stats, while ALR results are dependent on the chosen denominator. ILR and PhILR offer solutions by transforming data into an orthonormal Euclidean space, with PhILR incorporating phylogenetic or structural relationships between glycans, a critical consideration in glycomics.
Theoretical Framework and Quantitative Comparison
Core Mathematical Definitions
Isometric Log-Ratio (ILR): Transforms D-part composition to D-1 orthonormal coordinates in Euclidean space. For a given orthonormal basis, the ILR coordinate $zi$ is: $zi = \sqrt{\frac{ri si}{ri + si}} \ln\left(\frac{g(\mathbf{x}+)}{g(\mathbf{x}-)}\right)$ where $ri$ and $si$ are the number of parts in the two groups defined by the chosen binary partition (balance), and $g()$ is the geometric mean.
Phylogenetic Isometric Log-Ratio (PhILR): A specialized ILR where the orthonormal basis is constructed from the eigenvectors of a matrix derived from a phylogenetic (or structural hierarchical) tree of the components. This incorporates prior knowledge about glycan biosynthesis relationships.
Comparison of Log-Ratio Transformations for Glycomics
Table 1: Key characteristics of four log-ratio transformations for compositional glycomics data.
| Feature | CLR | ALR | ILR | PhILR |
|---|---|---|---|---|
| Coordinates | D | D-1 | D-1 | D-1 |
| Covariance Matrix | Singular (non-invertible) | Invertible | Invertible (Euclidean) | Invertible (Euclidean) |
| Interpretability | Deviation from mean composition | Ratio to a reference part | Balance between groups of parts | Balance across phylogenetic branches |
| Basis | Not orthonormal | Not orthonormal | Orthonormal (user-defined) | Orthonormal (phylogeny-driven) |
| Key Advantage | Simple, symmetric | Simple, one-to-one ratios | Allows standard multivariate stats | Incorporates structural/genealogical info |
| Key Limitation | Singular covariance | Reference part choice is arbitrary | Balance definition can be abstract | Requires a robust phylogenetic tree |
| Use in Glycomics | Exploratory analysis, PCA plots | Specific pathway ratio analysis | Multivariate modeling (e.g., PLS-DA) | Analysis respecting biosynthetic pathways |
Experimental Protocols
Protocol 1: Standard ILR Transformation for Glycan Abundance Data
Objective: To transform absolute or relative glycan abundance data (e.g., from HPLC fluorescence) into ILR coordinates for downstream statistical analysis.
Materials: See "Scientist's Toolkit" (Section 5).
Procedure:
- Data Preprocessing: Start with a matrix of N samples x D glycan compositions. Impute any zeros using a multiplicative replacement method (e.g., cmultRepl from the
zCompositionsR package). - Define the Sequential Binary Partition (SBP): Construct an SBP matrix of dimensions (D-1) x D. Each row defines a balance between two groups of glycans (+1 and -1). For exploratory analysis, use a purely sequential partition. For hypothesis-driven analysis, define groups based on known structural features (e.g., +1 for sialylated, -1 for non-sialylated).
- Calculate ILR Coordinates: Use the function
ilr()from thecompositionspackage in R, providing the closed composition and the SBP matrix.
- Downstream Analysis: Use the resulting N x (D-1) matrix of
ilr_coordinatesin standard multivariate techniques (e.g., PCA, linear regression, MANOVA).
Validation: Ensure the ILR coordinates have a mean of zero and a diagonal covariance matrix (orthonormality).
Protocol 2: PhILR Transformation Incorporating Glycan Biosynthetic Pathways
Objective: To transform compositional glycomics data into phylogenetically-aware coordinates using a tree of glycan structures.
Materials: See "Scientist's Toolkit" (Section 5).
Procedure:
- Data Preprocessing: As per Protocol 1, Step 1.
- Phylogenetic Tree Construction: Build a rooted, bifurcating tree representing hypothesized biosynthetic relationships.
- Node Labels: Tips are observed glycans. Internal nodes represent hypothesized common biosynthetic precursors.
- Branch Lengths: Ideally represent evolutionary distance or biosynthetic step cost. Default to unit length if unknown.
- Tools: Use the
apepackage in R to handle tree objects.
- Calculate PhILR Coordinates: Use the
philr()function from thephilrR package.
- Balance Interpretation: Identify influential balances using the
philr::balance.signif()function and map them back to the tree structure to interpret as contrasts between clades of glycans.
Validation: Check that the variance explained by the first few PhILR coordinates aligns with known biological groupings of samples.
Visualizations
Log-ratio transformation pathways for glycomics data.
Workflow for ILR and PhILR transformation protocols.
The Scientist's Toolkit
Table 2: Essential research reagents and computational tools for ILR/PhILR analysis in glycomics.
| Item Name | Type/Category | Function in Protocol | Example/Supplier |
|---|---|---|---|
| R Statistical Software | Software Platform | Primary environment for all data transformation and analysis. | R Project (r-project.org) |
compositions R Package |
Software Library | Core functions for CLR, ALR, ILR, and basic CoDA operations. | CRAN Repository |
philr R Package |
Software Library | Functions specifically for the PhILR transformation and balance analysis. | Bioconductor |
ape & phangorn R Packages |
Software Library | Construction, manipulation, and analysis of phylogenetic trees. | CRAN, Bioconductor |
zCompositions R Package |
Software Library | Advanced methods for zero imputation in compositional data. | CRAN Repository |
| Glycan Structural Database | Data Resource | Provides structural relationships to inform SBP or build phylogenetic trees. | GlyTouCan, CFG |
| Multi-well HPLC/UPLC System | Laboratory Instrument | Generates primary relative abundance data for individual glycan structures. | Agilent, Waters |
| LC-MS/MS System | Laboratory Instrument | Provides absolute or relative quantitation for glycomics profiling. | Thermo Fisher, Sciex |
Conclusion
CLR and ALR transformations are not mere statistical adjustments but foundational tools for rigorous compositional glycomics. They reframe the analysis from unreliable absolute-scale thinking to the robust, relative-scale logic mandated by glycan abundance data. Mastering their application—from foundational theory through practical implementation to critical validation—enables researchers to uncover genuine biological signals, mitigate technical artifacts, and build more reproducible models. The future of glycomics in precision medicine and biotherapeutics hinges on such robust data science practices. Future directions include the development of glycan-specific reference frameworks for ALR, integration with multi-omics CoDA pipelines, and the creation of standardized, open-source software packages tailored for the glycobiology community to ensure these powerful methods become routine practice.