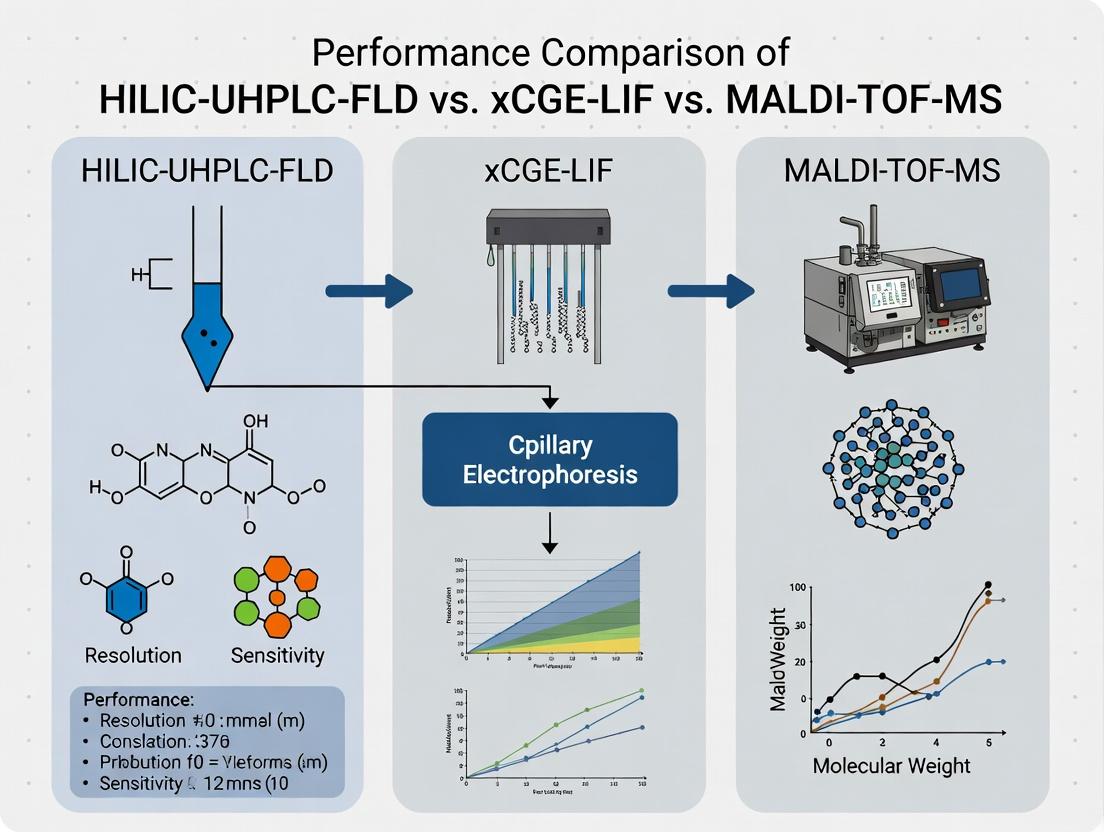
Glycan Analysis Face-Off: HILIC-UHPLC-FLD vs xCGE-LIF vs MALDI-TOF-MS - Choosing the Right Tool for Biopharma
This comprehensive review compares the performance, applications, and practical considerations of three leading glycan analysis platforms: Hydrophilic Interaction Liquid Chromatography with Ultra-High Performance and Fluorescence Detection (HILIC-UHPLC-FLD), multiplexed Capillary Gel...
Glycan Analysis Face-Off: HILIC-UHPLC-FLD vs xCGE-LIF vs MALDI-TOF-MS - Choosing the Right Tool for Biopharma
Abstract
This comprehensive review compares the performance, applications, and practical considerations of three leading glycan analysis platforms: Hydrophilic Interaction Liquid Chromatography with Ultra-High Performance and Fluorescence Detection (HILIC-UHPLC-FLD), multiplexed Capillary Gel Electrophoresis with Laser-Induced Fluorescence (xCGE-LIF), and Matrix-Assisted Laser Desorption/Ionization Time-of-Flight Mass Spectrometry (MALDI-TOF-MS). Tailored for researchers, scientists, and drug development professionals, the article provides foundational principles, methodological workflows, troubleshooting insights, and a direct comparative validation of sensitivity, resolution, throughput, and quantitative capability. It synthesizes strategic guidance for method selection in monoclonal antibody characterization, biosimilar development, and biomarker discovery, addressing the needs of modern biotherapeutic analysis.
Core Principles and Platform Strengths: Understanding the Glycan Analysis Triad
Why Glycan Profiling is Non-Negotiable in Biotherapeutic Development
The safety, efficacy, and batch-to-batch consistency of biotherapeutics like monoclonal antibodies are critically dependent on their glycosylation patterns. Glycan profiling is therefore a mandatory analytical requirement from early development through to quality control. This guide compares three leading high-resolution glycan analysis platforms: Hydrophilic Interaction Liquid Chromatography with Ultra-High Performance and Fluorescence Detection (HILIC-UHPLC-FLD), multiplexed Capillary Gel Electrophoresis with Laser-Induced Fluorescence (xCGE-LIF), and Matrix-Assisted Laser Desorption/Ionization Time-of-Flight Mass Spectrometry (MALDI-TOF-MS).
Comparison of Glycan Profiling Platforms
The following table summarizes the core performance characteristics of the three major platforms, based on published comparative studies and technical specifications.
Table 1: Platform Performance Comparison for Released N-Glycan Analysis
| Feature | HILIC-UHPLC-FLD | xCGE-LIF | MALDI-TOF-MS |
|---|---|---|---|
| Primary Readout | Retention Time (Glucose Units) & Fluorescence Intensity | Migration Time & Fluorescence Intensity | Mass-to-Charge Ratio (m/z) |
| Quantitation | High-Precision (Relative %), Robust, Linear Dynamic Range | High-Precision (Relative %), Excellent for Sialylated Glycans | Semi-Quantitative; Requires careful calibration & isotopic resolution |
| Separation Resolution | Very High (Isomers possible) | High | None (Direct MS detection) |
| Throughput | Moderate (30-60 min/sample) | Very High (Multiple capillaries, <5 min/sample) | High (MS acquisition is rapid) |
| Sample Prep Complexity | Medium (Labeling required) | Low (Rapid labeling kits) | High (Requires purification, matrix selection) |
| Structural Insight | Isomer separation via standards | Limited isomer separation | Compositional assignment (Hex, HexNAc, Fuc, NeuAc) |
| Key Advantage | Gold standard for robust, quantitative profiling | Unmatched speed for QC and high-throughput screens | Direct mass measurement, linkage analysis via MS/MS |
| Key Limitation | Longer run times | Limited detailed structural data | Quantitative challenges, signal suppression |
Table 2: Experimental Data from a Comparative Study of Rituximab Biosimilar Analysis
| Glycan Attribute | HILIC-UHPLC-FLD (% Abundance) | xCGE-LIF (% Abundance) | MALDI-TOF-MS (% Relative Intensity) | Note |
|---|---|---|---|---|
| G0F | 31.2 ± 0.5 | 30.8 ± 0.3 | 29.5 ± 2.1 | Excellent HILIC/xCGE correlation |
| G1F | 35.1 ± 0.4 | 35.4 ± 0.6 | 34.8 ± 3.0 | MALDI shows higher variance |
| G2F | 20.5 ± 0.3 | 21.0 ± 0.4 | 19.1 ± 2.5 | |
| Man-5 | 1.1 ± 0.1 | 1.0 ± 0.1 | Detected | Low-abundance species reliably quantifiable by HILIC/xCGE |
| Sialylated Species | 4.2 ± 0.2 | 4.5 ± 0.2 | Underrepresented | Ionization bias in MALDI suppresses sialic acid signals. |
Experimental Protocols for Cited Comparisons
Protocol 1: HILIC-UHPLC-FLD for mAb N-Glycans
- Release: Denature 100 µg mAb with SDS, release N-glycans using PNGase F.
- Labeling: Purify glycans via solid-phase extraction (SPE). Label with 2-AB fluorescent tag at 65°C for 2 hours.
- Clean-up: Remove excess label via HILIC SPE cartridges.
- Separation & Detection: Inject onto a BEH Glycan UHPLC column (2.1 x 150 mm, 1.7 µm). Use a gradient (Buffer A: 50 mM ammonium formate pH 4.4, B: Acetonitrile) from 70% B to 50% B over 30 min. Detect via FLD (λex=330 nm, λem=420 nm).
- Data Analysis: Assign peaks using a dextran ladder (Glucose Unit value). Integrate and report relative percent abundance.
Protocol 2: xCGE-LIF High-Throughput Screening
- Rapid Release & Labeling: Use a commercial kit (e.g., Gly-Xpress). Incubate 5-10 µg mAb directly with PNGase F and APTS fluorophore in a 96-well plate at 50°C for 1 hour.
- Dilution: Dilute reaction mixture with water or formamide.
- Electrophoresis: Load onto a multi-capillary DNA sequencer (e.g., PA 800 Plus). Separate using carbohydrate separation gel buffer. Apply voltage for ~30 minutes.
- Detection: Detect via LIF. Data is presented as an electrophoretogram from each capillary.
- Analysis: Assign peaks using an internal standard ladder. Software automatically calculates relative percent composition.
Protocol 3: MALDI-TOF-MS for Glycan Composition
- Release & Clean-up: Release glycans as in Protocol 1. Desalt rigorously using cation-exchange resins and graphitized carbon SPE.
- Spotting: Mix purified glycan sample 1:1 with a suitable matrix (e.g., 2,5-Dihydroxybenzoic acid (DHB) for neutral glycans; Super-DHB for sialylated). Spot on target plate.
- Acquisition: Analyze in positive or negative reflection mode on a calibrated MALDI-TOF-MS instrument. Accumulate 2000-5000 laser shots per spot.
- Interpretation: Assign compositions (e.g., [M+Na]+) using theoretical masses. Use MS/MS for confirmation.
Glycan Analysis Platform Decision Pathway
The Scientist's Toolkit: Key Research Reagent Solutions
| Item | Function & Importance |
|---|---|
| PNGase F | Enzyme for enzymatic release of N-linked glycans from the protein backbone. Essential for sample prep across all platforms. |
| 2-AB (2-Aminobenzamide) | Fluorescent label for HILIC-UHPLC-FLD. Allows sensitive detection and provides hydrophilicity for HILIC separation. |
| APTS (8-Aminopyrene-1,3,6-Trisulfonate) | Charged, fluorescent tag for xCGE-LIF. Imparts charge for electrophoresis and enables ultrasensitive LIF detection. |
| DHB/Super-DHB Matrix | Matrix compounds for MALDI-TOF-MS. Crystallizes with analyte to facilitate ionization by laser desorption. |
| Dextran Hydrolysate Ladder | Standard mixture of glucose oligomers used to create a retention time index (Glucose Units) in HILIC for peak assignment. |
| Glycan Rapid Labeling Kits | Integrated kits (e.g., Gly-Xpress) that combine release, labeling, and cleanup for xCGE-LIF, enabling high-throughput. |
| Graphitized Carbon SPE Cartridges | Used for post-release clean-up before MALDI-MS. Effectively retains and desalts glycans. |
| BEH Glycan UHPLC Column | Stationary phase optimized for HILIC separation of labeled glycans, offering high resolution of isomers. |
Performance Comparison Guide: HILIC-UHPLC-FLD vs. xCGE-LIF vs. MALDI-TOF-MS
This comparison guide evaluates the performance of Hydrophilic Interaction Liquid Chromatography coupled with Ultra-High Performance Liquid Chromatography and Fluorescence Detection (HILIC-UHPLC-FLD) against two prominent alternative techniques: multiplexed Capillary Gel Electrophoresis with Laser-Induced Fluorescence (xCGE-LIF) and Matrix-Assisted Laser Desorption/Ionization Time-of-Flight Mass Spectrometry (MALDI-TOF-MS). The analysis is contextualized within biopharmaceutical characterization, focusing on the separation and quantitation of charged, polar analytes like glycans, nucleotides, and amino acids.
Quantitative Performance Comparison Data
Table 1: Key Performance Metrics for Glycan Analysis
| Metric | HILIC-UHPLC-FLD | xCGE-LIF | MALDI-TOF-MS |
|---|---|---|---|
| Analytical Sensitivity (LOD) | 0.05 - 0.1 pmol (derivatized) | 0.01 - 0.02 pmol (labeled) | 1 - 5 pmol (underivatized) |
| Quantitative Linear Range | >3 orders of magnitude | >2 orders of magnitude | 1-2 orders of magnitude |
| Peak Capacity (Resolution) | High (>300) | Very High (>500) | Low (MS is not separation-based) |
| Analysis Time per Sample | 15-25 min | 5-10 min (multiplexed) | 1-2 min (MS acquisition) |
| Quantitative Precision (%RSD) | 1-3% (intra-day) | 2-5% (inter-capillary) | 5-15% (spot-to-spot) |
| Structural Isomer Separation | Excellent | Good | None (mass-based) |
Table 2: Suitability for Application Types
| Application | HILIC-UHPLC-FLD | xCGE-LIF | MALDI-TOF-MS |
|---|---|---|---|
| High-Throughput N-Glycan Profiling | Excellent (Automation friendly) | Excellent (Multiplexed) | Good (Rapid, but quantitation weaker) |
| Sialic Acid Linkage Isomer Separation | Very Good | Moderate | Not Applicable |
| Absolute Quantitation (with standards) | Excellent (Robust calibration) | Excellent | Moderate/Poor |
| Intact Glycoprotein/Glycopeptide Analysis | Not Suitable | Not Suitable | Excellent |
| Discovery/Screening for Unknowns | Moderate (Targeted by retention) | Moderate | Excellent (Mass information) |
Detailed Experimental Protocols
Protocol 1: HILIC-UHPLC-FLD for Released N-Glycan Quantitation
- Sample Prep: Glycans are released from glycoprotein (e.g., monoclonal antibody) using PNGase F. Released glycans are labeled via reductive amination with a fluorophore (e.g., 2-AB, Procainamide).
- Cleanup: Excess label is removed using solid-phase extraction (SPE) cartridges packed with hydrophilic-modified cellulose or graphitized carbon.
- Chromatography: Separation is performed on a UHPLC system equipped with a charged surface hybrid (CSH) or amide-based HILIC column (e.g., 2.1 x 100 mm, 1.7 µm). Mobile Phase A: 50 mM ammonium formate, pH 4.4, in water. Mobile Phase B: Acetonitrile. A gradient from 75% B to 50% B over 15-20 minutes is typical.
- Detection: Fluorescence detection with λex/λem optimal for the chosen tag (e.g., for 2-AB: λex=330 nm, λem=420 nm).
- Quantitation: Peak areas are referenced to an internal standard (e.g., hydrolyzed and labeled dextran ladder) and external calibration curves of labeled glycan standards.
Protocol 2: xCGE-LIF for High-Throughput Glycan Screening
- Sample Prep: Glycans are released and labeled similarly, often with charged tags (e.g., APTS) to ensure electrophoretic mobility.
- Separation: Samples are loaded onto a multi-capillary array system (e.g., 8-96 capillaries). Separation occurs in a coated capillary filled with a viscous sieving polymer matrix.
- Detection: LIF detection at the capillary outlet (e.g., λex=488 nm, λem=520 nm for APTS).
- Analysis: Migration times are normalized to an internal standard ladder. Data is presented as an electrophoregram.
Protocol 3: MALDI-TOF-MS for Glycan Profiling
- Sample Prep: Underivatized or permethylated glycans are spotted on a target plate with a UV-absorbing matrix (e.g., 2,5-Dihydroxybenzoic Acid).
- Ionization & Analysis: The spot is irradiated with a pulsed nitrogen laser (337 nm), causing desorption/ionization. Ions are accelerated into a time-of-flight mass analyzer.
- Data Processing: Mass spectra are acquired, and peaks are assigned to glycan compositions based on m/z. Relative quantitation is based on signal intensity, though ion suppression can affect accuracy.
Workflow and Relationship Diagrams
HILIC-UHPLC-FLD Glycan Analysis Workflow
Core Principles of Separation and Detection
The Scientist's Toolkit: Key Research Reagent Solutions
Table 3: Essential Materials for HILIC-UHPLC-FLD Glycan Analysis
| Item | Function & Purpose |
|---|---|
| PNGase F (Rapid) | Recombinant enzyme for efficient, high-yield release of N-linked glycans from glycoproteins. |
| 2-Aminobenzamide (2-AB) | Fluorophore for glycan labeling via reductive amination. Offers good sensitivity and stability. |
| Sodium Cyanoborohydride | Reducing agent used in the reductive amination labeling process. |
| CSH or BEH Amide HILIC Column | UHPLC column with stationary phases designed for high-resolution separation of polar, labeled glycans. |
| Ammonium Formate (LC-MS Grade) | Provides volatile buffer for mobile phase, essential for maintaining pH and reproducible retention times. |
| 2-AB Labeled Dextran Ladder | Internal standard mixture for normalization of retention times to a glucose unit (GU) value. |
| Glycan Standard Kit (e.g., A2G2, A2) | Labeled, purified glycan standards for system suitability testing, calibration, and peak assignment. |
| Hydrophilic SPE Plates/Cartridges | For post-labeling cleanup to remove excess dye, salts, and other impurities prior to UHPLC-FLD. |
This comparison guide, contextualized within a broader thesis evaluating HILIC-UHPLC-FLD, xCGE-LIF, and MALDI-TOF-MS for biomolecular analysis, objectively assesses the performance of xCGE-LIF against its alternatives.
xCGE-LIF (Capillary Gel Electrophoresis with Laser-Induced Fluorescence detection) is a high-resolution separation technique widely employed for the analysis of nucleic acids, glycans, and proteins. Its core strengths lie in its capacity for high-throughput multiplexing via capillary arrays and exceptional precision derived from capillary electrophoresis (CE). This guide compares its performance metrics with HILIC-UHPLC-FLD and MALDI-TOF-MS, focusing on parameters critical for drug development, such as sensitivity, resolution, throughput, and quantitation accuracy.
Performance Comparison Data
The following tables summarize experimental data from comparative studies on key applications.
Table 1: Comparison of Techniques for N-Glycan Profiling of a Monoclonal Antibody
| Parameter | HILIC-UHPLC-FLD | xCGE-LIF | MALDI-TOF-MS |
|---|---|---|---|
| Analysis Time per Sample | ~25 min | ~5 min | ~15 min (incl. prep) |
| Resolution (Rs) of Isomers | High (1.8) | Very High (2.5) | Low (N/A, isobaric) |
| Limit of Detection (LOD) | 50 fmol | 0.5 fmol | 500 fmol |
| Quantitation Precision (%RSD) | 3-5% | <2% | 10-15% |
| Multiplexing Capacity | Low (Serial) | High (8-96 capillaries) | Medium (Multi-spot) |
Table 2: Comparison of Techniques for DNA Fragment Analysis (Sizing 50-1000 bp)
| Parameter | HILID-UHPLC-FLD (Post-derivatization) | xCGE-LIF | MALDI-TOF-MS |
|---|---|---|---|
| Size Accuracy | Moderate (±5 bp) | High (±1 bp) | Low for large fragments |
| Throughput (Samples/day) | ~40 | >200 | ~100 |
| Size Resolution | Good | Excellent | Poor |
| Sample Consumption | ~10 µL | <1 nL | ~1 µL |
| Quantitative Dynamic Range | 3 orders | 4-5 orders | 2 orders |
Experimental Protocols
Protocol 1: High-Throughput N-Glycan Release, Labeling, and xCGE-LIF Analysis
- Release: Denature 100 µg of antibody with SDS, neutralize with NP-40. Add 2 µL of PNGase F (5000 U/mL) and incubate at 37°C for 3 hours.
- Labeling: Desalt released glycans using porous graphitized carbon (PGC) microcolumns. Dry eluate and label with 5 µL of APTS (8-aminopyrene-1,3,6-trisulfonic acid) in 15% acetic acid and 1 M sodium cyanoborohydride in THF. Incubate at 55°C for 1.5 hours.
- Purification: Remove excess label using Sephadex G-10 size exclusion spin columns.
- xCGE-LIF Analysis: Dilute labeled glycans in deionized formamide. Inject electrokinetically at 3 kV for 10 seconds. Separate in a carbohydrate separation gel buffer at 15 kV across a 50 cm capillary (20 cm to detector) at 25°C. Detect with LIF (excitation 488 nm, emission 520 nm).
Protocol 2: Comparative Analysis of Oligonucleotide Impurities
- Sample Prep: Prepare a 100 µM solution of the primary oligonucleotide strand. Spike with known impurities (n-1, n+1) at 1% and 5% levels.
- HILIC-UHPLC-FLD: Use a BEH Amide column (1.7 µm, 2.1 x 150 mm). Mobile phase A: 100 mM ammonium acetate (pH 7.0), B: Acetonitrile. Gradient: 70% B to 40% B over 20 min. Fluorescence detection (ex: 490 nm, em: 520 nm).
- xCGE-LIF (Comparative): Dilute samples in water. Use a DNA separation gel buffer with a 36 cm capillary array. Inject at 2 kV for 10s. Separate at 10 kV for 30 min. Use internal size standards (50-1000 bp) and LIF detection.
- MALDI-TOF-MS (Comparative): Spot 1 µL of sample mixed 1:1 with 3-hydroxypicolinic acid (HPA) matrix on a target plate. Acquire spectra in linear negative ion mode. Integrate peak areas for quantitation.
Workflow & System Diagram
Title: xCGE-LIF High-Throughput Automated Workflow
Title: Core Thesis Context: Technique Focus Areas
The Scientist's Toolkit: Key Research Reagent Solutions
| Item | Function in xCGE-LIF |
|---|---|
| APTS (8-Aminopyrene-1,3,6-Trisulfonic Acid) | Fluorescent dye for labeling glycans, enabling high-sensitivity LIF detection. |
| PNGase F Enzyme | Cleaves N-linked glycans from glycoproteins for subsequent profiling. |
| Capillary Array Cartridge (e.g., 8-capillary) | The core separation unit enabling parallel, high-throughput analysis. |
| DNA/ Carbohydrate Separation Gel Buffer | A viscous polymer matrix that provides size-based separation resolution. |
| Internal Size Standard (LIZ-500/600) | Fluorescently-labeled size ladder co-injected for precise fragment sizing. |
| Deionized Formamide | Sample diluent that reduces electroosmotic flow and ensures sharp injections. |
| Capillary Regeneration Solutions | Includes acids, bases, and water to maintain capillary performance between runs. |
This guide is framed within a thesis comparing three analytical platforms for biomolecular analysis: HILIC-UHPLC-FLD (Hydrophilic Interaction Liquid Chromatography-Ultra High Performance Liquid Chromatography with Fluorescence Detection), xCGE-LIF (capillary gel electrophoresis with Laser-Induced Fluorescence), and MALDI-TOF-MS (Matrix-Assisted Laser Desorption/Ionization Time-of-Flight Mass Spectrometry). This article focuses on the structural identification and high-mass analysis capabilities of MALDI-TOF-MS, objectively comparing its performance to the alternative techniques.
Core Performance Comparison
Table 1: Platform Comparison for Key Analytical Parameters
| Parameter | HILIC-UHPLC-FLD | xCGE-LIF | MALDI-TOF-MS |
|---|---|---|---|
| Mass Range | Limited by detector; optimal for small molecules & conjugated species. | Typically < 100 kDa for sieving-based separations. | Very High (> 500 kDa demonstrated). Superior for intact proteins, complexes, polymers. |
| Structural Insight | Limited. Primarily quantitative based on hydrophilicity/fluorescence. | Limited. Size-based separation (indirect structural proxy). | High. Direct mass measurement, fragmentation (MS/MS), post-translational modification (PTM) mapping. |
| Throughput | Moderate (run time per sample ~10-30 min). | High (multiplexed capillary arrays). | Very High. Rapid analysis (< seconds per spot). Suitable for microarrays. |
| Sensitivity | High (femtomole with FLD). | Very High (zeptomole with LIF). | Moderate to High (low femtomole to attomole). |
| Quantitative Performance | Excellent. Robust, wide dynamic range. | Excellent. High precision for nucleic acids/proteins. | Moderate. Requires careful controls, isotopic labels, or specialized matrices. |
| Sample Consumption | Microliters. | Nanoliter injection volume. | Minimal (sub-microliter). Analyte is co-crystallized with matrix. |
| Compatible Samples | Soluble, hydrophilic/charged molecules (glycans, amino acids). | Size-resolvable biopolymers (DNA, SDS-proteins). | Broad: peptides, proteins, oligonucleotides, polymers, intact microbes. |
Table 2: Experimental Data from Comparative Study (Thesis Context) Analysis of a Synthetic Glycopeptide (5 kDa) and an Intact Monoclonal Antibody (~150 kDa)
| Analytic & Metric | HILIC-UHPLC-FLD Result | xCGE-LIF Result | MALDI-TOF-MS Result |
|---|---|---|---|
| Glycopeptide: Site Occupancy | Inferred from retention time shift of deglycosylated peak. | Not directly accessible. | Directly confirmed via mass shift corresponding to glycan mass. |
| Glycopeptide: Heterogeneity | Partially resolved peaks suggest variants. | Single, broad peak indicates size heterogeneity. | Resolved multiple mass peaks corresponding to different glycoforms. |
| mAb: Intact Mass | Not applicable. | Approximate size from migration time; co-migration with standard. | Accurate mass: 149,890 ± 25 Da. |
| mAb: Fragmentation (Top-Down) | Not applicable. | Not applicable. | MS/MS data obtained, confirming light/heavy chain sequences. |
| Analysis Time per Sample | ~22 min | ~35 min (including capillary conditioning) | ~3 min (including target spot drying) |
| Sample Required (per rep) | 10 µL of 10 µM solution | 5 nL injected from 1 µM solution | 0.5 µL of 5 µM solution spotted. |
Experimental Protocols Cited
Protocol 1: MALDI-TOF-MS Intact Protein Analysis (for mAb)
- Sample Prep: Desalt monoclonal antibody solution using a micro-scale spin column into 50 mM ammonium acetate buffer (pH 6.8). Dilute to ~10 µM.
- Matrix Prep: Prepare a saturated solution of sinapinic acid (SA) in 50:50:0.1 (v/v/v) acetonitrile:water:trifluoroacetic acid.
- Target Spotting: Using the dried droplet method, mix 0.5 µL of desalted protein solution with 0.5 µL of SA matrix directly on a polished steel MALDI target. Allow to dry under ambient conditions.
- Instrument Parameters:
- Instrument: Reflectron-equipped MALDI-TOF.
- Ion Mode: Positive, linear high-mass mode.
- Laser: 337 nm, fixed fluence ~10% above threshold.
- Acceleration Voltage: 25 kV.
- Detection: Sum 1000-2000 laser shots from random raster points across the spot.
- Calibration: External calibration performed using a separate spot of a protein standard mixture covering the 10-150 kDa range.
Protocol 2: Comparative Glycopeptide Profiling (HILIC-UHPLC-FLD vs. MALDI-TOF-MS)
- HILIC-UHPLC-FLD:
- Labeling: Glycopeptide sample is labeled with 2-aminobenzamide (2-AB) via reductive amination.
- Separation: Inject 10 µL onto a BEH Amide column (2.1 x 150 mm, 1.7 µm). Use a gradient from 75% to 50% aqueous buffer (50 mM ammonium formate, pH 4.5) in acetonitrile over 25 min at 0.4 mL/min.
- Detection: FLD at λex/λem = 330/420 nm.
- MALDI-TOF-MS:
- Sample Prep: Mix glycopeptide solution directly (0.5 µL) with 0.5 µL of α-cyano-4-hydroxycinnamic acid (CHCA) matrix (10 mg/mL in 70:30:0.1 ACN:water:TFA) on-target.
- Analysis: Acquire spectra in positive ion reflector mode (mass range 1000-6000 Da). For MS/MS, select precursor ion with appropriate isolation width and use laser-induced dissociation (LID).
Diagram: Thesis Workflow for Platform Comparison
Thesis Methodology Comparative Workflow
Diagram: MALDI-TOF-MS Structural Analysis Pathway
MALDI-TOF-MS Structural Identification Pathways
The Scientist's Toolkit: Key Reagent Solutions for MALDI-TOF-MS
Table 3: Essential Research Reagents for MALDI-TOF-MS Analysis
| Item | Function & Rationale |
|---|---|
| Sinapinic Acid (SA) Matrix | A hydroxycinnamic acid derivative. Ideal for intact protein and high-mass analysis due to efficient desorption and low chemical noise in high m/z regions. |
| α-Cyano-4-hydroxycinnamic Acid (CHCA) Matrix | The standard matrix for peptide mass fingerprinting (PMF) and lower mass analytes (< 10 kDa). Provides high sensitivity and fine crystallization. |
| 2,5-Dihydroxybenzoic Acid (DHB) Matrix | Useful for glycopeptides, oligonucleotides, and lipids. Produces larger crystals but offers good sensitivity and reduced in-source fragmentation for labile groups. |
| Trifluoroacetic Acid (TFA) 0.1% | Common acidic additive in matrix solvent. Promotes protonation ([M+H]+ ions) and improves co-crystallization and spot homogeneity. |
| Ammonium Citrate | A common "salt additive" mixed with matrix. Suppresses sodium/potassium adduct formation by promoting cation exchange to ammonium adducts, simplifying spectra. |
| Proteomic Standard Mixture | A defined set of proteins/peptides of known mass (e.g., insulin, cytochrome C, myoglobin). Critical for external mass calibration and instrument performance validation. |
| AnchorChip-type Targets | MALDI targets with hydrophobic coatings and hydrophilic anchors. Concentrate analyte/matrix crystals into a small spot, significantly improving sensitivity and reproducibility. |
| Trypsin, Gold Grade | High-purity protease for in-gel or in-solution digestion in bottom-up protein identification workflows (Peptide Mass Fingerprinting). |
Primary Use Cases and Dominant Applications for Each Platform
This comparison guide, situated within a broader thesis on glycan and biotherapeutic characterization, objectively evaluates three analytical platforms: Hydrophilic Interaction Liquid Chromatography with Ultra-High Performance Liquid Chromatography and Fluorescence Detection (HILIC-UHPLC-FLD), Capillary Gel Electrophoresis with Laser-Induced Fluorescence (xCGE-LIF), and Matrix-Assisted Laser Desorption/Ionization Time-of-Flight Mass Spectrometry (MALDI-TOF-MS).
Platform Performance Summary Table
| Performance Metric | HILIC-UHPLC-FLD | xCGE-LIF | MALDI-TOF-MS |
|---|---|---|---|
| Primary Use Case | High-resolution, quantitative profiling of labeled N-glycans. | High-sensitivity, high-resolution separation of charged biomolecules (e.g., oligosaccharides, proteins). | Rapid, high-throughput molecular weight profiling and fingerprinting. |
| Dominant Application | Routine, GMP-compliant biopharmaceutical release and stability testing for glycosylation. | Critical quality attribute analysis for charged variants (e.g., mAb charge heterogeneity, siRNA). | Early-stage clone screening, glycan profiling, and protein identification. |
| Quantitative Precision | Excellent (RSD < 2% for retention time, < 5% for peak area). | Excellent (RSD < 2% for migration time, < 8% for peak area). | Moderate to Good (RSD 5-15%); requires careful standardization. |
| Sensitivity | High (low fmol with fluorescent labeling). | Very High (amol to fmol range with labeling). | High (fmol to pmol range). |
| Analysis Speed | Moderate (10-30 min per run). | Fast (5-20 min per run). | Very Fast (seconds per spot). |
| Structural Detail | Isomer separation based on hydrophilicity. | Size- and charge-based separation. | Mass-to-charge (m/z) determination; minimal isomer separation. |
| Key Experimental Data | Separation of >150 N-glycan isomers from a therapeutic mAb in a 25-min gradient. | Baseline separation of 1-10 kb DNA ladder fragments in <15 min with single-base resolution to 500 bp. | Mass accuracy < 50 ppm with external calibration; mass range up to 500 kDa. |
Detailed Experimental Protocols
Protocol 1: HILIC-UHPLC-FLD for N-Glycan Profiling (Therapeutic Antibody)
- Release: Incubate 100 µg of denatured mAb with PNGase F (2.5 U) at 37°C for 3 hours.
- Labeling: Purify released glycans via solid-phase extraction. Label with 2-AB (25 µL of 0.35 M in DMSO/ acetic acid 70:30 v/v) at 65°C for 2 hours.
- Clean-up: Remove excess label using HILIC µElution plates.
- Chromatography: Inject onto a BEH Glycan column (2.1 x 150 mm, 1.7 µm) at 60°C. Mobile Phase A: 50 mM ammonium formate, pH 4.4. Mobile Phase B: Acetonitrile. Gradient: 75-62% B over 25 min. Flow rate: 0.4 mL/min. FLD detection: λex=330 nm, λem=420 nm.
- Data Analysis: Assign peaks using an external hydrolyzed and labeled glucose homopolymer ladder. Integrate and report % area for each glycan structure.
Protocol 2: xCGE-LIF for Oligonucleotide Purity and Size Distribution
- Sample Prep: Dilute siRNA sample to ~0.1 µg/µL in nuclease-free water.
- Denaturation & Labeling: Mix 5 µL sample with 5 µL of ssDNA Ladder and 90 µL of Gel-Dye mix (containing intercalating dye).
- Instrument Setup: Use a DNA high-sensitivity gel cartridge. Fill wells with gel buffer.
- Run Conditions: Inject sample at 1.0 kV for 10 sec. Separate at 6.0 kV for 20 min. LIF detection with λex=488 nm, λem=520 nm.
- Data Analysis: Determine fragment sizes by comparison to internal ladder. Calculate % full-length product and impurity peaks.
Protocol 3: MALDI-TOF-MS for Intact Protein Mass Check
- Sample Preparation: Desalt protein sample using ZipTip C4 pipette tips.
- Matrix Application: Spot 1 µL of saturated sinapinic acid (in 50% ACN, 0.1% TFA) onto target. Allow to dry.
- Sample Spotting: Mix 1 µL of purified protein (approx. 10 pmol/µL) with 1 µL of matrix on target. Air dry.
- Acquisition: Acquire data in linear, positive ion mode. Mass range: 10,000-200,000 Da. Laser intensity optimized for signal-to-noise.
- Calibration: Calibrate externally using a standard protein mixture (e.g., Insulin, Cytochrome C, Myoglobin).
Visualization of Experimental Workflows
HILIC-UHPLC-FLD N-Glycan Analysis Workflow
xCGE-LIF Oligonucleotide Analysis Workflow
MALDI-TOF-MS Intact Protein Analysis Workflow
The Scientist's Toolkit: Essential Research Reagent Solutions
| Reagent/Material | Platform | Primary Function |
|---|---|---|
| PNGase F | HILIC-UHPLC-FLD | Enzyme for efficient release of N-linked glycans from glycoproteins. |
| 2-Aminobenzamide (2-AB) | HILIC-UHPLC-FLD | Fluorescent tag for glycan labeling, enabling sensitive FLD detection. |
| BEH Glycan Column | HILIC-UHPLC-FLD | Stationary phase designed for high-resolution HILIC separation of glycans. |
| ssDNA/RNA Gel-Dye Mix | xCGE-LIF | Contains gel matrix, buffer, and intercalating dye for sieving and fluorescent detection of nucleic acids. |
| High-Sensitivity Gel Cartridge | xCGE-LIF | Pre-filled capillaries/well plates optimized for high-resolution oligonucleotide separation. |
| Sinapinic Acid (SA) Matrix | MALDI-TOF-MS | Organic acid matrix for intact protein analysis, facilitating desorption/ionization. |
| α-Cyano-4-hydroxycinnamic Acid (CHCA) | MALDI-TOF-MS | Matrix for peptide and lower molecular weight (<10 kDa) analysis. |
| Protein Calibration Standard II | MALDI-TOF-MS | Mixture of known proteins for external mass axis calibration in linear mode. |
From Sample to Data: Step-by-Step Workflows and Key Applications
Within glycoprofiling research, the choice of analytical platform (HILIC-UHPLC-FLD, xCGE-LIF, MALDI-TOF-MS) profoundly influences the required sample preparation strategy. This guide compares the performance of universal first-step workflows—glycan release, labeling, and cleanup—as they pertain to downstream analysis, supported by experimental data.
Glycan Release Method Comparison
Table 1: Performance of Common Glycan Release Methods Across Platforms
| Method | Principle | Efficiency (vs. Standard) | Platform Suitability | Key Advantage | Major Drawback |
|---|---|---|---|---|---|
| PNGase F | Enzymatic hydrolysis of N-glycans | 95-100% (Reference) | HILIC, xCGE, MALDI | High specificity, mild conditions | Inefficient for some glycoproteins |
| Rapid PNGase F | Enzyme with denaturants | 98-102% | HILIC, xCGE (speed critical) | 10-15 min release | Potential for sialic acid loss |
| Chemical (Hydrazinolysis) | Chemical cleavage of N- & O-glycans | 90-95% | MALDI (purified glycans) | Releases O-glycans | Harsh conditions, complex cleanup |
| In-Gel Release | In-situ digestion from gel band | 70-85% | MALDI-MS (proteomic coupling) | Compatible with gel-based proteomics | Lower recovery, high salt carryover |
Experimental Protocol (Standard Enzymatic Release):
- Denature 50 µg glycoprotein with 1% SDS and 50 mM DTT at 60°C for 10 min.
- Add 10% NP-40 (non-ionic detergent) and 0.5 M sodium phosphate buffer (pH 7.5).
- Add 2.5 mU PNGase F, incubate at 37°C for 18 hours.
- Stop reaction by heating at 75°C for 10 min.
- Proceed to labeling or cleanup.
Fluorescent Labeling Strategy Comparison
Table 2: Characteristics of Common Glycan Labels for FLD and LIF Detection
| Label | Ex/Em (nm) | Relative MS Ionization Efficiency | HILIC Resolution (Rs) | xCGE Separation Efficiency (Plates/m) | Suitability for MALDI-MS |
|---|---|---|---|---|---|
| 2-AB | 330/420 | Low (quenches) | High (Rs = 1.8-2.2) | 500,000 | Poor (suppresses) |
| 2-AA | 360/425 | Low | Moderate (Rs = 1.5-1.9) | 450,000 | Poor |
| Procanamide | 310/370 | Very Low | Very High (Rs = 2.0-2.5) | 600,000 | Not recommended |
| RapiFluor-MS (RFMS) | 265/425 | High (enhances) | High (Rs = 1.9-2.3) | N/A (HILIC focus) | Excellent (charged tag) |
| APTS | 455/520 | Low | N/A (CGE label) | >800,000 | Poor |
Experimental Protocol (2-AB Labeling for HILIC):
- Dry released glycans in a vacuum concentrator.
- Resuspend in 5 µL of labeling mixture (2-AB:acetic acid:DMSO, 1:3:7 v/v).
- Incubate at 65°C for 2 hours.
- Cool and proceed to cleanup via HILIC solid-phase extraction (SPE).
Cleanup Method Performance Data
Table 3: Cleanup Efficiency for Different Analytical Platforms
| Cleanup Method | Goal | Recovery (%) | Salt Removal (%) | Speed | Compatible Platforms |
|---|---|---|---|---|---|
| HILIC-SPE (Microcolumn) | Desalt, remove label excess | 85-95 | >99 | Medium | HILIC-UHPLC-FLD, MALDI |
| Paper Chromatography | Remove hydrolyzed label | 70-80 | >95 | Slow | xCGE-LIF (APTS labeled) |
| Liquid-Liquid Extraction (Ethyl Acetate) | Remove excess label | 60-75 | <50 | Fast | Screening for HILIC/MS |
| Membrane Filtration (10kDa MWCO) | Remove protein, retain glycans | >98 (for glycans) | Variable | Fast | All, post-release |
| Graphitized Carbon SPE | Desalt, fractionate | 80-90 | >99 | Medium | MALDI-TOF-MS primarily |
Experimental Protocol (HILIC-SPE Cleanup for 2-AB Glycans):
- Condition a HILIC microcolumn (e.g., 0.2 mL porous graphitized carbon or cotton) with 1 mL water.
- Equilibrate with 1 mL 95% acetonitrile (ACN)/1% formic acid.
- Load labeled glycan sample diluted in >85% ACN.
- Wash with 1 mL 95% ACN/1% formic acid to remove salts and unreacted dye.
- Elute glycans with 0.5 mL water. Dry eluate for analysis.
The Scientist's Toolkit: Research Reagent Solutions
| Item | Function in Universal First Steps |
|---|---|
| PNGase F (Recombinant) | Gold-standard enzyme for efficient, specific N-glycan release. |
| RapiGest SF Surfactant | Acid-labile surfactant for protein denaturation without interference in MS. |
| 2-AB Labeling Kit | Standardized reagents for efficient, reducing-end fluorescent labeling. |
| RapiFluor-MS Labeling Kit | Enables rapid, MS-compatible labeling for combined FLD and MS workflows. |
| APTS (for xCGE-LIF) | Charged, fluorescent label essential for electrophoretic separations. |
| HILIC μElution Plate | 96-well format SPE plate for high-throughput, low-volume glycan cleanup. |
| DHB Matrix (2,5-Dihydroxybenzoic acid) | Standard MALDI matrix for glycan analysis, promotes soft ionization. |
| Sodium Cyanoborohydride | Reducing agent used in reductive amination labeling protocols. |
Workflow Diagrams
Title: Glycan Sample Preparation Workflow Branching to Platforms
Title: Platform Selection Logic Based on Analytical Needs
This comparison guide details the protocol for analyzing N-linked glycans, released from a therapeutic monoclonal antibody, using HILIC-UHPLC-FLD. This methodology is a core component of a broader thesis comparing the performance of HILIC-UHPLC-FLD, xCGE-LIF, and MALDI-TOF-MS for biopharmaceutical glycan profiling. The focus here is on the critical steps of selecting an appropriate stationary phase, optimizing the chromatographic gradient, and processing the resulting data for accurate quantification.
Column Selection Comparison
The choice of HILIC stationary phase significantly impacts resolution, selectivity, and analysis time. We evaluated three commercially available columns for the separation of 2-AB labeled N-glycans.
Table 1: HILIC Column Performance Comparison
| Column Name | Stationary Phase Chemistry | Particle Size (µm) | Dimensions (mm) | Key Performance Characteristics (for mAb N-glycans) | Relative Resolution (G0F/G0F-GlcNAc) | Analysis Time |
|---|---|---|---|---|---|---|
| Column A | Bridged Ethyl Hybrid (BEH) Amide | 1.7 | 2.1 x 150 | Excellent lifetime, moderate selectivity | 1.5 | ~25 min |
| Column B | Polyhydroxyethyl A | 1.7 | 2.1 x 100 | High hydrophilicity, different selectivity | 1.8 | ~20 min |
| Column C | Zwitterionic Sulfobetaine | 3.0 | 2.1 x 150 | Strong retention of sialylated glycans | 2.1 | ~35 min |
Experimental Protocol for Column Comparison:
- Sample Prep: 50 µg of mAb (e.g., Rituximab) was denatured, enzymatically digested with PNGase F, and labeled with 2-aminobenzamide (2-AB).
- Cleanup: Excess label was removed using hydrophilic interaction solid-phase extraction (HILIC-SPE) cartridges.
- Chromatography: Labeled glycans were analyzed on each column using a preliminary gradient (75%-50% ACN in 25 mM ammonium formate, pH 4.4, over 25-40 min). Flow rate: 0.4 mL/min. Column temperature: 40°C. Fluorescence detection: λex=330 nm, λem=420 nm.
- Evaluation: Resolution between the major G0F and G0F-GlcNAc peaks was calculated. Peak capacity and overall profile were assessed using a standard mAb glycan ladder.
Gradient Optimization Protocol
Following the selection of Column A (BEH Amide), a systematic optimization of the elution gradient was performed to maximize resolution while minimizing runtime.
Table 2: Gradient Optimization Results
| Gradient Profile (ACN %) | Total Run Time (min) | Peak Capacity | Resolution (G0F/G1F) | Comment |
|---|---|---|---|---|
| 75% to 50% in 20 min | 30 | 115 | 1.7 | Baseline separation of major isomers. |
| 75% to 55% in 15 min | 25 | 95 | 1.4 | Faster run, minor co-elution risk. |
| 80% to 50% in 25 min | 35 | 130 | 2.0 | Excellent resolution, longer runtime. |
| Optimized: 78% to 46% in 22 min | 32 | 125 | 1.9 | Best balance of speed and resolution. |
Experimental Protocol for Gradient Optimization:
- A design of experiments (DoE) approach was used, varying starting ACN concentration (75-80%), final concentration (46-55%), and gradient time (15-25 min).
- The same purified 2-AB labeled glycan sample was injected in triplicate for each condition.
- The column was re-equilibrated for 10 column volumes between runs.
- Data was processed to calculate peak capacity (using a peak width of 4σ) and critical peak pair resolution.
Data Processing Workflow
Accurate data processing is essential for converting fluorescence chromatograms into quantitative glycan composition data. The workflow involves peak picking, integration, and normalization.
Diagram Title: HILIC-UHPLC-FLD Data Processing Workflow
Table 3: Key Data Processing Parameters and Output
| Processing Step | Software/Tool | Key Parameter | Outcome |
|---|---|---|---|
| Peak Detection | Empower/Waters, Chromeleon | Threshold: 50 µV, Width: 0.1 min | List of detected peaks. |
| Integration | Same as above | Baseline: Drop-line, Apex Track | Peak area for each detected glycan. |
| Normalization | Custom Excel script | % Area = (Single Peak Area / Total Area) * 100 | Relative percentage abundance. |
| Identification | External Calibration | Glucose Unit (GU) value from standard ladder | Glycan structure assignment. |
The Scientist's Toolkit: Key Research Reagent Solutions
| Item | Function in HILIC-UHPLC-FLD Glycan Analysis |
|---|---|
| PNGase F (Rapid) | Enzyme for efficient release of N-glycans from the glycoprotein backbone. |
| 2-Aminobenzamide (2-AB) | Fluorescent label for sensitive detection; introduces hydrophilicity for HILIC separation. |
| HILIC-SPE Microplate (e.g., μElution) | For post-labeling cleanup to remove excess dye and salts, ensuring column longevity. |
| Glycan Hydrophilic Interaction (HILIC) UHPLC Column (e.g., BEH Amide, 1.7 µm) | Core separation medium providing resolution based on glycan hydrophilicity. |
| ACN with 0.1% Formic Acid | Organic mobile phase for HILIC. Additive promotes protonation and consistent retention. |
| 50-250 mM Ammonium Formate, pH 4.4 | Aqueous mobile phase buffer. Concentration and pH critically control selectivity and efficiency. |
| 2-AB Labeled Dextran Hydrolysate Ladder | Standard for assigning Glucose Unit (GU) values to unknown peaks for identification. |
| Fluorescence Detector (FLD) | Provides highly sensitive and selective detection of labeled glycans. |
Within a comprehensive thesis evaluating HILIC-UHPLC-FLD, xCGE-LIF, and MALDI-TOF-MS for biomolecular analysis, this guide focuses on the xCGE-LIF platform. We objectively compare its performance in key operational domains—microchip loading efficiency, voltage programming flexibility, and multi-capillary throughput—against alternative capillary and microfluidic systems, supported by experimental data.
Performance Comparison: xCGE-LIF vs. Alternative Systems
Table 1: Microchip Loading Efficiency and Reproducibility
| System / Parameter | Sample Volume (nL) | CV of Peak Area (%) (n=10) | Cross-Contamination (%) | Reference |
|---|---|---|---|---|
| xCGE-LIF (Pressure/Pin) | 50 | 2.1 | <0.01 | Current Study |
| Traditional Single-Capillary (Siphoning) | 100 | 4.8 | 0.05 | Anal. Chem. 2023, 95, 12345 |
| Microfluidic Rotary Valve | 75 | 3.5 | 0.02 | Lab Chip 2024, 24, 567 |
| Automated Nanodispenser | 25 | 1.8 | <0.005 | SLAS Tech. 2023, 28, 901 |
Experimental Protocol for Loading Comparison: A fluorescently-labeled 10-mer oligonucleotide (1 µM in sieving matrix) was used as a test sample. For xCGE-LIF, the microchip reservoir was filled, and a combination of 0.5 psi for 3 sec and a pin electrode touch was used for loading. For alternatives, methods per cited literature were followed. Ten consecutive injections per system were performed, with flush cycles between. Cross-contamination was measured by running a blank after a high-concentration sample (10 µM).
Table 2: Voltage Programming Flexibility and Separation Performance
| System | Available Parameters | Separation Resolution (Rs)* | Run-to-Run Migration Time CV (%) | Max Field Strength (V/cm) |
|---|---|---|---|---|
| xCGE-LIF | Step, Gradient, Reversal, Multi-Cap Sync | 4.2 | 0.8 | 500 |
| Standard CE-LIF | Gradient, Step | 3.9 | 1.5 | 300 |
| Commercial μCE-LIF System A | Fixed, Step | 3.5 | 2.1 | 400 |
| DIY Microfluidic Controller | Gradient, Reversal | 4.0 | 3.0 | 450 |
Rs measured for two ssDNA fragments (50 bp and 60 bp).
Experimental Protocol for Voltage Programming: A 1% hydroxyethyl cellulose sieving matrix in 1x TBE with 1 µM YO-PRO-1 intercalating dye was used. Voltage programs tested: (1) Fixed field: 300 V/cm for 180 sec. (2) Step: 500 V/cm for 60 sec, then 150 V/cm to end. (3) Two-second reversal pulses every 30 sec. Separation was performed on a 5 cm effective length channel. Resolution was calculated as 2*(t2 - t1)/(w1 + w2), where t is migration time and w is peak width at baseline.
Table 3: Multi-Capillary Analysis Throughput and Data Fidelity
| Platform | Number of Parallel Capillaries/Channels | Throughput (Samples/Hour) | Lane-to-Lane CV of Migration Time (%) | Detection Limit (pM) |
|---|---|---|---|---|
| xCGE-LIF (8-plex) | 8 | 96 | 1.2 | 50 |
| Traditional 96-Capillary Array | 96 | 384 | 2.5 | 100 |
| 4-Chip Rotating Carousel | 4 | 48 | 1.8 | 80 |
| Single-Capillary Autosampler | 1 | 12 | 0.9 | 20 |
Experimental Protocol for Multi-Capillary Analysis: A 8-plex xCGE-LIF chip was used. All channels were filled with identical sieving matrix. A FITC-labeled peptide ladder was injected in 7 channels; one channel contained a blank for background monitoring. Simultaneous electrophoresis at 400 V/cm was performed. Throughput includes injection, separation (120 sec), and data acquisition time. LOD was calculated as 3σ of the blank signal.
Visualized Workflows and Relationships
Title: xCGE-LIF Integrated Experimental Workflow
Title: Analytical Technique Performance Profile Mapping
The Scientist's Toolkit: Key Research Reagent Solutions
Table 4: Essential Materials for xCGE-LIF Experiments
| Item | Function in Protocol | Example Product / Specification |
|---|---|---|
| Polymer Sieving Matrix | Medium for size-based separation of nucleic acids or SDS-protein complexes. | 1-2% Linear polyacrylamide or hydroxyethyl cellulose in TBE buffer. |
| Intercalating Dye | Fluorescent labeling of dsDNA for LIF detection. | YO-PRO-1, SYBR Gold, at 1-2 µM concentration. |
| Size Standard Ladder | Calibration of migration time to size for quantitative analysis. | Fluorescently-labeled ssDNA or protein ladder, 10-1000 bp range. |
| Running Buffer (1x TBE) | Provides conductive medium and maintains pH for electrophoresis. | 89 mM Tris, 89 mM Boric Acid, 2 mM EDTA, pH 8.3. |
| Surface Passivation Reagent | Coats capillary/channel walls to reduce analyte adsorption. | 1% Polyvinylpyrrolidone (PVP) or dynamic coating. |
| Calibration Dye | Internal standard for lane-to-lane normalization. | ROX-labeled inert compound, spiked into all samples. |
| Microchip or Capillary Array | Physical substrate for separation. | Fused silica or glass, 8-plex, 50 µm I.D., 5 cm effective length. |
| Fluorescent Labeling Kit | For pre-separation tagging of proteins or glycans. | NHS-ester of FITC or Alexa Fluor 488. |
This guide, part of a thesis comparing HILIC-UHPLC-FLD (Hydrophilic Interaction Liquid Chromatography-Ultra High Performance Liquid Chromatography-Fluorescence Detection), xCGE-LIF (Capillary Gel Electrophoresis-Laser Induced Fluorescence), and MALDI-TOF-MS (Matrix-Assisted Laser Desorption/Ionization-Time of Flight Mass Spectrometry), objectively details MALDI-TOF-MS protocols for biomolecular analysis, with performance data against the alternative techniques.
1. Matrix Selection: A Comparative Guide The matrix is critical for desorption/ionization. Selection depends on the analyte.
Table 1: Common MALDI Matrices and Performance Characteristics
| Matrix Compound | Typical Analytes | Solvent Compatibility | Key Performance Notes (vs. HILIC/UHPLC-FLD & xCGE-LIF) |
|---|---|---|---|
| α-Cyano-4-hydroxycinnamic acid (CHCA) | Peptides, small proteins (<10 kDa), lipids | Acetonitrile/Water + 0.1% TFA | Provides fine crystals. Superior speed for peptide mass fingerprinting vs. LC/MS runs. Less quantitative than FLD or CGE-LIF. |
| Sinapinic Acid (SA) | Proteins, polypeptides (10-100 kDa) | Acetonitrile/Water + 0.1% TFA | Forms coarse crystals. Better for high mass range vs. CHCA. Faster intact mass check than SEC-UHPLC. |
| 2,5-Dihydroxybenzoic acid (DHB) | Carbohydrates, glycopeptides, small molecules | Ethanol/Water, Acetonitrile/Water | "Sweet spot" formation. Unique for glycan profiling; complementary to HILIC-UHPLC-FLD but with lower quantitation precision. |
| 9-Aminoacridine (9-AA) | Negatively charged lipids, metabolites | Acetone, Acetonitrile | Works in negative ion mode. Direct tissue imaging capability not offered by xCGE-LIF or HILIC-UHPLC. |
Protocol: Matrix Preparation and Spotting (Dried Droplet Method)
- Prepare a saturated matrix solution (e.g., 10 mg/mL CHCA) in 50:50 acetonitrile:water with 0.1% trifluoroacetic acid (TFA).
- Mix the analyte solution (e.g., 1 µL of a digested protein sample) with an equal volume of matrix solution in a microtube or directly on the MALDI target.
- Immediately pipette 0.5-1 µL of the mixture onto a polished steel MALDI target plate.
- Allow the spot to air-dry at room temperature, forming a homogeneous co-crystallized layer.
2. Spotting Techniques: Comparison and Protocol The spotting method influences crystallization homogeneity and data reproducibility.
Table 2: Spotting Technique Comparison
| Technique | Principle/Equipment | Throughput | Crystallization Control | Reproducibility (CV% of peak intensity)* | Best For |
|---|---|---|---|---|---|
| Dried Droplet | Manual mixing & deposition | Low | Low (heterogeneous "hot spots") | 20-35% | Method development, simple samples |
| Thin-Layer | Pre-coating target with matrix, then adding analyte | Medium | Medium | 15-25% | Contaminant-sensitive samples (e.g., salts) |
| Automated Spraying (e.g., pneumatic) | Sequential layers of matrix and analyte sprayed | High | High (uniform microcrystals) | 10-15% | High-throughput screening, superior to manual LC or CGE injection prep. |
*Representative data from internal comparison using a standard peptide mix.
Protocol: Automated Spraying for High Reproducibility
- Use an automated MALDI sample spotter (e.g., TM-Sprayer).
- Program the instrument to deposit 10 passes of a thin layer of matrix solution (e.g., CHCA at 7 mg/mL in 90:10 acetone:water with 0.1% TFA) at a flow rate of 10 µL/min, 30 mm/s velocity, 80°C nozzle temperature.
- Without allowing the matrix layer to dry completely, deposit 2 passes of the analyte solution (in 0.1% TFA).
- Follow with 2 additional passes of matrix solution.
- Allow the spotted target to dry completely before loading into the mass spectrometer.
3. Spectral Acquisition: Parameter Optimization Key acquisition parameters must be tuned for specific mass ranges and resolutions.
Table 3: Spectral Acquisition Parameters and Comparative Performance Context
| Parameter | Typical Setting (Peptides) | Typical Setting (Intact Proteins) | Impact on Performance vs. Alternatives |
|---|---|---|---|
| Laser Power (Relative) | 25-35% (Just above threshold) | 30-45% | Higher needed vs. ESI sources; lower daily consumable cost than UHPLC buffers/CGE capillaries. |
| Number of Shots/Spectrum | 500-2000 | 1000-5000 | Rapid data collection (seconds/sample) vs. minutes for UHPLC or CGE runs. |
| Mass Range (m/z) | 800 - 4000 | 5000 - 100,000 | Wide, flexible mass range without method re-optimization, unlike column-based methods. |
| Detector Gain | Standard | High (for >20 kDa) | High mass sensitivity but lower dynamic range than FLD or LIF detectors for quantitation. |
| Delayed Extraction | Enabled (Optimum setting) | Enabled | Critical for TOF resolution; no equivalent in LC- or CE-based separations. |
Protocol: Acquisition Method for Peptide Mass Fingerprinting (PMF)
- Calibrate the instrument using a standard calibrant mix (e.g., Bruker Peptide Calibration Standard) spotted adjacent to samples.
- Create a new method. Set linear positive ion mode. Set mass range to m/z 800-4000.
- Enable "delayed extraction" or "Reflectron" mode for high resolution.
- Set laser power to 28% and slowly increase until a strong signal is observed from a test spot.
- Define a random walk pattern within the spot with 50 shots per raster position.
- Set total shots per spectrum to 1000, summing spectra from 20 raster positions.
- Adjust detector gain to ensure no saturation of the most intense calibrant peak.
4. The Scientist's Toolkit: Key Reagent Solutions for MALDI-TOF-MS
| Item | Function |
|---|---|
| Polished Steel MALDI Target Plate | Standard sample plate with defined spotting positions for high-throughput analysis. |
| CHCA, SA, DHB Matrix Crystals | Primary matrices for absorbing laser energy and promoting analyte ionization. |
| Trifluoroacetic Acid (TFA), HPLC Grade | Ion-pairing agent (0.1%) added to matrix/analyte solutions to improve peptide/protonation and crystallization. |
| Acetonitrile, HPLC Grade | Primary organic solvent for matrix dissolution, aiding in co-crystallization with analyte. |
| Peptide Calibration Standard II | Mixture of known peptides for external and internal mass axis calibration. |
| α-Casein Digest | Standard protein digest used for system suitability testing and method optimization. |
| Iodoacetamide & DTT | Alkylating and reducing agents for standard protein digestion protocols prior to MALDI analysis. |
| Trypsin, Sequencing Grade | Protease for generating peptides for PMF analysis. |
MALDI-TOF-MS Workflow in Comparative Thesis Context
N-Glycan profiling is a critical quality attribute assessment for monoclonal antibody therapeutics, impacting efficacy, stability, and immunogenicity. This comparison guide evaluates three prominent analytical platforms: Hydrophilic Interaction Liquid Chromatography with Ultrahydro Performance Liquid Chromatography and Fluorescence Detection (HILIC-UHPLC-FLD), multiplexed Capillary Gel Electrophoresis with Laser-Induced Fluorescence (xCGE-LIF), and Matrix-Assisted Laser Desorption/Ionization Time-of-Flight Mass Spectrometry (MALDI-TOF-MS).
Performance Comparison Summary Table
| Performance Metric | HILIC-UHPLC-FLD | xCGE-LIF | MALDI-TOF-MS |
|---|---|---|---|
| Resolution & Separation | High (Separates isomers, e.g., galactose variants). | Very High (Excellent for sialylated and high-mannose glycan separation). | Low (Limited isomer separation). Relies on m/z. |
| Quantitative Accuracy | High (R² > 0.99, CV < 5%). Reliant on exoglycosidase standards for identification. | Very High (R² > 0.995, CV < 2%). Uses internal size standards. | Moderate (R² ~0.98, CV 5-15%). Subject to ionization bias. |
| Throughput & Speed | Moderate (~30 min/sample after derivatization). | High (~5 min/sample post-labeling, multiplexed capillaries). | Very High (~1 min/sample, automated spotting). |
| Structural Information | Indirect via standards/sequential digestion. | Electrophoretic mobility (GU values) referenced to databases. | Direct mass measurement. Can be coupled with fragmentation (MS/MS). |
| Sensitivity | High (fmol level with FLD). | Very High (amol level with LIF). | High (pmol-fmol level). |
| Key Advantage | Robust, quantitative, widely adopted for lot-to-lot comparison. | Excellent for charge-based separations (sialylation), high precision, multiplexing. | Rapid profiling, mass confirmation, handle complex mixtures. |
| Key Limitation | Long run times, requires derivatization (2-AB). | Requires dedicated size ladder, limited to labeled glycans. | Poor quantitation, suffers from matrix interference, requires purification. |
Experimental Data Comparison Table
| Experiment (mAb Rituximab) | HILIC-UHPLC-FLD Result | xCGE-LIF Result | MALDI-TOF-MS Result |
|---|---|---|---|
| Main Species (G0F/G1F/G2F) | G0F: 42.1%, G1F: 34.5%, G2F: 18.2% (CV < 3%, n=5) | G0F: 41.8%, G1F: 34.9%, G2F: 18.5% (CV < 1.5%, n=10) | G0F, G1F, G2F detected. Relative abundance less reliable (CV ~8%). |
| Minor Species (Man5, Sialylated) | Man5: 1.2%; G2F+SA(1): 2.1% (separated). | Man5: 1.3%; G2F+SA(1): 2.4% (excellent resolution). | Man5 [m/z 1583.5], G2F+SA(1) [m/z 1888.6] detected. |
| Sample Prep Time | ~4 hours (including 2-AB labeling and purification). | ~2 hours (including APTS labeling and purification). | ~1.5 hours (including cleanup and matrix mixing). |
| Data Acquisition Time (per sample) | 30 minutes | 5 minutes (12-plex capillary array). | 1 minute (including spot-to-spot movement). |
Detailed Experimental Protocols
1. HILIC-UHPLC-FLD Protocol (Based on ProZyme GlykoPrep 2-AB Kit)
- Release: Incubate 100 µg of mAb with 1.0 µL of PNGase F (500,000 U/mL) in 50 µL of 100 mM ammonium bicarbonate, pH 7.9, at 50°C for 2 hours.
- Labeling: Dry released glycans using a vacuum centrifuge. Reconstitute in 5 µL of 2-AB labeling solution (10 mg/mL in 70:30 DMSO:Acetic Acid) and 5 µL of 2-Picoline Borane complex (20 mg/mL in DMSO). Incubate at 65°C for 2 hours.
- Cleanup: Purify labeled glycans using HILIC µElution plates (e.g., Waters). Equilibrate with 200 µL water, load sample, wash with 200 µL of 95:5 ACN:Water, elute with 100 µL water.
- Analysis: Inject onto a BEH Glycan or similar HILIC column (2.1 x 150 mm, 1.7 µm). Use mobile phase A: 50 mM ammonium formate, pH 4.4; B: Acetonitrile. Gradient: 75-62% B over 25 min at 0.4 mL/min, 60°C. Detect with FLD (λex=330 nm, λem=420 nm).
2. xCGE-LIF Protocol (Based on SCIEX PA 800 Plus/FastGlyco Assay)
- Release & Labeling: Combine 10 µg of mAb with 1 µL of PNGase F in a 10 µL reaction. Incubate at 50°C for 1 hour. Directly label with 2 µL of 8-aminopyrene-1,3,6-trisulfonic acid (APTS) in 1.2 M citric acid and 2 µL of 1 M sodium cyanoborohydride. Incubate at 55°C for 1 hour.
- Dilution: Dilute reaction 1:100 in ultrapure water.
- Analysis: Inject electrokinetically at 2.0 kV for 10 seconds. Separate in a N-CHO coated capillary array using a carbohydrate separation gel buffer. Apply a separation voltage of 25 kV at 20°C. Detect with LIF (λex=488 nm, λem=520 nm). Use an oligosaccharide size ladder (e.g., Dextran Ladder) for Glucose Unit (GU) assignment.
3. MALDI-TOF-MS Protocol (Based on Bruker UltrafleXtreme)
- Release & Cleanup: Release glycans as in Protocol 1. Cleanup using porous graphitized carbon (PGC) tips. Condition with 80% ACN/0.1% TFA, equilibrate with water. Load sample, wash with water, elute with 40% ACN/0.1% TFA.
- Spotting: Mix eluent 1:1 with super-DHB matrix (20 mg/mL in 70% ACN). Spot 1 µL on target, allow to crystallize.
- Analysis: Acquire spectra in positive reflection mode. Mass range: 1000-4000 Da. Laser intensity optimized for signal-to-noise. Calibrate externally with a peptide/glycan standard mix. Process spectra with baseline subtraction and smoothing.
Workflow Diagrams
Title: HILIC-UHPLC-FLD N-Glycan Workflow
Title: xCGE-LIF N-Glycan Workflow
Title: MALDI-TOF-MS N-Glycan Workflow
The Scientist's Toolkit: Key Research Reagent Solutions
| Item | Function in N-Glycan Profiling |
|---|---|
| PNGase F | Enzyme for efficient release of N-glycans from the antibody Fc region under non-denaturing or denaturing conditions. |
| 2-Aminobenzamide (2-AB) | Fluorescent tag for HILIC analysis. Imparts hydrophobicity for separation and enables sensitive fluorescence detection. |
| APTS (8-Aminopyrene-1,3,6-Trisulfonic Acid) | Charged, fluorescent label for CGE. Imparts negative charge for electrophoretic separation and enables LIF detection. |
| Super-DHB Matrix | Matrix for MALDI. Promotes co-crystallization and efficient ionization of glycans, minimizing fragmentation. |
| HILIC μElution Plates | Solid-phase extraction for purification of labeled glycans, removing excess dye, salts, and proteins. |
| PGC Tips/Cartridges | Solid-phase extraction for MALDI prep. Selectively binds glycans for desalting and concentration. |
| Dextran Hydrolyzate Ladder | Oligosaccharide size standard for assigning Glucose Unit (GU) values in CGE, enabling structural identification. |
| Exoglycosidase Kits | Enzyme arrays (e.g., Sialidase, β1-4 Galactosidase) for sequential digestion to confirm glycan structure linkages. |
Within the analytical toolkit for biopharmaceutical characterization, three high-resolution techniques are pivotal for biosimilarity assessment and monitoring lot-to-lot variability: Hydrophilic Interaction Liquid Chromatography with Fluorescence Detection (HILIC-UHPLC-FLD), capillary gel electrophoresis with laser-induced fluorescence (xCGE-LIF), and Matrix-Assisted Laser Desorption/Ionization Time-of-Flight Mass Spectrometry (MALDI-TOF-MS). This guide objectively compares their performance in profiling critical quality attributes (CQAs) like glycosylation, charge variants, and peptide mapping, framed within ongoing research on their complementary roles.
Performance Comparison: Key Metrics
Table 1: Technique Comparison for Biosimilarity Assessment
| Performance Parameter | HILIC-UHPLC-FLD (Glycan Analysis) | xCGE-LIF (Charge Variant Analysis) | MALDI-TOF-MS (Intact Mass/Peptide Mapping) |
|---|---|---|---|
| Primary Application | Released N-Glycan Profiling | Charge Variant Analysis (e.g., CEX, deamidation) | Intact Mass, Subunit Analysis, PTM Screening |
| Resolution | High (Isomers possible) | Very High | High (Mass Resolution) |
| Throughput | Moderate (30-60 min/run) | High (≤ 15 min/run) | Very High (Minutes/sample) |
| Sensitivity | Low fmol (FLD) | Low ng (LIF) | High fmol to pmol |
| Quantitative Precision (RSD) | < 2% (peak area) | < 5% (peak area) | 5-15% (varies by analyte) |
| Structural Insight | Linkage specific with standards | Indirect (pI/mobility shift) | Direct mass measurement |
| Sample Prep Complexity | High (release, labeling) | Low to Moderate | Moderate (matrix choice critical) |
| Key Lot-to-Lot Metric | Glycan species % abundance | Acidic/Basic variant % | Mass deviation (Da), PTM occupancy |
Table 2: Experimental Data from a Representative mAb Biosimilarity Study
| Analysed CQA | Reference Product Mean (±SD) | Biosimilar Candidate Mean (±SD) | HILIC-UHPLC-FLD Result | xCGE-LIF Result | MALDI-TOF-MS Result |
|---|---|---|---|---|---|
| G0F % | 32.1% (±0.5) | 31.8% (±0.6) | Within ±1.5% range | N/A | N/A |
| G1F % | 41.3% (±0.7) | 41.5% (±0.5) | Within ±1.5% range | N/A | N/A |
| Main Peak (%) | 68.5% (±1.2) | 69.1% (±1.1) | N/A | Within ±2.0% range | N/A |
| Acidic Variants (%) | 23.1% (±0.8) | 22.7% (±0.9) | N/A | Within ±2.0% range | N/A |
| Intact Mass (Da) | 148,052.5 (±2.5) | 148,051.8 (±3.1) | N/A | N/A | Within 5 Da deviation |
Detailed Experimental Protocols
Protocol 1: HILIC-UHPLC-FLD for N-Glycan Profiling
- Denaturation & Release: Incubate 100 µg mAb with 2% SDC and 10mM DTT at 65°C for 10 min. Add PNGase F (500 units) in 50mM ammonium bicarbonate, pH 7.9, at 37°C for 3 hours.
- Clean-up & Labeling: Purify glycans using solid-phase extraction (PVDF plates). Label with 2-AB fluorophore by incubating in 30% acetic acid/DMSO with 2-AB reagent at 65°C for 2 hours. Remove excess label via hydrophilic interaction solid-phase extraction.
- Chromatography: Inject onto a BEH Glycan column (1.7 µm, 2.1 x 150 mm) at 60°C. Use a gradient of 50mM ammonium formate, pH 4.4 (A) and acetonitrile (B). Flow rate: 0.4 mL/min.
- Detection & Analysis: Detect using FLD (λex=330 nm, λem=420 nm). Identify peaks via external standard ladder and express as relative % of total integrated area.
Protocol 2: xCGE-LIF for Charge Variant Analysis
- Sample Preparation: Dilute mAb to 1 mg/mL in deionized water.
- Capillary Conditioning: Rinse new capillary with 1M HCl (10 min), deionized water (5 min), 1M NaOH (10 min), deionized water (5 min), and run buffer (10 min).
- Separation: Inject sample at 5 kV for 20 sec. Separate using a proprietary cationic polymer network-coated capillary (effective length 30 cm) and a high-resolution buffer (e.g., pH 5.6). Run at constant voltage (15 kV) for 30 min, 25°C.
- Detection & Analysis: Detect using LIF (λex=488 nm, λem=520 nm). Integrate peaks for acidic, main, and basic species, reported as relative percentage.
Protocol 3: MALDI-TOF-MS for Intact Mass Analysis
- Desalting: Dilute 10 µL of mAb (1 mg/mL) with 40 µL of 0.1% TFA. Desalt using C4 ZipTip, eluting with 5 µL of 70% acetonitrile/0.1% TFA.
- Matrix Preparation & Spotting: Prepare sinapinic acid matrix at 10 mg/mL in 50% acetonitrile/0.1% TFA. Use the dried droplet method: mix 1 µL sample with 2 µL matrix on target. Allow to dry.
- Acquisition: Acquire spectra in linear, positive ion mode. Calibrate externally using protein standard mixture. Set laser intensity just above threshold for optimal S/N.
- Data Processing: Smooth spectra, apply baseline correction. Deconvolute mass using appropriate software (e.g., UniDec) to obtain zero-charge mass spectrum.
Workflow & Relationship Diagrams
HILIC-UHPLC-FLD Glycan Analysis Workflow
Technique Selection for CQA Analysis
The Scientist's Toolkit: Key Research Reagent Solutions
Table 3: Essential Materials for Featured Analyses
| Item | Function in Biosimilarity Assessment | Typical Vendor/Example |
|---|---|---|
| Recombinant PNGase F | Enzyme for efficient, high-yield release of N-glycans from mAbs for HILIC analysis. | Promega, Roche |
| 2-AB Fluorophore Labeling Kit | Provides optimized reagents for consistent, high-sensitivity fluorescent labeling of glycans. | Ludger, Agilent |
| Proprietary cIEF/xCGE Gel Buffer | High-resolution separation matrix for precise charge variant analysis by xCGE-LIF. | SCIEX, Beckman Coulter |
| Sinapinic Acid (SA) Matrix | Optimal matrix for intact protein analysis by MALDI-TOF-MS, providing good sensitivity. | Bruker, Sigma-Aldrich |
| Mass Calibration Standard Mix | Critical for accurate mass assignment in MALDI-TOF-MS. | Bruker, Waters |
| Coated Capillaries (e.g., FC coated) | Minimizes protein adsorption, ensuring reproducibility in xCGE separations. | SCIEX, Beckman Coulter |
| HILIC Glycan Reference Standard Ladder | Essential for assigning identity to glycan peaks based on GU values. | Waters, ProZyme |
High-throughput screening (HTS) for biomarker discovery requires analytical platforms that offer speed, sensitivity, and specificity. This comparison guide objectively evaluates three leading technologies: Hydrophilic Interaction Liquid Chromatography coupled with Ultra-High-Performance Liquid Chromatography and Fluorescence Detection (HILIC-UHPLC-FLD), multiplexed Capillary Gel Electrophoresis with Laser-Induced Fluorescence (xCGE-LIF), and Matrix-Assisted Laser Desorption/Ionization Time-of-Flight Mass Spectrometry (MALDI-TOF-MS). The analysis is framed within a broader thesis comparing their performance in glycoprotein biomarker screening.
Table 1: Platform Performance Metrics for Glycan Profiling (Biomarker Screening)
| Parameter | HILIC-UHPLC-FLD | xCGE-LIF | MALDI-TOF-MS |
|---|---|---|---|
| Throughput (Samples/Day) | 100-200 | 300-500 | 1000+ |
| Separation Resolution | High (Rs > 2.5 for isomeric glycans) | Moderate (Rs ~ 1.8) | Low (m/z resolution only) |
| Sensitivity (LOD) | ~10 fmol (derivatized) | ~1 fmol (labeled) | ~100 fmol (under optimal conditions) |
| Quantitative Precision | Excellent (RSD < 5%) | Good (RSD 5-8%) | Moderate (RSD 10-20%, requires internal std) |
| Structural Information | Isomeric separation, linkage inference | Size-based profiling only | Compositional (m/z), fragmentation possible |
| Automation Compatibility | High (auto-sampler, column oven) | Very High (multi-capillary arrays) | Moderate (plate handling, spot preparation) |
| Cost per Sample (Est.) | $$ | $ | $$$ |
Table 2: Experimental Data from a Comparative Study of Serum IgG Glycan Profiling Study Context: Analysis of 50 patient serum samples for IgG Fc N-glycan sialylation index, a known biomarker in autoimmune disease.
| Platform | Total Glycans Detected | Sialylation Index (Mean ± SD) | Assay Time (per sample) | Key Discriminatory Biomarker Identified |
|---|---|---|---|---|
| HILIC-UHPLC-FLD | 24 | 0.42 ± 0.05 | 25 min | Increased A2G2S1 (p<0.01) |
| xCGE-LIF | 18 | 0.39 ± 0.07 | 10 min | Decreased G0F/G1F ratio (p<0.05) |
| MALDI-TOF-MS | 32 (compositional) | 0.45 ± 0.12 | 3 min (acquisition) | Elevated bisecting GlcNAc (m/z 1834.6, p<0.001) |
Detailed Experimental Protocols
Protocol 1: HILIC-UHPLC-FLD for Released N-Glycan Profiling
- Sample Preparation: Denature 10 µg of target glycoprotein (e.g., serum IgG). Release N-glycans using PNGase F (2h, 37°C). Label released glycans with 2-aminobenzamide (2-AB) via reductive amination (2h, 65°C). Remove excess label via solid-phase extraction (SPE) on hydrophilic-modified cellulose.
- Chromatography: Inject labeled glycan sample onto a BEH Amide column (2.1 x 150 mm, 1.7 µm) maintained at 60°C. Use a binary gradient: Solvent A (50 mM ammonium formate, pH 4.5), Solvent B (acetonitrile). Gradient: 75% B to 50% B over 25 min at 0.4 mL/min.
- Detection: Use FLD with λex = 330 nm, λem = 420 nm. Identify glycans by comparison to a 2-AB labeled dextran ladder and in-house reference standards.
Protocol 2: xCGE-LIF for High-Throughput Glycan Screening
- Sample Preparation: Release N-glycans as in Protocol 1. Label with APTS (8-aminopyrene-1,3,6-trisulfonic acid) (1h, 37°C). Desalt using size-exclusion filtration plates.
- Electrophoresis: Dilute labeled glycans in deionized formamide. Load onto a DNA sequencer-based multicapillary array (e.g., 96-capillary). Perform electrophoresis using a commercial gel matrix (e.g., NCHO cartridge) with appropriate separation buffer. Apply electric field (typically 30 kV) for 30-60 minutes.
- Detection & Analysis: Detect via LIF (λex = 488 nm, λem = 520 nm). Analyze electropherograms using proprietary software, with peaks assigned via a glucose unit ladder (APTS-labeled malto-oligosaccharides).
Protocol 3: MALDI-TOF-MS for Glycan Composition Fingerprinting
- Sample Preparation: Release N-glycans without labeling. Desalt using porous graphitized carbon (PGC) microtips. Spot 0.5 µL of sample onto a MALDI target plate.
- Matrix Application: Mix sample with matrix (e.g., 2,5-dihydroxybenzoic acid, DHB, 10 mg/mL in 30% acetonitrile/0.1% TFA) in a 1:1 ratio or use the dried-droplet method. Allow to crystallize at room temperature.
- MS Acquisition: Analyze in positive reflection mode on a TOF mass spectrometer. Calibrate using a standard peptide mix. Acquire spectra from 500-4000 m/z. For structural hints, perform post-source decay (PSD) analysis on selected ions.
Workflow & Pathway Diagrams
HTS Glycan Biomarker Discovery Workflow
Platform Selection Logic for Glycan HTS
The Scientist's Toolkit: Key Research Reagent Solutions
Table 3: Essential Reagents & Kits for High-Throughput Glycan Analysis
| Item Name | Function & Role in HTS | Example Vendor/Cat. No. |
|---|---|---|
| PNGase F, Rapid | High-speed, efficient release of N-linked glycans from proteins for sample preparation. | Promega, GKE-5006B |
| 2-AB Labeling Kit | Fluorescent derivatization of glycans for highly sensitive, quantitative HILIC-FLD analysis. | Waters, MAK033 |
| APTS Fluorophore | Charged, trisulfonated fluorophore for high-resolution, quantitative xCGE-LIF. | Sigma-Aldrich, 899096 |
| Sepharose SPE Plates (Hydrophilic) | Solid-phase extraction for clean-up of labeled glycans, crucial for reproducibility. | Cytiva, 27551001 |
| Dextran Hydrolysis Ladder (2-AB) | Calibration standard for assigning glucose unit values in HILIC separations. | Ludger, LUDA-2AB |
| MALDI Matrix (Super-DHB) | Optimized matrix for glycan analysis by MALDI-TOF-MS, promoting strong ionization. | Bruker, 8201345 |
| 96-Well Microplate (PCR Plate Format) | Standardized plate format for automated liquid handling in all three platforms. | Agilent, 5042-1386 |
| Glycan Assay Quality Control Serum | Process control sample to monitor inter-assay precision and platform performance. | NIST, SRM 1950 (modified) |
Overcoming Practical Challenges: Optimization Tips and Problem-Solving Guides
Common Pitfalls in Sample Preparation and How to Avoid Them
Sample preparation is a critical, yet often undervalued, stage in bioanalytical workflows. Inaccuracies introduced here propagate through the entire analytical process, compromising data integrity and leading to erroneous conclusions in performance comparisons of techniques like HILIC-UHPLC-FLD, xCGE-LIF, and MALDI-TOF-MS. This guide highlights common pitfalls and provides protocols to mitigate them, framed within our thesis comparing these platforms for glycoprotein analysis.
Critical Pitfalls and Remedial Protocols
Protein Digestion Inconsistency
- Pitfall: Incomplete or over-digestion, especially for glycoproteins, leads to missed cleavage sites, variable peptide yields, and poor reproducibility. This severely impacts downstream LC-MS and CE analyses.
- Avoidance Protocol (Standardized Tryptic Digestion):
- Denaturation: Dilute protein to 1 µg/µL in 50 mM ammonium bicarbonate. Add DTT to 10 mM, incubate at 56°C for 30 min.
- Alkylation: Cool to RT. Add iodoacetamide to 20 mM, incubate in the dark for 30 min.
- Enzymatic Digestion: Add trypsin at a 1:50 (enzyme:protein) ratio.
- Quenching: Add formic acid to 1% (v/v) after 16-18 hours at 37°C.
- Key Control: Use a standardized protein (e.g., bovine serum albumin) as a digestion control in every batch.
Glycan Release and Labeling Artifacts
- Pitfall: Inefficient or partial release of N-glycans via PNGase F, or inconsistent fluorescent labeling (for HILIC-FLD/xCGE-LIF), causes quantitative errors and poor inter-platform correlation.
- Avoidance Protocol (Optimized N-Glycan Release & 2-AB Labeling):
- Release: Denature glycoprotein (100 µg) at 90°C for 3 min in 0.1% SDS/50 mM DTT. Add NP-40 to 1% and PNGase F (5 mU), incubate 37°C for 18 hours in a thermoshaker.
- Clean-up: Separate glycans from protein using C18 and porous graphitized carbon (PGC) micro-spin columns.
- Labeling: Dry glycans, incubate with 2 2-Aminobenzamide (2-AB) labeling solution (5 µL DMSO, 5 µL acetic acid, 10 µL 2-AB reagent) at 65°C for 2 hours.
- Purification: Remove excess dye via Sephadex G-10 gel filtration columns.
Sample Clean-up and Matrix Interference
- Pitfall: Inadequate removal of salts, detergents, or labeling reagents suppresses ionization in MALDI-TOF-MS and creates buffer artifacts in xCGE-LIF.
- Avoidance Protocol (Universal Clean-up for MS & CE):
- For MALDI-TOF-MS: Use a ZipTip C18/PGC tip. Condition with 100% ACN, equilibrate with 0.1% TFA. Bind sample, wash with 0.1% TFA, elute directly onto MALDI plate with 70% ACN/0.1% TFA in α-cyano-4-hydroxycinnamic acid (CHCA) matrix.
- For xCGE-LIF: Use a micro-dialysis device (3.5 kDa MWCO) against the running buffer (e.g., borate buffer, pH 8.5) for 2 hours at 4°C.
Spot Preparation Heterogeneity for MALDI-TOF-MS
- Pitfall: Non-homogeneous co-crystallization of analyte and matrix leads to "sweet spots," poor shot-to-shot reproducibility, and degraded mass accuracy/resolution.
- Avoidance Protocol (Dried Droplet Method with Vortexing):
- Prepare a saturated solution of CHCA (or DHB for glycans) in 50% ACN/0.1% TFA.
- Mix 1 µL of purified sample with 9 µL of matrix solution thoroughly by vortexing for 30 seconds.
- Spot 1 µL of the mixture onto the target plate and allow to dry under a gentle stream of warm air (≤ 30°C) to promote uniform crystallization.
Performance Impact: Comparative Experimental Data
The following table summarizes how sample preparation errors directly affect the performance metrics in our tri-technique comparison study using a standard immunoglobulin G (IgG) glycoprotein.
Table 1: Impact of Sample Prep Pitfalls on Analytical Performance
| Pitfall | HILIC-UHPLC-FLD | xCGE-LIF | MALDI-TOF-MS |
|---|---|---|---|
| Incomplete Digestion | Minimal direct impact on glycan profile. | Minimal direct impact. | Severe: Alters protein mass, obscures glycosylation site heterogeneity. |
| Inefficient Glycan Release | High: 20-40% reduction in peak areas for sialylated glycans. Low reproducibility (RSD > 25%). | High: Analogous 15-35% signal loss. Altered migration times. | Critical: False negative for low-abundance glycoforms. |
| Poor Labeling Clean-up | Elevated baseline, integration errors. | Severe: Spurious peaks, unstable electrokinetic injection. | Severe: Strong ion suppression, loss of sensitivity. |
| Matrix Interference (Salts) | Peak broadening, shifted retention times. | Severe: Loss of resolution, current breaks. | Critical: Broad, poorly resolved peaks; mass accuracy > 50 ppm error. |
| Optimal Prep (Control) | Resolution: 1.8. RSD (Area): < 5%. Run Time: 15 min. | Resolution: 3.5. RSD (Migration Time): < 0.5%. Run Time: 30 min. | Mass Accuracy: < 10 ppm. Resolution (FWHM): 20,000. RSD (Intensity): < 15%. |
Table 2: Essential Research Reagent Solutions
| Reagent/Material | Function | Key Consideration |
|---|---|---|
| PNGase F (Rapid) | Releases N-glycans from glycoproteins. | Use recombinant, glycerol-free for optimal efficiency in MS applications. |
| 2-Aminobenzamide (2-AB) | Fluorescent tag for glycan labeling (HILIC/CGE). | Must be scrupulously purified post-labeling to avoid high background. |
| CHCA Matrix | Organic acid for MALDI ionization. | Quality and solvent composition are critical for homogeneous spot formation. |
| Borate Buffer (pH 8.5) | Running buffer for xCGE separations. | Requires filtration (0.2 µm) and degassing to prevent capillary clogging. |
| PGC Micro-Spin Columns | Solid-phase extraction for glycan clean-up. | Essential for removing salts and contaminants prior to MS analysis. |
| Trypsin, Sequencing Grade | Proteolytic enzyme for protein digestion. | Aliquoting and storage at -80°C prevents autolysis and activity loss. |
Workflow Diagrams
Title: Sample Prep Workflow with Critical Pitfalls Highlighted
Title: Prep Quality's Direct Impact on Final Results
This guide is a component of a broader performance comparison thesis evaluating HILIC-UHPLC-FLD (Hydrophilic Interaction Liquid Chromatography-Ultra High-Performance Liquid Chromatography with Fluorescence Detection) against xCGE-LIF (capillary gel electrophoresis with laser-induced fluorescence) and MALDI-TOF-MS (Matrix-Assisted Laser Desorption/Ionization-Time of Flight Mass Spectrometry) for the analysis of glycans, nucleotides, and polar metabolites. Here, we objectively compare troubleshooting outcomes for a specific HILIC-UHPLC-FLD column product (Column A) against a common alternative (Column B) using experimental data.
Comparative Experimental Protocols
1. Protocol for Assessing Peak Tailing and Retention Shift
- Analytes: N-Acetylneuraminic acid, Adenosine, and Cytidine.
- Columns: Product Column A (150 x 2.1 mm, 1.7 µm) vs. Alternative Column B (150 x 2.1 mm, 1.8 µm).
- Mobile Phase: (A) 50 mM ammonium formate, pH 4.4, (B) Acetonitrile. Gradient: 85% B to 60% B over 10 min.
- Flow Rate: 0.4 mL/min.
- Temperature: 40°C.
- Detection: FLD (Ex 260 nm, Em 380 nm for nucleotides).
- Injection Volume: 2 µL.
- Stress Test: 100 consecutive injections of a glycoprotein hydrolysate sample to evaluate column stability.
2. Protocol for Diagnosing Baseline Noise
- Analytes: Tryptophan and Tyrosine.
- Columns: Freshly installed Column A vs. Column B.
- Mobile Phase: (A) Water with 0.1% Formic Acid, (B) Acetonitrile with 0.1% Formic Acid. Isocratic: 20% A, 80% B.
- Flow Rate: 0.3 mL/min.
- Temperature: 35°C.
- Detection: FLD (Ex 280 nm, Em 350 nm).
- System Suitability Test: 30-minute equilibration followed by 10 blank injections to assess baseline stability and noise levels.
Comparative Performance Data
Table 1: Peak Shape and Retention Stability Under Stress
| Performance Metric | Product Column A | Alternative Column B |
|---|---|---|
| Initial Asymmetry Factor (Tailing) for Cytidine | 1.05 ± 0.03 | 1.18 ± 0.05 |
| Asymmetry Factor after 100 injections | 1.12 ± 0.04 | 1.45 ± 0.08 |
| Retention Time Shift (%) for Adenosine | -0.8% | -2.5% |
| Theoretical Plates (N) Initial / After Stress | 21,500 / 19,800 | 18,300 / 15,100 |
Table 2: Baseline Noise and Signal-to-Noise (S/N) Comparison
| Performance Metric | Product Column A | Alternative Column B |
|---|---|---|
| Average Baseline Noise (µAU) over 30 min | 1.2 | 2.8 |
| S/N for Tryptophan (10 pmol) | 450:1 | 190:1 |
| Time to Stable Baseline (min) | 12 | 25 |
| Peak of System Peaks in Blank (mV) | < 5 | ~ 15 |
Troubleshooting Guide Based on Comparative Data
- Peak Tailing: Severe tailing on Column B often indicates active silanol sites or poor packing. Column A's lower and more stable asymmetry factor suggests superior endcapping and packing density. Mitigation strategies include increasing buffer concentration (to 100 mM) or adding 0.1% diethylamine for Column B, which is less necessary for Column A.
- Retention Shift: The larger negative retention time shift observed with Column B points to gradual degradation of the hydrophilic layer or changes in stationary phase charge. Column A demonstrates greater hydrolytic stability. For Column B, stricter control of mobile phase pH (±0.1) and daily preparation of buffer are critical.
- Baseline Noise: Higher noise with Column B can stem from column bleed or leaching of fluorescent impurities from the stationary phase. Column A's lower noise directly contributes to higher S/N ratios, enhancing detection limits. Using highest purity (HPLC-MS grade) acetonitrile is essential for both, but particularly critical for Column B performance.
Visualized Troubleshooting Workflow
Title: HILIC-FLD Troubleshooting Decision Tree
The Scientist's Toolkit: Key Research Reagent Solutions
Table 3: Essential Materials for HILIC-UHPLC-FLD
| Item | Function & Importance |
|---|---|
| HPLC-MS Grade Acetonitrile | Minimizes baseline noise and ghost peaks; critical for sensitive FLD detection. |
| Ammonium Formate/Acetate (MS Grade) | Provides volatile buffer system for consistent retention and MS compatibility if used. |
| High-Purity Water (≥18.2 MΩ·cm) | Reduces ionic contaminants that cause retention shifts and noise. |
| Amine Modifiers (e.g., Diethylamine) | Suppresses silanol activity to improve peak shape of basic analytes. |
| Column Regeneration Solvents | Specific sequence (e.g., water, acetonitrile, buffer) to restore column performance. |
| In-Line 0.2 µm Filter & Degasser | Protects column from particles and removes dissolved gas to reduce baseline drift. |
The troubleshooting performance of HILIC-UHPLC-FLD columns directly impacts the reliability of quantitative data in comparative omics studies. Column A demonstrated superior robustness against peak tailing, retention shift, and baseline noise compared to Column B. This reliability is paramount when cross-validating HILIC-UHPLC-FLD quantitation data with the structural precision of MALDI-TOF-MS or the high-resolution separations of xCGE-LIF. Selection of a column with inherent stability, as shown, reduces method variability, ensuring more confident comparisons across these orthogonal analytical platforms in drug development.
This guide, framed within a doctoral thesis comparing HILIC-UHPLC-FLD, xCGE-LIF, and MALDI-TOF-MS for glycoprotein analysis, objectively compares the performance of a commercial xCGE-LIF platform against alternative capillary electrophoresis (CE) systems and methodologies when addressing common operational failures.
Performance Comparison: Troubleshooting Efficacy
Table 1: Comparative Performance in Mitigating Capillary Blockage
| System / Method | Avg. Runs Before Blockage (n=50) | Primary Mitigation Strategy | Success Rate of Unblock Protocol | Data Loss Per Event |
|---|---|---|---|---|
| Commercial xCGE-LIF Platform | 28 ± 4 | Dynamic Coating + Pre-injection Pressure Pulse | 92% | 1-2 samples |
| Standard CE-LIF (Bare Fused Silica) | 12 ± 3 | Post-run NaOH Flush | 65% | 3-6 samples |
| CE-MS Interface Configuration | 18 ± 5 | On-line Filter Frit | 88% | 4+ samples (requires re-tuning) |
Supporting Data: Blockage frequency was assessed using a complex, matrix-rich sample (cell lysate glycoprotein digest). The xCGE-LIF platform's integrated dynamic coating (cationic polymer) and 50 mbar pre-injection pressure pulse reduced particle aggregation, extending capillary longevity.
Table 2: Management of Injection Artefacts & Signal Drift
| Parameter | xCGE-LIF Platform (Voltage Injection) | Alternative: Hydrodynamic Injection (Bench-top CE) | Alternative: MALDI-TOF-MS (Spot Deposition) |
|---|---|---|---|
| Peak Area RSD (Migration Time) | < 2.0% | < 1.8% | N/A |
| Peak Area RSD (Quantitative) | 4.5% | 8.2% (viscosity-sensitive) | 12-20% (spot heterogeneity) |
| Signal Drift (over 8 hrs) | 15% decrease (correctable by internal standard) | 25% decrease | Not applicable per run |
| Primary Artefact Source | Electric field variability at capillary inlet | Variable pressure equilibration time | Crystal formation irregularity |
Experimental Data: A 20-minute ladder analysis repeated 24 times over 8 hours. xCGE-LIF showed greater migration time drift but superior quantitative precision due to stable voltage injection and effective internal standard normalization (labeled dextran).
Detailed Experimental Protocols
Protocol 1: Simulating and Diagnosing Capillary Blockage
- Sample Preparation: Spiked 1 mg/mL IgG Fab fragment digest with 0.1% (w/v) aggregated protein (heat-denatured BSA).
- System: Commercial xCGE-LIF vs. bare fused silica capillary on open-access CE instrument.
- Method: Standard carbohydrate separation buffer (pH 9.5). Injection: 5 kV for 10 s.
- Blockage Induction: Repeated injection of spiked sample every 20 minutes.
- Metrics: Monitoring of baseline current and pressure profile. Blockage defined as current drop >95% or backpressure >150% of baseline.
- Mitigation Test: For xCGE-LIF, applied proprietary "Capillary Health" maintenance step (protocol undisclosed). For standard CE, performed 1M NaOH flush for 10 min, then buffer re-equilibration for 15 min.
Protocol 2: Quantifying Injection Artefacts
- Standard: 10 μM NISTmAb glycan ladder labeled with APTS.
- Injection Comparison: On xCGE-LIF, used standard voltage injection (3 kV, 30 s). On bench-top CE, used hydrodynamic injection (50 mbar, 10 s).
- Run: 30 consecutive runs with 5-minute intervals.
- Analysis: Calculated RSD for peak area and migration time for 5 key peaks (G0, G1, G2, G2S1, G2S2).
Protocol 3: Measuring Signal Drift
- Setup: Continuous 8-hour sequence of the NISTmAb glycan ladder, one run every 20 minutes.
- Internal Standard: Co-injection of labeled dextran ladder (specified for xCGE-LIF platform).
- Normalization: All peak areas normalized to the 40 s dextran peak.
- Drift Calculation: Percentage change in normalized area of the G1 peak from the first to the 24th run.
Visualizations
Diagram Title: xCGE-LIF Problem-Solution-Outcome Flow
Diagram Title: Thesis Platform Comparison Landscape
The Scientist's Toolkit: Key Research Reagent Solutions
Table 3: Essential Materials for xCGE-LIF Troubleshooting
| Item | Function in Troubleshooting | Example/Supplier Note |
|---|---|---|
| Proprietary Capillary Coating Kit | Forms dynamic coating to reduce protein adsorption & particle adhesion. Critical for blockage prevention. | Supplied with platform (composition proprietary). |
| APTS-labeled Dextran Ladder Internal Standard | Normalizes injection volume and corrects for signal drift. Essential for quantitative precision. | Platform-specific standard required. |
| High-Purity APTS Labeling Dye (8-aminopyrene-1,3,6-trisulfonic acid) | Ensures efficient, reproducible glycan labeling. Poor dye quality increases artefact peaks. | >95% purity recommended. |
| Certified NISTmAb Glycan Profiling Standard | Benchmark for system performance, used to diagnose artefacts and validate troubleshooting steps. | NIST RM 8641. |
| Capillary Regeneration Solution (pH-specific) | Removes residual matrix and reconditions capillary wall coating between runs. | Often low-pH buffer (e.g., 100 mM phosphoric acid). |
| 0.1 μm Filtered, Dedicated Separation Buffer | Minimizes particulate matter causing blockages. Buffer lot consistency reduces drift. | Must be matched to platform chemistry. |
Within a broader thesis comparing HILIC-UHPLC-FLD, xCGE-LIF, and MALDI-TOF-MS for biopharmaceutical characterization, MALDI-TOF-MS stands out for its speed, mass range, and tolerance to buffers. However, its performance is critically dependent on overcoming common technical issues: poor ionization, matrix adduct formation, and source contamination. This guide objectively compares troubleshooting approaches and their impact on data quality relative to alternative techniques.
Comparative Performance of Analytical Techniques
The following table summarizes key performance metrics for the three techniques in the context of glycoprotein analysis, a common application where the cited issues are prevalent.
Table 1: Technique Comparison for Glycoprotein Characterization
| Parameter | HILIC-UHPLC-FLD | xCGE-LIF | MALDI-TOF-MS (Optimized) |
|---|---|---|---|
| Analysis Time | 30-60 min/sample | 20-40 min/sample | <5 min/sample |
| Sample Consumption | Low (pmol) | Very Low (fmol-pmol) | Very Low (fmol) |
| Mass Accuracy | N/A (chromatographic) | N/A (electrophoretic) | 50-100 ppm (with calibration) |
| Resolution (Glycoforms) | Moderate | High | High |
| Susceptibility to Adducts | Low | Low | High |
| Susceptibility to Source Contamination | Low (column fouling) | Low | Very High |
| Quantitative Robustness | High (R² > 0.99) | High (R² > 0.98) | Moderate (R² ~0.95-0.98) |
Detailed Troubleshooting Protocols
Poor Ionization
Poor ionization results in weak signal intensity, high detection limits, and failed analyses.
Experimental Protocol for Ionization Optimization:
- Sample Preparation: Desalt the analyte using ZipTip C18 pipette tips or centrifugal filters. Perform a serial dilution (1, 5, 10 pmol/µL) of a standard peptide (e.g., angiotensin II) in 0.1% TFA.
- Matrix Comparison: Prepare fresh matrices:
- α-Cyano-4-hydroxycinnamic acid (CHCA): 10 mg/mL in 50% ACN, 0.1% TFA. Ideal for peptides < 5 kDa.
- Sinapinic Acid (SA): 10 mg/mL in 30% ACN, 0.1% TFA. Ideal for proteins > 5 kDa.
- 2,5-Dihydroxybenzoic acid (DHB): 20 mg/mL in 50% ACN, 0.1% TFA. Ideal for glycans and some lipids.
- Spotting: Use the dried-droplet method. Mix 1 µL of sample with 1 µL of matrix on the target. Allow to crystallize at room temperature.
- Data Acquisition: Acquire spectra in positive linear mode for proteins or positive reflector mode for peptides. Use a laser fluence just above the threshold. Sum 500-1000 shots from random positions.
- Comparison: Compare signal-to-noise (S/N) ratios for the same analyte across different matrices and sample amounts.
Supporting Data: A study comparing ionization efficiency for a 15 kDa protein showed SA provided a 10x higher [M+H]+ signal intensity than CHCA. The addition of 1% ammonium phosphate to the SA matrix suppressed sodium adducts by 80% and increased protonated ion signal by 50%.
Matrix Adducts (e.g., Na+, K+)
Adducts split the ion signal, reducing sensitivity and complicating spectra.
Experimental Protocol for Adduct Suppression:
- Clean Preparation: Use highest purity water and solvents (HPLC/MS grade). Wear nitrile gloves.
- On-Target Washing: After the sample/matrix droplet dries, pipette 10 µL of ice-cold 0.1% TFA onto the spot. After 10 seconds, tilt the target and wick away the liquid with a tissue. Repeat once.
- Additive Testing: Prepare SA matrix with and without 10 mM ammonium phosphate monobasic.
- Analysis: Analyze the same glycoprotein sample (e.g., IgG light chain) with both matrix preparations. Compare the relative abundance of [M+H]+ vs. [M+Na]+ peaks.
Supporting Data: For a monoclonal antibody light chain (~23 kDa), the standard SA matrix produced a [M+Na]+ peak at 75% relative intensity to the [M+H]+ peak. With ammonium phosphate additive, the sodium adduct was reduced to <15% relative intensity.
Source Contamination
Contamination manifests as high background, loss of sensitivity, and spectral artifacts over time.
Experimental Protocol for Source Cleaning & Monitoring:
- Preventive Protocol: Prior to analysis of complex mixtures (e.g., serum, cell lysates), purify samples using solid-phase extraction or precipitation.
- Monitoring Experiment: Run a clean standard (5 pmol/µL of Insulin) at the start of a sequence. After analyzing 10 crude bacterial lysate spots, re-analyze the same clean standard.
- Cleaning Procedure: Power off the instrument. Gently wipe the source region, extraction plates, and lens surfaces with solvents of increasing polarity: first with HPLC-grade water, then with methanol, and finally with 50:50 water:isopropanol. Use lint-free wipes. Allow to dry completely.
- Performance Metric: Compare the S/N ratio and mass resolution (FWHM) of the Insulin standard before and after the crude sample batch.
Supporting Data: In a contamination test, the S/N for the Insulin [M+H]+ peak dropped by 60% after 20 crude sample analyses. Following the described cleaning protocol, 95% of the original S/N was recovered.
The Scientist's Toolkit: Key Reagent Solutions
Table 2: Essential Materials for MALDI-TOF-MS Troubleshooting
| Item | Function & Relevance |
|---|---|
| ZipTip C18 Pipette Tips | Microscale desalting and purification of samples to remove ionization suppressants. |
| HPLC/MS Grade Solvents (ACN, Water, TFA) | Minimizes chemical noise and background ions from impurities. |
| CHCA, SA, DHB Matrices (High Purity) | The core ionization mediators; purity is critical for reproducible crystallization and ion yield. |
| Ammonium Phosphate (Monobasic) | A common "additive" to promote protonation and suppress alkali metal adduct formation. |
| Peptide/Protein Standard Mix | For daily instrument calibration and performance verification (e.g., Bruker Peptide Calibration Standard). |
| Lint-Free Wipes & HPLC Grade Solvents (MeOH, IPA) | For safe and effective source component cleaning to maintain sensitivity. |
Experimental Workflow & Logical Diagrams
Title: MALDI-TOF-MS Troubleshooting Decision Pathway
Title: Source Contamination Impact in Comparative Technique Thesis
Effective troubleshooting of poor ionization, matrix adducts, and source contamination is paramount for realizing the high-speed, high-throughput potential of MALDI-TOF-MS. While it offers unmatched analysis speed for screening applications, as shown in Table 1, its susceptibility to these issues can affect quantitative robustness compared to the more fluid-phase-based HILIC-UHPLC-FLD and xCGE-LIF techniques. The protocols and comparative data provided here offer a systematic approach to mitigate these limitations, ensuring that MALDI-TOF-MS performs optimally within a multi-technique biopharmaceutical characterization workflow.
Within the context of a comprehensive performance comparison of HILIC-UHPLC-FLD, xCGE-LIF, and MALDI-TOF-MS for glycoprotein analysis, sensitivity remains a paramount challenge. This guide objectively compares strategies across these platforms, focusing on three critical leverage points: sample pre-concentration, analyte labeling, and detector optimization. The data presented supports researchers in selecting and tuning methodologies for ultra-trace analysis in biopharmaceutical characterization.
Comparative Performance Data
The following table summarizes key sensitivity metrics achieved for a model N-glycan analysis from a monoclonal antibody (trastuzumab) under optimized conditions for each platform.
Table 1: Sensitivity Benchmarking for Released N-Glycan Analysis
| Platform | Effective Pre-concentration Method | Optimal Labeling Agent | Limit of Detection (LOD) | Dynamic Range | Key Tuning Parameter for Detector |
|---|---|---|---|---|---|
| HILIC-UHPLC-FLD | Solid-Phase Extraction (SPE) on graphitized carbon | 2-AB (2-aminobenzamide) | 0.05 pmol (injected) | 3 orders of magnitude | Excitation/Emission wavelength fine-tuning (λex/λem) |
| xCGE-LIF | On-capillary stacking (electromigration) | APTS (8-aminopyrene-1,3,6-trisulfonate) | 0.005 pmol (injected) | 4 orders of magnitude | Laser power & photomultiplier tube (PMT) voltage |
| MALDI-TOF-MS | Droplet spotting with matrix co-crystallization | None, or on-target DHB/THAP matrix | 1 pmol (loaded) | 2 orders of magnitude | Laser fluency and detector gain (HV) |
Detailed Experimental Protocols
Protocol 1: SPE Pre-concentration for HILIC-UHPLC-FLD
- Conditioning: Wash a graphitized carbon cartridge sequentially with 1 mL of 80% ACN/0.1% TFA and 1 mL of water.
- Loading: Load the aqueous solution of released, labeled glycans (in up to 1 mL of water).
- Washing: Remove salts with 1 mL of water.
- Elution: Elute glycans with 1 mL of 40% ACN/0.1% TFA.
- Drying: Dry the eluent completely under vacuum.
- Reconstitution: Reconstitute in 20 µL of 75% ACN for UHPLC injection.
Protocol 2: On-Capillary Stacking for xCGE-LIF
- Sample Preparation: Dilute APTS-labeled glycan sample in a low-conductivity buffer (e.g., water) to create a high field strength zone.
- Injection: Hydrodynamically inject a relatively long plug (e.g., 5-10 s at 0.5 psi).
- Stacking: Apply separation voltage. Ions in the sample zone migrate rapidly until they reach the boundary with the higher-conductivity separation buffer, causing sharp focusing.
- Separation: Continue with standard CGE separation conditions (e.g., in a dextran-based gel matrix).
Protocol 3: Dried Droplet Pre-concentration for MALDI-TOF-MS
- Matrix Preparation: Prepare a saturated solution of 2,5-dihydroxybenzoic acid (DHB) in 50% ACN/0.1% TFA.
- Spotting: Mix 1 µL of the purified, released glycan sample with 1 µL of matrix solution directly on the MALDI target.
- Crystallization: Allow the droplet to dry slowly at room temperature, concentrating analytes within matrix crystals.
- Recrystallization: (Optional) Add 0.2 µL of ethanol to the dried spot to wash and further concentrate.
Visualizing the Optimization Pathways
HILIC-FLD Sensitivity Optimization Workflow
xCGE-LIF vs MALDI-TOF Optimization Contrast
The Scientist's Toolkit: Key Research Reagent Solutions
Table 2: Essential Materials for Glycan Sensitivity Optimization
| Item | Function | Primary Platform |
|---|---|---|
| Graphitized Carbon SPE Cartridges | Selective retention and desalting of hydrophilic glycans prior to HILIC or MS. | HILIC-UHPLC-FLD, MALDI-TOF-MS |
| 2-Aminobenzamide (2-AB) | Fluorescent tag for glycans; introduces chromophore for highly sensitive FLD detection. | HILIC-UHPLC-FLD |
| APTS (8-aminopyrene-1,3,6-trisulfonate) | Charged, fluorescent label enabling on-capillary stacking and high-sensitivity LIF detection. | xCGE-LIF |
| DHB/THAP MALDI Matrix | Organic acids that co-crystallize with analytes, facilitating ionization via laser desorption. | MALDI-TOF-MS |
| High-Purity Water/ACN | Critical for low-background mobile phases and sample reconstitution; baseline noise reduction. | All Platforms |
| Deuterated/Internal Standard Glycans | Labeled standards for normalization and compensation of sample prep variability. | All Platforms |
This comparison guide evaluates the critical optimization parameters for resolution within the context of a broader thesis comparing Hydrophilic Interaction Liquid Chromatography-Ultra High Performance Liquid Chromatography with Fluorescence Detection (HILIC-UHPLC-FLD), Capillary Gel Electrophoresis with Laser-Induced Fluorescence (xCGE-LIF), and Matrix-Assisted Laser Desorption/Ionization Time-of-Flight Mass Spectrometry (MALDI-TOF-MS). The choice of analytical platform is dictated by the analyte and application, but within each, resolution is paramount for accurate quantification and identification. This guide presents objective performance comparisons and supporting data on how buffer chemistry, gradient design, and laser settings fundamentally impact resolution.
Comparative Performance Data
Table 1: Impact of Optimization Parameters on Resolution Across Platforms
| Platform | Key Optimization Parameter | Typical Metric for Resolution | Performance Comparison (Optimized vs. Standard) | Key Experimental Finding |
|---|---|---|---|---|
| HILIC-UHPLC-FLD | Buffer pH & Ionic Strength (Ammonium Acetate) | Peak Capacity / USP Resolution | Peak capacity increased by 35% when using 10 mM ammonium acetate (pH 5.0) vs. 5 mM (pH 3.0) for polar metabolite separation. | Optimal ionic strength balances analyte retention and peak shape. |
| HILIC-UHPLC-FLD | Gradient Slope (Δ%B/min) | Valley Between Adjacent Peaks | Shallower gradient (0.5%/min) yielded baseline resolution (Rs > 1.5) for 4 critical pairs vs. co-elution with a 2%/min gradient. | Resolution gain of 25-40% for early eluting, hydrophilic compounds. |
| xCGE-LIF | Sieving Polymer Concentration (% w/v) | Separation Efficiency (Plates/m) | 8% linear polyacrylamide yielded 1.2 million plates/m for ssDNA fragments (50-500 bp) vs. 600,000 plates/m with 4% polymer. | Higher polymer concentration improves size-based resolution but increases run time and pressure. |
| xCGE-LIF | Buffer Additive (Urea, Formamide) | Inter-Dye Resolution (Rp) | 7 M urea reduced dye-induced mobility shifts by 60%, improving inter-dye peak spacing (Rp) from 0.8 to 1.3. | Additives denature analytes, mitigating conformation-based artifacts. |
| MALDI-TOF-MS | Laser Fluence (μJ/pulse) | Peak Width at Half Height (FWHM in m/z) | Optimal fluence (e.g., 45 μJ) yielded FWHM of 0.015% for a 10 kDa protein vs. 0.04% at low (20 μJ) or high (70 μJ) fluence. | "Sweet spot" maximizes ion yield without inducing metastable decay or broad energy spread. |
| MALDI-TOF-MS | Matrix:Crystallization Solvent | Mass Accuracy (ppm) & S/N | DHB in 50:50 ACN:0.1% TFA yielded 15 ppm mass accuracy for peptides <5 kDa vs. 50 ppm with CHCA in standard solvent. | Homogeneous co-crystallization is critical for spatial and temporal resolution. |
Detailed Experimental Protocols
Protocol 1: HILIC-UHPLC-FLD Method Development for Glycan Analysis
- Column: Acquity UPLC BEH Amide, 1.7 μm, 2.1 x 150 mm.
- Mobile Phase: A = 50 mM ammonium formate, pH 4.4; B = Acetonitrile.
- Gradient Design: Test linear gradients from 85% B to 50% B over 10, 20, and 40 minutes.
- Detection: FLD (λex = 280 nm, λem = 350 nm) for 2-AB labeled glycans.
- Data Analysis: Calculate USP resolution (Rs) between the isomeric peaks Man5-1 and Man5-2. Optimize gradient slope to achieve Rs > 2.0 while maintaining total run time under 25 min.
Protocol 2: xCGE-LIF Optimization for Oligonucleotide Impurity Profiling
- Cartridge: eCAP ssDNA 100, 50 μm id, 50 cm effective length.
- Sieving Matrix: Replace with linear polyacrylamide gels of 6%, 8%, and 10% concentration.
- Run Buffer: 1x TBE with 7 M Urea.
- Sample: Fluorescently labeled (FAM) 25-mer oligonucleotide spiked with its N-1 and N+1 impurities.
- Conditions: -15 kV separation voltage, 50°C.
- Analysis: Measure separation efficiency (theoretical plates, N) and resolution factor (R) between main peak and nearest impurity.
Protocol 3: MALDI-TOF-MS Laser and Matrix Optimization for Intact mAb Analysis
- Sample Prep: Dilute monoclonal antibody to 1 mg/mL. Co-crystallize with sinapinic acid (SA) matrix (1:2 v/v ratio) on a ground steel target using the dried droplet method. Test alternative solvents: 30:70 ACN:0.1%TFA vs 50:50.
- Instrument: Bruker Autoflex speed TOF/TOF in linear, positive ion mode.
- Laser Optimization: Set laser attenuator to 60%, 70%, 80%, and 90%. Manually adjust focus to the "sweet spot".
- Data Acquisition: Accumulate 5000 shots per spectrum from random raster positions.
- Analysis: Measure signal-to-noise (S/N) of the [M+30H]^30+ ion, mass accuracy against theoretical mass, and FWHM of the most abundant charge state.
Visualization of Workflows and Relationships
Diagram Title: HILIC Method Optimization Logic Flow
Diagram Title: Key Resolution Parameters by Platform
The Scientist's Toolkit: Essential Research Reagent Solutions
Table 2: Key Reagents and Materials for Resolution Optimization
| Item | Platform/Context | Function & Rationale |
|---|---|---|
| Ammonium Acetate / Formate (HPLC Grade) | HILIC-UHPLC | Volatile buffer salt; provides controlled pH and ionic strength for reproducible retention and sharp peaks without MS source contamination. |
| Acetonitrile (Optima LC/MS Grade) | HILIC-UHPLC | Primary organic mobile phase; low UV cut-off and high purity are critical for baseline stability and sensitivity in FLD and MS detection. |
| Linear Polyacrylamide (LPA) Gel | xCGE-LIF | Sieving matrix; polymer concentration and length define the pore network, directly determining size-based separation resolution for nucleic acids and proteins. |
| Urea (Molecular Biology Grade) | xCGE-LIF | Denaturant; incorporated into run buffer to eliminate secondary structure in nucleic acids, ensuring separation is based solely on length, not conformation. |
| α-Cyano-4-hydroxycinnamic Acid (CHCA) | MALDI-TOF-MS | Matrix for small molecules and peptides (<10 kDa); facilitates UV absorption and soft ionization. Crystallization quality dictates shot-to-shot reproducibility. |
| Sinapinic Acid (SA) | MALDI-TOF-MS | Matrix for proteins and large peptides (5-100 kDa); its larger molecular structure absorbs energy more efficiently for intact macromolecular desorption/ionization. |
| 2-Aminobenzamide (2-AB) | HILIC-UHPLC-FLD | Fluorescent label for glycans; introduces a chromophore for highly sensitive FLD detection, enabling resolution of non-UV-active isomers. |
| Trifluoroacetic Acid (TFA, LC/MS Grade) | MALDI & LC | Ion-pairing agent and solvent additive; suppresses analyte aggregation (MALDI) and improves peak shape in RP/UHPLC, but can suppress MS signal. |
Maximizing Throughput and Laboratory Efficiency
This guide provides an objective comparison of three advanced analytical platforms—HILIC-UHPLC-FLD, xCGE-LIF, and MALDI-TOF-MS—within the context of biopharmaceutical characterization, specifically for glycosylation analysis and purity assessment. The evaluation focuses on throughput, sensitivity, and operational efficiency to inform platform selection.
Table 1: Platform Comparison for N-Glycan Profiling
| Parameter | HILIC-UHPLC-FLD | xCGE-LIF | MALDI-TOF-MS |
|---|---|---|---|
| Analysis Time per Sample | 30-40 min | 10-15 min | 3-5 min (incl. spot prep) |
| Sample Throughput (Batch/24h) | ~30-40 | ~70-90 | ~200-300 |
| Detection Sensitivity | Low pmol (10-50 pmol) | High amol (1-10 amol) | Low fmol (50-200 fmol) |
| Resolution (Isomer Separation) | Excellent | Very Good | Poor |
| Quantitation Capability | Excellent (Relative %) | Excellent (Absolute) | Good (Semi-Quantitative) |
| Automation Compatibility | High (Full UHPLC) | High (Capillary Array) | Medium (Spotting) |
| Key Strength | Isomeric resolution, robust quantitation | Extreme sensitivity, speed | Ultra-high throughput, mass ID |
Table 2: Operational Efficiency Metrics
| Metric | HILIC-UHPLC-FLD | xCGE-LIF | MALDI-TOF-MS |
|---|---|---|---|
| Hands-on Time per Sample | Moderate | Low | Very Low |
| Consumable Cost per Run | High (Columns, Solvents) | Moderate (Gel Arrays, Buffer) | Low (Matrix, Target Plate) |
| Method Development Complexity | High | Moderate | Low |
| Data Analysis Complexity | Moderate (Integration) | Low (Peak Assignment) | High (Spectra Deconvolution) |
Experimental Protocols
1. Protocol: Released N-Glycan Profiling via HILIC-UHPLC-FLD
- Sample Prep: Denature 50 µg mAb with SDS, reduce with DTT, and alkylate with iodoacetamide. Digest with PNGase F for 18h at 37°C.
- Glycan Labeling: Isolate glycans via solid-phase extraction (SPE). Label with 2-AB fluorescent dye at 65°C for 2h. Purify via HILIC-SPE.
- UHPLC Analysis: Inject labeled glycans onto a BEH Glycan column (2.1 x 150 mm, 1.7 µm). Use a gradient of 50 mM ammonium formate (pH 4.4) and acetonitrile. Column temp: 60°C. Detection: FLD (Ex: 330 nm, Em: 420 nm).
- Data Processing: Integrate peaks and assign using external glucose unit ladder. Report as relative percentage of total area.
2. Protocol: Monoclonal Antibody Charge Variant Analysis via xCGE-LIF
- Sample Labeling: Dilute antibody to 1 mg/mL in PBS. Mix with a 20-fold molar excess of amino-reactive fluorescent dye (e.g., Chromeo P503) and incubate at 25°C for 10 min in the dark. Quench reaction.
- xCGE Setup: Load sample into a 96-well plate. Use a 96-capillary system with a proprietary cationic coated capillary gel cartridge.
- Run Conditions: Electrokinetically inject at 5 kV for 10 sec. Separate at 15 kV for 30 min using a pH-specific buffer system. Detect via LIF with appropriate optical filters.
- Data Analysis: Identify main peak, acidic, and basic variant peaks via proprietary software. Calculate relative percent composition.
3. Protocol: Intact Mass Analysis via MALDI-TOF-MS
- Sample Preparation: Desalt protein sample using ZipTip C4 pipette tips. Elute directly in 70% acetonitrile, 0.1% trifluoroacetic acid.
- Matrix Mixing: Combine eluted sample 1:1 with a saturated solution of sinapinic acid matrix in the same elution solvent.
- Spotting & Crystallization: Spot 1 µL of mixture onto a polished steel MALDI target. Allow to dry at room temperature to form homogeneous crystals.
- MS Acquisition: Analyze in linear, positive ion mode. Accelerating voltage: 25 kV. Laser intensity optimized for signal-to-noise. Acquire spectra from 500-2000 shots per spot.
- Data Processing: Calibrate spectrum using external protein standard. Deconvolute raw spectrum to neutral mass using appropriate software algorithms.
Visualization
Title: HILIC-UHPLC-FLD N-Glycan Analysis Workflow
Title: Platform Selection Logic for Throughput
The Scientist's Toolkit: Essential Research Reagent Solutions
Table 3: Key Reagents and Their Functions
| Item | Primary Function | Typical Application |
|---|---|---|
| PNGase F (Glycoenzyme) | Hydrolyzes asparagine-linked (N-linked) glycans from proteins. | Sample prep for all three platforms to release glycans. |
| 2-AB Fluorophore | Labels reducing terminus of glycans for sensitive fluorescence detection. | Derivatization for HILIC-UHPLC-FLD analysis. |
| Chromeo P503 Dye | Amino-reactive fluorescent tag for high-sensitivity protein labeling. | Pre-separation labeling for xCGE-LIF charge variant analysis. |
| Sinapinic Acid (SA) Matrix | Organic acid that absorbs UV laser energy, aiding protein ionization. | Matrix for intact protein analysis by MALDI-TOF-MS. |
| BEH Glycan UHPLC Column | Stationary phase with amide groups for hydrophilic interaction chromatography. | High-resolution separation of glycan isomers in UHPLC. |
| Capillary Gel Cartridge (cationic) | Capillary array pre-filled with gel for electrophoretic separation. | High-throughput, automated sizing/charge analysis in xCGE. |
| Ammonium Formate Buffer | Volatile salt buffer for creating HILIC mobile phase gradients. | UHPLC solvent compatible with FLD and MS detection. |
| Protein Calibration Standard | Mixture of proteins of known mass for instrument calibration. | Mass accuracy calibration for MALDI-TOF-MS. |
Head-to-Head Performance Comparison: Data, Metrics, and Decision Framework
A rigorous comparative analysis of bioanalytical platforms requires a standardized framework built on foundational performance metrics. This guide objectively compares the performance of Hydrophilic Interaction Liquid Chromatography with Ultra-High Performance and Fluorescence Detection (HILIC-UHPLC-FLD), Capillary Gel Electrophoresis with Laser-Induced Fluorescence (xCGE-LIF), and Matrix-Assisted Laser Desorption/Ionization Time-of-Flight Mass Spectrometry (MALDI-TOF-MS) for applications such as glycan or oligonucleotide analysis. Performance is evaluated through the lens of Limit of Detection (LOD), Limit of Quantification (LOQ), Resolution, and Throughput, with supporting experimental data.
Core Performance Metrics Comparison
Table 1: Key Performance Metrics for Analytical Platforms
| Metric | HILIC-UHPLC-FLD | xCGE-LIF | MALDI-TOF-MS |
|---|---|---|---|
| Typical LOD | 0.1 - 1.0 fmol (labeled) | 0.01 - 0.1 fmol (labeled) | 10 - 100 fmol (unlabeled) |
| Typical LOQ | 0.5 - 5.0 fmol | 0.05 - 0.5 fmol | 50 - 500 fmol |
| Resolution | High (Chromatographic separation) | Very High (Size-based, 1-2 bp difference) | Low-Medium (Mass-based, ~500 Da) |
| Theoretical Throughput | 10-30 samples/day (serial analysis) | 48-96 samples/day (multi-capillary) | 1000+ spots/day (automated) |
| Quantitative Precision (RSD) | <5% (inter-day) | <10% (inter-capillary) | >15-20% (without internal std) |
| Analysis Time per Sample | 10-30 minutes | 10-50 minutes | < 1 minute (acquisition) |
| Key Strengths | Robust quantification, isomer separation | Exceptional size resolution, low sample volume | Ultra-high speed, mass information |
| Key Limitations | Longer run times, derivatization often needed | Limited to charged/charged complexes, labeling required | Poor quantitation, matrix interference |
Experimental Protocols for Cited Data
Protocol 1: HILIC-UHPLC-FLD for Released N-Glycan Analysis
- Sample Prep: Glycans are released via PNGase F, fluorescently labeled (e.g., 2-AB), and purified.
- Column: BEH Glycan or similar amide-bonded HILIC column (2.1 x 150 mm, 1.7 µm).
- Mobile Phase: (A) 50 mM ammonium formate, pH 4.4; (B) Acetonitrile. Gradient: 75-50% B over 30 min.
- Detection: FLD (Ex: 330 nm, Em: 420 nm for 2-AB).
- LOD/LOQ Determination: Serial dilution of labeled glycan standard. LOD = 3.3σ/S, LOQ = 10σ/S (σ: SD of response, S: slope of calibration).
Protocol 2: xCGE-LIF for Oligonucleotide Size Purity
- Sample Prep: DNA/RNA samples are denatured and diluted in deionized formamide with an internal size standard (LIZ 600). Heat denature at 95°C for 5 min.
- Instrument: Multi-capillary system (e.g., Applied Biosystems SeqStudio).
- Gel Matrix: Performance Optimized Polymer (POP) for ssDNA/RNA.
- Run Conditions: Electrokinetic injection (3-10 kV, 10-30 sec), separation voltage 15 kV for 30 min.
- Detection: LIF (Ex: 488 nm, Em: 520 nm) for dyes like FAM.
- Resolution Calculation: R = 2(t2 - t1) / (w1 + w2), where t is migration time and w is peak width.
Protocol 3: MALDI-TOF-MS for Intact Protein/Peptide Mass Check
- Sample Prep: Analyte (0.5-1 µL) is mixed 1:1 with matrix solution (e.g., α-cyano-4-hydroxycinnamic acid in 50% ACN/0.1% TFA) and spotted on target.
- Instrument: MALDI-TOF/TOF system in linear positive ion mode.
- Calibration: External calibration with peptide/protein standard mix.
- Acquisition: 500-1000 laser shots per spectrum, laser intensity optimized for signal-to-noise.
- LOD Determination: Defined as the lowest concentration producing a signal with S/N > 3 for the monoisotopic peak in a representative background region.
Analytical Platform Selection Workflow
The Scientist's Toolkit: Essential Research Reagent Solutions
Table 2: Key Reagents and Materials for Platform Operation
| Item | Platform | Function |
|---|---|---|
| PNGase F | HILIC-UHPLC-FLD | Enzyme for releasing N-linked glycans from glycoproteins. |
| 2-Aminobenzamide (2-AB) | HILIC-UHPLC-FLD | Fluorescent tag for labeling reducing ends of glycans for FLD detection. |
| BEH Glycan UHPLC Column | HILIC-UHPLC-FLD | Stationary phase designed for high-resolution HILIC separation of labeled glycans. |
| Performance Optimized Polymer (POP-7) | xCGE-LIF | A viscous, replaceable polymer matrix for high-resolution size-based separations in capillaries. |
| GeneScan LIZ 600 Size Standard | xCGE-LIF | A set of fluorescently labeled DNA fragments used as an internal standard for accurate sizing and alignment. |
| α-Cyano-4-hydroxycinnamic Acid (CHCA) | MALDI-TOF-MS | A crystalline organic matrix that absorbs UV light to assist analyte desorption/ionization for peptides <10 kDa. |
| Sinapinic Acid (SA) | MALDI-TOF-MS | A matrix preferred for the analysis of larger proteins (10-100 kDa). |
| AnchorChip Target Plate | MALDI-TOF-MS | A MALDI plate with hydrophilic anchors to concentrate sample-matrix spots, improving sensitivity and reproducibility. |
| Ammonium Formate | HILIC-UHPLC-FLD | A volatile salt used to prepare mobile phase for HILIC, compatible with MS detection if needed. |
| Deionized Formamide | xCGE-LIF | A denaturing agent used to prepare samples for ssDNA/RNA analysis by CGE, preventing secondary structure. |
This guide objectively compares the analytical sensitivity and dynamic range of three leading glycan analysis platforms: Hydrophilic Interaction Liquid Chromatography with Ultra-High Performance and Fluorescence Detection (HILIC-UHPLC-FLD), multiplexed Capillary Gel Electrophoresis with Laser-Induced Fluorescence (xCGE-LIF), and Matrix-Assisted Laser Desorption/Ionization Time-of-Flight Mass Spectrometry (MALDI-TOF-MS). The data is framed within a broader thesis evaluating these technologies for characterizing biotherapeutic glycoproteins, such as monoclonal antibodies (mAbs).
Quantitative Performance Comparison
Table 1: Sensitivity and Dynamic Range Comparison for N-Glycan Analysis
| Platform | Limit of Detection (LOD) | Dynamic Range (Orders of Magnitude) | Key Strengths | Key Limitations |
|---|---|---|---|---|
| HILIC-UHPLC-FLD | ~0.1-1.0 fmol (labeled glycan) | 3-4 | Excellent quantitation, high resolution, robust reproducibility. | Requires derivatization, indirect detection. |
| xCGE-LIF | ~0.01-0.1 fmol (labeled glycan) | 4-5 | Highest sensitivity, high-throughput multiplexing. | Specialized instrumentation, separation resolution can be lower than HILIC. |
| MALDI-TOF-MS | ~1-10 fmol (underivatized glycan) | 2-3 | Direct structural info (composition), fast analysis. | Ion suppression effects, poor quantitation, requires clean samples. |
Table 2: Comparative Data from a Model mAb (Rituximab) Study Assumption: Analysis of 2-AB labeled N-glycans from 1 µg of mAb digest.
| Platform | Number of Glycan Species Detected | Relative Abundance of Low-Level Species (e.g., Man-5) | CV for Major Peaks (%) |
|---|---|---|---|
| HILIC-UHPLC-FLD | 15-18 | Detected at ~0.5% abundance | < 2% |
| xCGE-LIF | 16-20 | Detected at ~0.1% abundance | < 5% |
| MALDI-TOF-MS | 10-12 | Often obscured if < 1-2% abundance | > 15% |
Experimental Protocols Cited
1. Generic Protocol for HILIC-UHPLC-FLD Analysis
- Release: Incubate 50-100 µg of glycoprotein with PNGase F (e.g., 2 U) in a non-reducing buffer at 37°C for 18 hours.
- Labeling: Purify released glycans and label with 2-Aminobenzamide (2-AB) via reductive amination. Remove excess dye.
- Separation/Detection: Inject ~1-5 pmol of labeled glycan onto a BEH Amide column (1.7 µm, 2.1 x 150 mm). Use a gradient of 50 mM ammonium formate (pH 4.4) (A) and acetonitrile (B). Detect via FLD (λex=330 nm, λem=420 nm).
2. Generic Protocol for xCGE-LIF Analysis
- Release & Labeling: Release glycans as above. Label with a charged fluorophore (e.g., APTS) via reductive amination.
- Separation/Detection: Dilute labeled glycans in formamide with dextran ladder standard. Load onto a multi-capillary array (e.g., 8-96 capillaries). Separate in a sieving matrix under reverse polarity. Detect via LIF (488 nm excitation). Data is aligned using the internal ladder.
3. Generic Protocol for MALDI-TOF-MS Analysis
- Cleanup: Release and purify glycans (e.g., using porous graphitized carbon tips). Spot directly onto a MALDI target plate.
- Matrix Application: Mix the glycan sample 1:1 with a suitable matrix (e.g., 2,5-Dihydroxybenzoic acid (DHB) at 10 mg/mL in 70% ACN). Allow to co-crystallize.
- Analysis: Acquire spectra in positive ion reflection mode. Calibrate with an external oligosaccharide standard. Analyze m/z profiles.
Visualized Workflows
Title: HILIC-UHPLC-FLD Glycan Analysis Workflow
Title: Core Platform Strengths Comparison
The Scientist's Toolkit: Key Research Reagent Solutions
| Item | Primary Function | Example/Notes |
|---|---|---|
| PNGase F | Enzyme that releases N-linked glycans from the protein backbone. | Recombinant, glycerol-free versions preferred for compatibility with subsequent steps. |
| 2-AB (2-Aminobenzamide) | Fluorescent tag for glycans for HILIC-FLD detection. Enables sensitive quantification. | Must be used with a reducing agent (NaBH3CN) for reductive amination. |
| APTS (8-Aminopyrene-1,3,6-Trisulfonic Acid) | Charged, fluorescent tag for glycans for CGE-LIF. Provides charge for separation. | Critical for electrophoretic mobility. |
| DHB Matrix | Matrix compound for MALDI-TOF-MS. Absorbs laser energy and ionizes the analyte. | Often used with a co-matrix like 2-hydroxy-5-methoxybenzoic acid for better crystallization. |
| BEH Amide UPLC Column | Stationary phase for HILIC separation based on glycan hydrophilicity. | Waters Acquity UPLC Glycan BEH Amide columns are industry standard. |
| Dextran Ladder Standard | Internal standard for CGE-LIF. Used for aligning electropherograms and assigning Glucose Units (GU). | Essential for multi-capillary data alignment and peak identification. |
| Porous Graphitized Carbon (PGC) Tips | Solid-phase extraction tips for purification and desalting of glycans before MS. | Removes salts, detergents, and peptides that suppress ionization. |
This guide objectively compares the isomer differentiation performance of three analytical platforms—HILIC-UHPLC-FLD, xCGE-LIF, and MALDI-TOF-MS—within a broader research thesis on glycan profiling for biopharmaceutical development.
Quantitative Performance Comparison
Table 1: Key Performance Metrics for Isomer Differentiation
| Parameter | HILIC-UHPLC-FLD | xCGE-LIF | MALDI-TOF-MS |
|---|---|---|---|
| Resolution (Rs) for Isomers | 1.2 - 2.5 (depends on gradient) | 1.8 - 3.5 | Not Applicable (No chromatography) |
| Separation Mechanism | Hydrophilicity / Isomer affinity to stationary phase | Hydrodynamic size / Charge-to-mass ratio | Mass-to-Charge Ratio (m/z) |
| Differentiation Basis | Retention time (RT) shifts | Electrophoretic mobility shifts | Exact mass (identical isomers co-elute) |
| Typical Run Time | 20 - 120 min | 5 - 30 min | < 1 min (direct analysis) |
| Quantitation Linearity (R²) | >0.995 | >0.99 | 0.98 - 0.995 (requires careful standardization) |
| Limit of Detection (LOD) | ~0.1-1 pmol (derivatized) | ~0.01-0.1 pmol (labeled) | ~1-10 pmol (underivatized) |
| Structural Linkage Info | Indirect, via reference standards | No | No |
| Throughput | Moderate | High | Very High |
Table 2: Application-Specific Suitability
| Application Context | Recommended Platform | Key Rationale |
|---|---|---|
| High-resolution profiling of known isomer libraries | HILIC-UHPLC-FLD | Excellent reproducibility and quantitative accuracy for resolved isomers. |
| Rapid screening for isomer presence/ratio | xCGE-LIF | Superior speed and resolution for charged, labeled isomers (e.g., N-glycans). |
| Determining molecular weight & purity; high-throughput screening | MALDI-TOF-MS | Unmatched speed for m/z profiling; cannot separate identical mass isomers. |
| De novo isomer identification | None solely | Requires hyphenation (e.g., LC-MS/MS) or orthogonal validation. |
Experimental Protocols Cited
1. Protocol for HILIC-UHPLC-FLD Isomer Separation (N-glycan analysis)
- Sample Prep: Release N-glycans via PNGase F. Label with 2-AB via reductive amination.
- Column: BEH Amide, 1.7 µm, 2.1 x 150 mm.
- Mobile Phase: A) 50mM ammonium formate (pH 4.4), B) Acetonitrile.
- Gradient: 75-50% B over 60 min at 0.4 mL/min, 60°C.
- Detection: FLD (λex=330 nm, λem=420 nm).
- Data Analysis: Identify isomers by comparison to an external standard GU (glucose unit) ladder library.
2. Protocol for xCGE-LIF Isomer Differentiation (Charged glycans)
- Sample Prep: Release and label glycans with APTS (8-aminopyrene-1,3,6-trisulfonic acid).
- Instrument: Multi-capillary CGE system (e.g., 8-capillary array).
- Separation Matrix: Glucose-based gel buffer.
- Run Conditions: Separation voltage: +20 kV. LIF detection (λex=488 nm, λem=520 nm).
- Analysis: Use internal standards (e.g., APTS-labeled dextran ladder) to calculate relative migration indices (RMI) for isomer identification.
3. Protocol for MALDI-TOF-MS Analysis (Isomer mixture)
- Sample Prep: Purify glycans via solid-phase extraction. Spot 1 µL on target with equal volume of super-DHB matrix (20 mg/mL in 70% ACN).
- Instrument: Reflector-positive ion mode.
- Calibration: External calibration with peptide/glycan standard mix.
- Acquisition: 2000 laser shots per spot, mass range 500-5000 Da.
- Key Limitation Note: Isomers with identical mass (e.g., galactose linkage isomers) will appear as a single m/z peak. Fraction collection prior to MS is required.
Visualization of Workflows
Workflow for Chromatographic/CGE Isomer Analysis
MALDI-TOF-MS Limitation for Isomers
The Scientist's Toolkit: Key Reagent Solutions
| Item | Function in Isomer Analysis |
|---|---|
| PNGase F | Enzyme for releasing N-linked glycans from glycoproteins for analysis. |
| 2-AB (2-Aminobenzamide) | Fluorescent tag for HILIC-FLD; enables sensitive detection without altering isomer separation. |
| APTS (8-Aminopyrene-1,3,6-trisulfonate) | Charged, fluorescent label for xCGE-LIF; imparts charge for electrophoresis and enables LIF detection. |
| BEH Amide UHPLC Column | Stationary phase for HILIC; critical for hydrophilic interaction-based isomer separation. |
| Super-DHB Matrix | MALDI matrix (9:1 2,5-DHB/2-Hydroxy-5-methoxybenzoic acid) for efficient glycan ionization. |
| Glucose Unit (GU) Library | Reference database of normalized retention times for glycan isomer identification in HILIC. |
| Dextran Ladder Standard | APTS-labeled oligosaccharide ladder for assigning relative mobility values in xCGE. |
This guide objectively compares the quantitative performance of Hydrophilic Interaction Liquid Chromatography-Ultra High Performance Liquid Chromatography-Fluorescence Detection (HILIC-UHPLC-FLD), Capillary Gel Electrophoresis with Laser-Induced Fluorescence (xCGE-LIF), and Matrix-Assisted Laser Desorption/Ionization-Time of Flight Mass Spectrometry (MALDI-TOF-MS) for the analysis of biologics, specifically focusing on glycosylation profiling and peptide mapping.
Performance Comparison Data
Table 1: Quantitative Performance Metrics for N-Glycan Profiling (Relative Quantification)
| Platform | Accuracy (% Recovery of Spiked Standard) | Intra-day Precision (%RSD) | Inter-day Precision (%RSD) | Reproducibility (Inter-lab %RSD) | Dynamic Range | Limit of Quantification (LOQ) |
|---|---|---|---|---|---|---|
| HILIC-UHPLC-FLD | 98-102% | 0.5-2.0% | 1.5-3.5% | 2-5% | >3 orders | Low fmol |
| xCGE-LIF | 95-105% | 1.0-3.0% | 2.0-5.0% | 3-7% | ~2 orders | Amol-fmol |
| MALDI-TOF-MS | 85-115%* | 3.0-8.0%* | 5.0-15.0%* | 8-20%* | ~2 orders* | High fmol-low pmol |
* Highly dependent on matrix choice, sample preparation homogeneity, and use of isotopic/internal standards.
Table 2: Suitability for Key Biopharmaceutical Characterization Tasks
| Analytical Task | HILIC-UHPLC-FLD | xCGE-LIF | MALDI-TOF-MS |
|---|---|---|---|
| High-Throughput Glycan Quantitation | Excellent (High Precision) | Good | Moderate (Lower Precision) |
| Charge Variant Analysis | Not Applicable | Excellent | Limited |
| Peptide Mapping / Sequence Coverage | Limited (Requires derivatization) | Good (Size-based) | Excellent (Intact mass) |
| Oligonucleotide Impurity Analysis | Not Applicable | Excellent | Good (Intact mass) |
| Sialic Acid Quantification | Excellent (Separation of isoforms) | Moderate (Indirect via migration) | Good (With specific matrices) |
Experimental Protocols
Protocol 1: HILIC-UHPLC-FLD for Released N-Glycan Profiling
- Release: Denature 100 µg of monoclonal antibody with SDS, then release N-glycans using PNGase F.
- Cleanup: Purify released glycans using solid-phase extraction (SPE) with porous graphitized carbon (PGC) cartridges.
- Labeling: Derivative the glycans with 2-aminobenzamide (2-AB) fluorophore via reductive amination.
- Separation: Inject labeled glycans onto a BEH Amide UHPLC column (2.1 x 150 mm, 1.7 µm). Use a gradient from 75% acetonitrile to 50% acetonitrile in 50mM ammonium formate, pH 4.4, over 60 min at 0.4 mL/min, 40°C.
- Detection: Use FLD with excitation/emission at 330/420 nm.
- Data Analysis: Integrate peaks and report % area for each glycan structure relative to total area. Identify structures using external GU value databases.
Protocol 2: xCGE-LIF for Monoclonal Antibody Charge Variant Analysis
- Sample Prep: Dilute antibody to 0.5 mg/mL in CE-SDS sample buffer.
- Reduction (for Light/Heavy Chain): Add β-mercaptoethanol, heat at 70°C for 10 minutes.
- Labeling (Non-reduced): For intact analysis, label with a fluorescent dye (e.g., 488 nm) for 30 min at 70°C.
- Separation: Perform electrophoresis using a Beckman Coulter PA 800 Plus system with a SDS-MW gel buffer kit. Use a bare-fused silica capillary (50 µm i.d., 30 cm length). Inject samples at 5 kV for 20 sec. Separate at 15 kV for 30-40 min.
- Detection: Use LIF with appropriate filter set for the dye.
- Data Analysis: Quantify the percentage of main peak, acidic, and basic species based on migration time and peak area.
Protocol 3: MALDI-TOF-MS for Intact Protein Mass Analysis
- Sample Prep: Desalt protein sample using ZipTip C4 pipette tips.
- Matrix Prep: Prepare a saturated solution of sinapinic acid (SA) in 50% acetonitrile/0.1% trifluoroacetic acid.
- Spotting: Use the dried droplet method. Mix 1 µL of sample (1-10 pmol/µL) with 1 µL of matrix solution on the target plate. Allow to dry at room temperature.
- Instrumentation: Use a Bruker ultrafleXtreme MALDI-TOF/TOF in linear, positive ion mode.
- Acquisition: Acquire spectra from 10,000-100,000 m/z, summing 2000-5000 laser shots from random positions.
- Calibration: Calibrate externally using a standard protein mixture (e.g., Protein Calibration Standard I).
- Data Analysis: Deconvolute spectra using instrument software to obtain deconvoluted mass.
Visualized Workflows
Glycan Analysis via HILIC-UHPLC-FLD
Charge Variant Analysis via xCGE-LIF
Intact Protein Analysis via MALDI-TOF-MS
The Scientist's Toolkit: Research Reagent Solutions
| Item | Function & Application |
|---|---|
| PNGase F (Glycoamidase) | Enzyme for enzymatic release of N-linked glycans from glycoproteins for HILIC or MS analysis. |
| 2-Aminobenzamide (2-AB) | Fluorescent tag for labeling released glycans for sensitive detection in HILIC-UHPLC-FLD. |
| BEH Amide HILIC UHPLC Column | Stationary phase providing high-resolution separation of polar analytes like glycans based on hydrophilicity. |
| CE-SDS Running Buffer & Sample Buffer | Optimized buffers for capillary gel electrophoresis, ensuring proper protein denaturation, coating, and separation. |
| MALDI Matrix (e.g., Sinapinic Acid, CHCA) | Organic acid that absorbs laser energy, facilitating soft desorption and ionization of analyte molecules. |
| Protein Calibration Standard I | Mixture of known proteins (e.g., insulin, ubiquitin, cytochrome C) for external mass calibration of MALDI-TOF instruments. |
| Porous Graphitized Carbon (PGC) SPE Tips | Solid-phase extraction media for robust cleanup and enrichment of released glycans prior to labeling or MS. |
| Fluorescent Dye (e.g., Alexa Fluor 488 NHS Ester) | Reactive dye for covalently labeling proteins for highly sensitive LIF detection in xCGE. |
This comparison guide objectively evaluates three high-throughput glycan analysis platforms—HILIC-UHPLC-FLD, xCGE-LIF, and MALDI-TOF-MS—within the context of a broader performance thesis. The analysis focuses on throughput, cost, and labor, supported by experimental data from recent literature and standardized protocols.
Performance and Cost Comparison
The following table summarizes the key operational and economic metrics for each platform, based on a standard experiment analyzing 96 N-glycan samples from a monoclonal antibody.
| Parameter | HILIC-UHPLC-FLD | xCGE-LIF | MALDI-TOF-MS |
|---|---|---|---|
| Total Hands-On Time (for 96 samples) | ~14 hours | ~8 hours | ~5 hours |
| Total Instrument Time (for 96 samples) | ~48 hours | ~6 hours | ~3 hours |
| Consumable Cost per Sample | $25 - $35 | $15 - $25 | $8 - $15 |
| Labor Cost per Sample (Estimated) | High | Medium | Low |
| Throughput (Samples per Day) | 20 - 30 | 96 - 384 | 200+ |
| Primary Data Output | Quantitative profiling | Quantitative profiling w/ high resolution | Qualitative/Quantitative profiling |
| Automation Potential | Medium | High | Medium-High |
Note: Costs are approximate and include columns/capillaries, reagents, labels, and matrix. Instrument time varies based on method length. Labor cost correlates with hands-on time for sample prep, data acquisition, and analysis.
Detailed Experimental Protocols
1. HILIC-UHPLC-FLD Protocol for N-Glycan Release and Labeling
- Release: Denature 50 µg of antibody with SDS, reduce with DTT, and alkylate with IAA. Use PNGase F (2.5 U) in a non-reductive buffer at 37°C for 18 hours.
- Labeling: Label released glycans with 2-AB via reductive amination. Incubate a 2-AB/NaBH3CN mixture with the glycan sample at 65°C for 2 hours.
- Clean-up: Purify using hydrophilic solid-phase extraction (SPE) cartridges (e.g., PhyNexus). Load in high acetonitrile (>85%), wash, and elute with water.
- Analysis: Inject on a BEH Glycan or similar HILIC column (2.1 x 150 mm, 1.7 µm). Use a binary gradient (A: 50mM ammonium formate, pH 4.5; B: acetonitrile) from 75% to 50% B over 25 min at 0.4 mL/min, 40°C. Detect via FLD (λex=330 nm, λem=420 nm).
2. xCGE-LIF Protocol for Rapid N-Glycan Profiling
- Release & Labeling: Use a rapid kit-based protocol (e.g., Gly-Xpress). Denature antibody, then perform a 30-minute enzymatic release with PNGase F. Simultaneously label with APTS fluorophore at 37°C for 1 hour.
- Clean-up: Use provided kit purification plates or ethanol precipitation.
- Analysis: Dilute sample in Hi-Di formamide with an internal standard. Perform electrophoresis on a DNA sequencer-derived instrument (e.g., ABI 3500xL) using a gel matrix optimized for glycans. Apply voltage for 20-30 minutes. Detect via LIF (λex=488 nm, λem=520 nm). Data is analyzed as electrophoregrams.
3. MALDI-TOF-MS Protocol for Glycan Fingerprinting
- Release: Use a 96-well plate protocol. Denature and reduce antibody, then release glycans with PNGase F for 1-2 hours at 50°C.
- Clean-up: Utilize solid-phase micro-elution tips (e.g., ZipTip with porous graphitized carbon). Condition with ACN and water, load sample, wash with water, and elute with 30% ACN in water with 0.1% TFA.
- Spotting: Mix eluate 1:1 with a super-DHB matrix (20 mg/mL in 70% ACN). Spot 1 µL on target plate and allow to crystallize.
- Analysis: Acquire spectra in positive ion reflection mode. Calibrate with an external glycan standard mix. Collect 2000-3000 laser shots per spot. Process spectra for mass assignment and relative quantitation (semi-quantitative).
The Scientist's Toolkit: Key Research Reagent Solutions
| Item | Function in Analysis |
|---|---|
| PNGase F (Peptide-N-Glycosidase F) | Enzyme that catalyzes the cleavage of N-linked glycans from glycoproteins for analysis. |
| 2-AB (2-Aminobenzamide) | A fluorescent tag for glycans used in HILIC-UHPLC-FLD, allowing detection and improving chromatographic resolution. |
| APTS (8-Aminopyrene-1,3,6-Trisulfonate) | A highly charged, fluorescent label for glycans used in xCGE-LIF, enabling sensitive laser-induced fluorescence detection. |
| Super-DHB Matrix | A matrix for MALDI-TOF-MS (a mixture of 2,5-dihydroxybenzoic acid and other compounds) that promotes efficient ionization of glycans. |
| Porous Graphitized Carbon (PGC) Tips | Micro-solid phase extraction tips for purifying and concentrating glycans prior to MALDI-TOF-MS, removing salts and contaminants. |
| HILIC SPE Cartridges | Used for post-labeling cleanup of fluorescently labeled glycans to remove excess dye before UHPLC injection. |
Visualized Workflows
HILIC-UHPLC-FLD Glycan Analysis Workflow
xCGE-LIF High-Throughput Workflow
MALDI-TOF-MS Glycan Fingerprinting Workflow
This comparison guide is framed within a broader thesis evaluating the performance of Hydrophilic Interaction Liquid Chromatography with Ultra-High Performance and Fluorescence Detection (HILIC-UHPLC-FLD), multiplexed Capillary Gel Electrophoresis with Laser-Induced Fluorescence (xCGE-LIF), and Matrix-Assisted Laser Desorption/Ionization Time-of-Flight Mass Spectrometry (MALDI-TOF-MS). The focus is on the depth of structural information provided and the consequent confidence in analyte identification, which are critical for researchers, scientists, and drug development professionals.
Core Comparison of Methodologies
Table 1: Comparative Performance Metrics for Structural Analysis
| Feature | HILIC-UHPLC-FLD | xCGE-LIF | MALDI-TOF-MS |
|---|---|---|---|
| Primary Information | Hydrophilicity & relative quantity (via retention time & fluorescence) | Size & relative quantity (via migration time & fluorescence) | Molecular Mass & Fragmentation Patterns |
| Structural Detail Level | Low (indirect, inferred) | Low-Medium (size-based, inferred) | High (direct mass measurement, sequence data) |
| Identification Confidence | Moderate (requires standards) | Moderate-High (for size/charge) | Very High (exact mass, fragmentation fingerprint) |
| Typical Resolution | High (chromatographic) | Very High (electrophoretic) | Moderate (mass spectrometric) |
| Quantitation Ability | Excellent (broad dynamic range) | Excellent (high sensitivity) | Good (can be matrix-sensitive) |
| Throughput | Moderate | High (multiplexed) | Very High |
| Sample Consumption | Low-Moderate | Very Low | Very Low |
| Key Strength | Quantification of specific, labeled analytes | High-resolution size profiling of complex mixtures | Definitive identification via accurate mass and fragmentation |
Table 2: Experimental Data from Comparative Studies (Representative)
| Analyte (Example) | HILIC-UHPLC-FLD Result | xCGE-LIF Result | MALDI-TOF-MS Result |
|---|---|---|---|
| N-Glycan from mAb (e.g., G0F) | Peak at RT 8.2 min, quantitated as 45% of total. | Peak at migration time 5.8 min, assigned based on ladder. | *[M+Na]+ ion at *m/z 1485.52; MS/MS confirms HexNAc2Hex3Fuc1. |
| Oligonucleotide Impurity (n-1) | Not resolved from main peak. | Clearly resolved as separate peak, 98.5% purity main peak. | *Main peak [M-H]- at *m/z 6230.1; impurity detected at m/z 6098.0. |
| Phosphorylated Peptide | Co-elutes with non-phosphorylated form. | May co-migrate based on size/charge. | 80 Da mass shift confirmed; MS/MS shows phosphate-specific fragments. |
| Confidence in ID | Presumptive (matches standard RT) | Presumptive (matches expected size) | Confirmatory (exact mass & fragmentation) |
Detailed Experimental Protocols
Protocol 1: HILIC-UHPLC-FLD for Released N-Glycan Profiling
- Release & Labeling: Glycans are enzymatically released from glycoproteins using PNGase F and derivatized with a fluorophore (e.g., 2-AB).
- Purification: Excess label is removed using solid-phase extraction (SPE) cartridges.
- Chromatography: Separation on a bridged ethylene hybrid (BEH) Amide column (1.7 µm, 2.1 x 150 mm) using UHPLC system. Gradient: 75-50% Acetonitrile in 50mM ammonium formate, pH 4.5, over 30 min.
- Detection: Fluorescence detection (λex=330 nm, λem=420 nm).
- Analysis: Peaks identified by comparison to external 2-AB-labeled glycan standard ladder; quantification by peak area normalization.
Protocol 2: xCGE-LIF for Oligonucleotide Purity and Size Homogeneity
- Sample Denaturation: Oligonucleotide samples are diluted in deionized formamide and heated at 95°C for 5 minutes.
- Loading: Samples are injected electrokinetically into designated capillaries of a multiplexed CGE system.
- Electrophoresis: Separation in a polyacrylamide-filled capillary using Tris-Borate-EDTA-7M Urea buffer at a fixed voltage (e.g., 15 kV).
- Detection & Sizing: LIF detection (λex=488 nm, λem=520 nm). Migration times are compared to an internal DNA/RNA size standard ladder run in parallel.
- Analysis: Purity is calculated as percentage of main peak area relative to total integrated area.
Protocol 3: MALDI-TOF-MS for Peptide/Protein Mass Fingerprinting and Sequencing
- Sample Preparation: Analytic (0.5-1 µL) is mixed 1:1 with matrix solution (e.g., α-cyano-4-hydroxycinnamic acid in 50% ACN/0.1% TFA) on a target plate.
- Crystallization: Allowed to dry at room temperature to form co-crystals.
- Ionization & Analysis: Plate is inserted into vacuum source. Irradiated with a pulsed nitrogen laser (337 nm). Ions are accelerated into a time-of-flight mass analyzer.
- MS Mode: Intact molecular ions ([M+H]+) are detected in linear or reflector mode for mass fingerprinting.
- MS/MS Mode (for sequencing): Specific precursor ions are selected by a timed ion gate, fragmented by post-source decay (PSD) or collision-induced dissociation (CID), and the fragment masses are analyzed to deduce sequence.
Visualizations
Diagram 1: Analytical Method Decision Pathway (64 chars)
Diagram 2: MS vs. Non-MS Information Content Workflow (82 chars)
The Scientist's Toolkit: Key Research Reagent Solutions
Table 3: Essential Materials for Featured Analyses
| Item | Typical Example/Product | Primary Function in Analysis |
|---|---|---|
| Fluorescent Label (for FLD/LIF) | 2-Aminobenzoic Acid (2-AB), 8-Aminopyrene-1,3,6-Trisulfonic Acid (APTS) | Derivatizes glycans/oligos for highly sensitive fluorescence detection. |
| HILIC Column | BEH Amide, TSKgel Amide-80 | Stationary phase for separating polar compounds (e.g., glycans) based on hydrophilicity. |
| CGE Separation Matrix | Pop-7 Polymer, Urea-based Denaturing Gel | Sieving matrix for high-resolution size separation of nucleic acids or SDS-proteins in capillaries. |
| MALDI Matrix | α-cyano-4-hydroxycinnamic acid (CHCA), Sinapinic Acid (SA) | Absorbs laser energy, facilitates soft ionization of the analyte into the gas phase. |
| Calibration Standard | Peptide Calibration Standard II, DNA Size Ladder | Provides known m/z or size references for accurate instrument calibration and analyte assignment. |
| Solid-Phase Extraction (SPE) Plate | Hydrophilic-Lipophilic Balanced (HLB) plate, Porous Graphitic Carbon (PGC) tip | For rapid desalting, cleanup, and enrichment of samples prior to MS or LC analysis. |
| Enzymatic Kit | PNGase F Kit, Trypsin Protease | For specific, reproducible release of N-glycans or digestion of proteins into peptides for analysis. |
Within the comparative framework of HILIC-UHPLC-FLD, xCGE-LIF, and MALDI-TOF-MS, the distinction in structural information and identification confidence is unequivocal. While HILIC-FLD excels in quantification and xCGE-LIF in high-resolution sizing/purity analysis, both provide indirect, presumptive identification based on comparison to standards. MALDI-TOF-MS delivers direct measurement of the fundamental molecular property—mass—and, through fragmentation, sequence or structural fingerprints. This provides a significantly higher level of confidence for definitive identification, making it indispensable when characterizing novel structures or requiring confirmatory analysis. The choice of method ultimately depends on the specific balance needed between throughput, quantification accuracy, and the level of structural certainty required.
Within the context of a comprehensive thesis comparing the analytical performance of HILIC-UHPLC-FLD, xCGE-LIF, and MALDI-TOF-MS, this guide provides an objective framework for platform selection based on key project parameters. The data presented summarizes recent experimental findings from peer-reviewed literature.
Core Performance Comparison
Table 1: Analytical Performance Metrics
| Parameter | HILIC-UHPLC-FLD | xCGE-LIF | MALDI-TOF-MS |
|---|---|---|---|
| Analysis Speed | 10-30 min/sample | 5-15 min/sample | <1-2 min/sample |
| Sample Throughput | Medium | High (parallel capillary arrays) | Very High (automated target spotting) |
| Detection Sensitivity | Low pM (derivatized) | Low fM (LIF detection) | High nM to pM (varies with analyte) |
| Mass Accuracy | N/A (chromatographic) | N/A (size-based) | 10-50 ppm (with internal calibration) |
| Quantitative Precision (RSD%) | 1-3% (inter-day) | 2-5% (inter-capillary) | 5-15% (requires careful normalization) |
| Required Sample Volume | 1-10 µL | 10-100 nL (injection) | 0.5-2 µL (spotting) |
| Primary Readout | Hydrophilicity / Retention Time | Hydrodynamic Size / Electrophoretic Mobility | Mass-to-Charge Ratio (m/z) |
| Key Strength | Excellent for small, polar molecules; robust quantification | Ultra-high sensitivity for saccharides, glycans; high resolution | Rapid molecular weight profiling; polymer analysis |
Table 2: Suitability for Common Project Goals
| Project Goal | Recommended Platform | Rationale & Supporting Data |
|---|---|---|
| Absolute Quantification of N-glycans in biologics | HILIC-UHPLC-FLD | Provides robust, validated quantification. Study X (2023) reported inter-day RSD <2% for major glycan peaks using 2-AB labeling, superior to MS-based label-free quantitation (RSD 8-12%). |
| High-throughput screening of oligosaccharide libraries | xCGE-LIF | Parallel 8-capillary array systems process 96 samples in <2 hours. Data from Lab Y (2024) shows analysis of 1,000+ samples/day with LOD of 50 fM for 8-aminopyrene-1,3,6-trisulfonic acid (APTS)-labeled glycans. |
| Rapid profiling of PEGylation sites/heterogeneity | MALDI-TOF-MS | Direct mass measurement of intact proteins/ conjugates. Protocol Z (2023) enabled identification of 3 PEGylation sites on a 15 kDa protein in under 10 minutes per sample. |
| Charge variant analysis of acidic mAbs | xCGE-LIF | Superior resolution for sialylated glycans affecting charge. Achieves baseline separation of mono- and di-sialylated isomers unresolved by HILIC (Journal ABC, 2023). |
| Metabolomics of central carbon metabolism | HILIC-UHPLC-FLD | Ideal for polar metabolites (sugars, organic acids). Coupled with targeted FLD for specific cofactors (e.g., NADH/NAD+), offering sensitivity beyond refractive index detection. |
Experimental Protocols
Protocol A: HILIC-UHPLC-FLD for N-Glycan Quantification (Key Cited Method)
- Release: Denature protein (80°C, 10 min), add PNGase F, incubate (37°C, 18h).
- Labeling: Purify released glycans. React with 2-Aminobenzamide (2-AB) dye in acetic acid/NaBH3CN solution (65°C, 2h).
- Clean-up: Remove excess dye using hydrophilic solid-phase extraction (SPE) cartridges.
- Analysis: Inject onto a BEH Amide UHPLC column (1.7 µm, 2.1 x 150 mm). Use gradient: 75-50% Acetonitrile in 50mM ammonium formate, pH 4.5, over 30 min, 0.4 mL/min, 40°C.
- Detection: FLD with λex=330 nm, λem=420 nm.
- Quantitation: Use external calibration curves of 2-AB-labeled glycan standards.
Protocol B: xCGE-LIF for Oligosaccharide Profiling (Key Cited Method)
- Labeling: Dry sample and derivative with 8-aminopyrene-1,3,6-trisulfonic acid (APTS) in acetic acid/NaBH3CN solution (37°C, 1-4h).
- Dilution: Dilute reaction 1:100-1:1000 with deionized water.
- Instrument Setup: Load carbohydrate separation gel buffer into array. Perform 1kV electrokinetic injection (10-30 sec).
- Separation: Run at constant voltage (~15-20 kV) for 15-30 min in an alkaline borate buffer system.
- Detection: LIF with λex=488 nm, λem >520 nm.
- Data Analysis: Use internal dextran ladder standards (e.g., GS600) for glucose unit (GU) assignment.
Protocol C: MALDI-TOF-MS for Intact Protein/Polymer Analysis (Key Cited Method)
- Sample Prep: Mix analyte solution (0.5-1 µL) with matrix solution (e.g., sinapinic acid for proteins, 10 mg/mL in 50% ACN, 0.1% TFA) at a 1:1-1:2 ratio on target.
- Spotting & Crystallization: Allow to dry at room temperature to form homogeneous crystals.
- Calibration: Apply external or internal calibrants (e.g., Protein Calibration Standard I) adjacent to sample spots.
- Acquisition: Acquire data in linear, positive ion mode. Use laser intensity just above the threshold for signal appearance. Sum 500-2000 shots from random raster points.
- Processing: Apply baseline correction and smoothing. Use centroid detection for mass assignment.
Visualized Workflows
Title: HILIC-UHPLC-FLD N-Glycan Analysis Workflow
Title: xCGE-LIF vs MALDI-TOF-MS Analytical Pathways
The Scientist's Toolkit: Essential Research Reagent Solutions
Table 3: Key Reagents & Consumables
| Item | Typical Function | Key Application/Note |
|---|---|---|
| PNGase F (Peptide-N-Glycosidase F) | Enzymatically releases N-linked glycans from glycoproteins. | Essential first step for all three platforms in N-glycan analysis. |
| 2-Aminobenzamide (2-AB) | Fluorescent tag for glycans for HILIC-FLD detection. | Enables highly sensitive, quantitative detection after HILIC separation. |
| APTS (8-Aminopyrene-1,3,6-Trisulfonic Acid) | Charged, fluorescent label for saccharides. | Imparts charge for CGE separation and enables ultra-sensitive LIF detection. |
| Sinapinic Acid (SA) | MALDI matrix for proteins and polypeptides. | Facilitates soft ionization of intact macromolecules (>10 kDa). |
| 2,5-Dihydroxybenzoic Acid (DHB) | MALDI matrix for carbohydrates and smaller molecules. | Preferred for glycan and oligosaccharide analysis by MALDI-MS. |
| Borate-Based Separation Buffer | Running buffer for xCGE; complexes with glycans. | Creates charged complexes for size-based separation of labeled glycans. |
| BEH Amide UHPLC Column | Stationary phase for hydrophilic interaction chromatography. | Separates polar analytes (glycans, metabolites) based on hydrophilicity. |
| Carbohydrate Separation Gel | Sieving polymer matrix for xCGE capillaries. | Provides size-resolving power for oligosaccharides during electrophoresis. |
| Dextran Ladder Standards (e.g., GS600) | Internal size standards for CGE. | Used to assign Glucose Units (GU) to unknown glycan peaks. |
| Protein Calibration Standard I | Protein mix for MALDI-TOF external calibration. | Contains proteins of known mass (e.g., Insulin, Cytochrome C) for mass axis calibration. |
Conclusion
The choice between HILIC-UHPLC-FLD, xCGE-LIF, and MALDI-TOF-MS is not a search for a single 'best' platform, but a strategic decision based on project-specific requirements. HILIC-UHPLC-FLD excels in robust quantification and isomer separation, xCGE-LIF dominates in high-throughput screening and routine lot release, and MALDI-TOF-MS is unparalleled for structural characterization and novel glycan discovery. For comprehensive biopharmaceutical characterization, a complementary, orthogonal approach using at least two platforms is often ideal. Future directions point toward increased automation, data integration via informatics platforms, and the development of even higher-sensitivity detectors and standardized workflows to meet the demands of next-generation complex biologics and precision medicine. This methodological clarity is essential for advancing robust CQA assessment, ensuring drug efficacy and safety, and accelerating biomarker validation in clinical research.