Choosing the Right Tool: HILIC-UHPLC-FLD, MALDI-TOF-MS, and xCGE-LIF Compared for N-Glycan Analysis in Biopharmaceuticals
This article provides a comprehensive comparison of three high-resolution analytical methods for N-glycan profiling in biopharmaceutical development and quality control: Hydrophilic Interaction Liquid Chromatography with Fluorescence Detection (HILIC-UHPLC-FLD), Matrix-Assisted Laser...
Choosing the Right Tool: HILIC-UHPLC-FLD, MALDI-TOF-MS, and xCGE-LIF Compared for N-Glycan Analysis in Biopharmaceuticals
Abstract
This article provides a comprehensive comparison of three high-resolution analytical methods for N-glycan profiling in biopharmaceutical development and quality control: Hydrophilic Interaction Liquid Chromatography with Fluorescence Detection (HILIC-UHPLC-FLD), Matrix-Assisted Laser Desorption/Ionization Time-of-Flight Mass Spectrometry (MALDI-TOF-MS), and multiplexed Capillary Gel Electrophoresis with Laser-Induced Fluorescence (xCGE-LIF). Tailored for researchers, scientists, and drug development professionals, we explore the foundational principles, methodological applications, practical troubleshooting, and rigorous validation aspects of each technique. The analysis evaluates their respective strengths in throughput, sensitivity, structural resolution, and quantitative accuracy, offering a strategic guide for method selection based on specific project goals, regulatory requirements, and resource constraints in the development of monoclonal antibodies and other therapeutic glycoproteins.
Fundamentals of N-Glycan Analysis: Core Principles of HILIC, MALDI, and CGE Technologies
Why N-Glycan Profiling is Non-Negotiable in Biopharmaceutical Development
N-glycan profiling is a critical quality attribute (CQA) assessment in biopharmaceutical development. Glycosylation directly impacts therapeutic efficacy, safety, pharmacokinetics, and immunogenicity. This guide compares three principal analytical platforms for N-glycan analysis—HILIC-UHPLC-FLD, MALDI-TOF-MS, and xCGE-LIF—within a comprehensive method comparison research framework.
Method Comparison: Core Performance Metrics
The following table summarizes key performance metrics based on published comparative studies and application notes.
| Performance Metric | HILIC-UHPLC-FLD | MALDI-TOF-MS | xCGE-LIF |
|---|---|---|---|
| Resolution | High (Separates isomers, linkage variants). | Low to Medium (Separates by mass; isomers co-elute). | Very High (Excellent separation of positional/isomeric structures). |
| Sensitivity | High (fmol range with FLD). | Very High (amol to fmol range). | High (amol range with LIF). |
| Quantification Accuracy | Excellent (Molar quantitation via fluorescence). | Good (Semi-quantitative; depends on labeling & ionization efficiency). | Excellent (Directly proportional to fluorescence). |
| Throughput & Speed | Moderate (~30-60 min/sample). | High (Rapid acquisition after sample prep). | High (~5-15 min/sample). |
| Structural Information | Isomer separation, composition inferred. | Glycan composition (monosaccharide & linkage). | Isomer separation, composition inferred from mobility. |
| Ease of Automation | High (Fully automatable from release to analysis). | Medium (Often requires manual spotting). | High (Automated capillary array systems). |
| Glycan Library Dependence | High (Requires reference standards for identification). | Low (Theoretical mass matching possible). | High (Requires reference standards for peak assignment). |
| Cost per Analysis | Moderate. | High (Instrument cost, matrix reagents). | Low to Moderate. |
Experimental Protocols for Key Comparisons
Protocol 1: Comparison of Sensitivity and Linearity
Objective: Determine the limit of detection (LOD) and linear dynamic range for a standard N-glycan (e.g., A2G2) across platforms.
- Sample Prep: RNase B is used as a model glycoprotein. N-glycans are released using PNGase F, labeled with respective tags (2-AB for HILIC, procainamide for xCGE, or permethylated for MALDI).
- Dilution Series: Prepare a serial dilution of the labeled glycan pool from 1 pmol/µL to 1 amol/µL.
- Analysis:
- HILIC-UHPLC-FLD: Injections on a BEH Amide column (2.1 x 150 mm, 1.7 µm). Gradient: 75-62% Buffer B (50mM ammonium formate, pH 4.5) over 45 min. FLD: λex 330 nm, λem 420 nm.
- MALDI-TOF-MS: 1 µL of sample is spotted with DHB matrix (10 mg/mL in 50% ACN, 0.1% TFA). Data acquired in positive reflector mode.
- xCGE-LIF: Analysis on a PA800 Plus system with a laser-induced fluorescence detector. Separation in a N-CHO coated capillary using carbohydrate separation gel buffer.
- Data Analysis: Plot peak area/ intensity vs. amount injected. Calculate LOD (S/N=3) and linear regression (R²).
Protocol 2: Isomer Separation Capability
Objective: Assess resolution of isomeric glycan structures (e.g., galactose linkage isomers).
- Sample: Use a well-characterized mAb with a complex glycan profile.
- Release & Labeling: Standard release with PNGase F. Label with 2-AB (HILIC) or procainamide (xCGE). For MALDI, perform permethylation.
- Analysis: Run samples on all three platforms using standard methods.
- Comparison: Compare electropherograms/chromatograms/spectra for the number of resolved peaks in the G1F and G2F regions. Use known standards to confirm isomer identity (e.g., 1-3 vs 1-6 galactose).
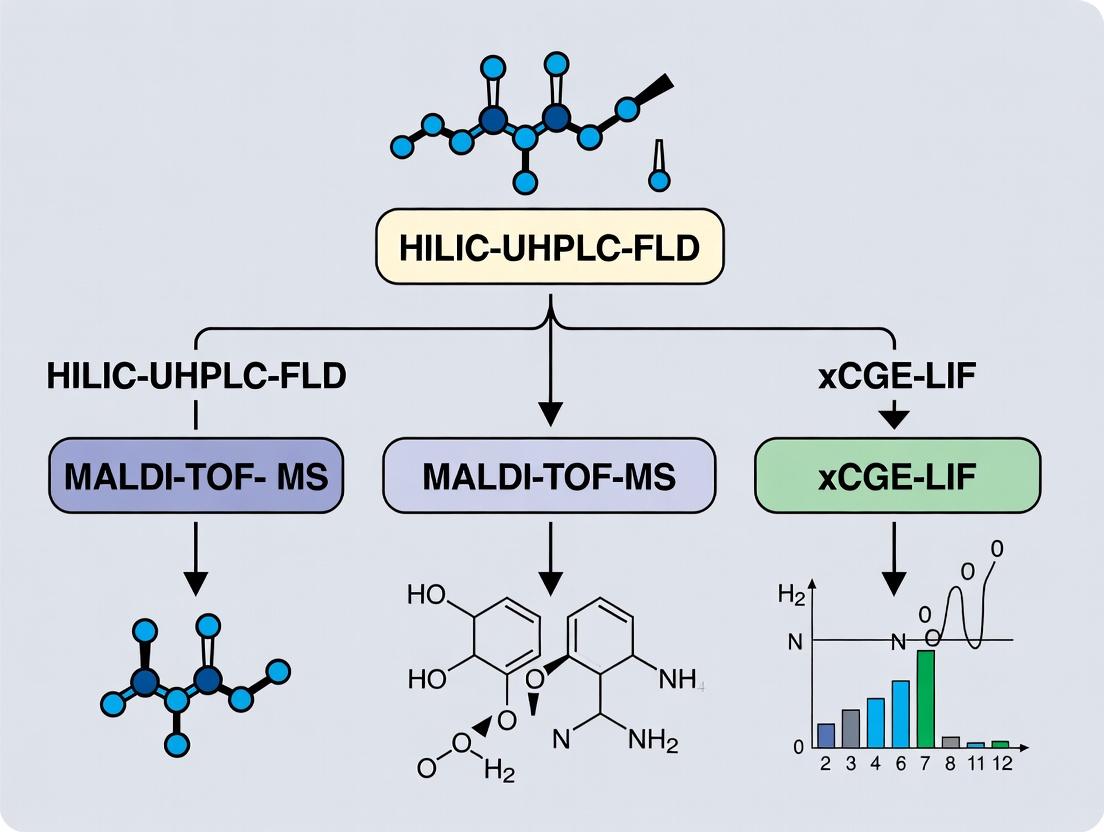
Visualizing the N-Glycan Analysis Workflow
Title: Comparative N-Glycan Analysis Platform Workflow
Title: Method Selection Logic for N-Glycan Profiling
The Scientist's Toolkit: Key Research Reagent Solutions
| Reagent / Material | Function in N-Glycan Analysis |
|---|---|
| PNGase F | Enzyme that cleaves N-glycans from the asparagine residue of glycoproteins. Foundation of release. |
| Rapid/SPE Glycan Clean-up Kits | Solid-phase extraction cartridges or plates for purifying released glycans from proteins and salts. |
| Fluorescent Tags (2-AB, Procainamide) | Covalently label glycans for detection in HILIC-FLD and xCGE-LIF. Enable sensitive, quantitative analysis. |
| MALDI Matrices (DHB, THAP) | Organic acids that co-crystallize with glycans, enabling desorption/ionization in MALDI-TOF-MS. |
| N-Glycan Calibration Standards | Defined glycan libraries (e.g., A2, A2G2, Man5) essential for peak assignment and method validation. |
| BEH Amide HILIC Columns | Stationary phase for UHPLC providing high-resolution separation of glycan isomers based on hydrophilicity. |
| Carbohydrate Separation Gel Buffer | Proprietary sieving matrix for xCGE enabling high-resolution separation based on size and charge. |
| Coated Capillaries (e.g., N-CHO) | Capillaries with a neutral hydrophilic coating to suppress electroosmotic flow (EOF) for reproducible xCGE. |
This comparison guide is situated within a comprehensive thesis evaluating orthogonal analytical platforms for the characterization of complex biological samples, focusing on biopharmaceuticals and biomarker discovery. The primary methodologies under scrutiny are Hydrophilic Interaction Liquid Chromatography coupled with Ultra-High-Performance Liquid Chromatography and Fluorescence Detection (HILIC-UHPLC-FLD), Matrix-Assisted Laser Desorption/Ionization Time-of-Flight Mass Spectrometry (MALDI-TOF-MS), and multiplexed Capillary Gel Electrophoresis with Laser-Induced Fluorescence (xCGE-LIF). This article provides an objective performance comparison of HILIC-UHPLC-FLD against these alternatives, supported by current experimental data.
Method Comparison: Core Principles and Applications
HILIC-UHPLC-FLD
HILIC separates polar and hydrophilic compounds using a hydrophilic stationary phase (e.g., bare silica or amide) and a hydrophobic organic-rich mobile phase (e.g., acetonitrile). UHPLC provides high-resolution, high-speed separation. FLD offers selective and sensitive detection for native fluorescent analytes or those derivatized with fluorescent tags.
MALDI-TOF-MS
This technique ionizes non-volatile molecules (like proteins, peptides) embedded in a matrix using a laser. Time-of-flight analysis provides accurate mass determination. It excels in speed, high-throughput profiling, and intact mass analysis but offers limited separation capability for complex mixtures prior to ionization.
xCGE-LIF
Capillary Gel Electrophoresis separates biomolecules (like DNA, SDS-proteins) by size in a sieving polymer matrix within capillaries. LIF detection provides high sensitivity for fluorescently labeled species. The multiplexed (xC) format allows parallel analysis of multiple samples.
Experimental Protocols for Cited Comparisons
Protocol 1: Glycan Profiling Comparison (HILIC-UHPLC-FLD vs. MALDI-TOF-MS)
Sample: Released N-glycans from a monoclonal antibody (mAb), labeled with 2-AB (fluorophore). HILIC-UHPLC-FLD Method:
- Column: BEH Amide, 1.7 µm, 2.1 x 150 mm.
- Mobile Phase: A) 50 mM ammonium formate, pH 4.4; B) Acetonitrile.
- Gradient: 75% B to 50% B over 25 min, 0.5 mL/min, 40°C.
- Detection: FLD, λex=330 nm, λem=420 nm. MALDI-TOF-MS Method:
- Matrix: 2,5-Dihydroxybenzoic acid (DHB).
- Sample Prep: Labeled glycans desalted and spotted with matrix.
- Analysis: Positive ion reflection mode, mass range 1000-4000 Da. Metrics: Resolution (Rs) of isomeric structures, sensitivity (Limit of Detection - LOD), quantitative linearity (R²), analysis time per sample, and structural information depth.
Protocol 2: Impurity/Purity Analysis Comparison (HILIC-UHPLC-FLD vs. xCGE-LIF)
Sample: Synthetic oligonucleotide with failure sequences. HILIC-UHPLC-FLD Method:
- Column: BEH HILIC, 1.7 µm.
- Mobile Phase: A) 100 mM TEAA in water; B) Acetonitrile.
- Gradient: 85% B to 60% B over 10 min.
- Detection: FLD (if intrinsically fluorescent or labeled). xCGE-LIF Method:
- Chip/Capillary: 96-capillary array.
- Gel: Replaceable polymer sieving matrix.
- Separation: Voltage application for size-based separation.
- Detection: LIF, appropriate wavelength for label. Metrics: Separation efficiency (Theoretical Plates), resolution of length variants, throughput (samples per hour), and quantitation accuracy for minor impurities.
Table 1: Quantitative Comparison of Key Performance Indicators
| Performance Indicator | HILIC-UHPLC-FLD | MALDI-TOF-MS | xCGE-LIF |
|---|---|---|---|
| Separation Mechanism | Polarity (Hydrophilicity) | Mass/Charge (Post-lysis) | Size (Hydrodynamic Radius) |
| Quantitative Linearity (R²) | ≥0.999 (over 3 orders) | ~0.99 (over 2 orders) | ≥0.998 (over 3 orders) |
| Typical LOD (Glycan Analysis) | Low fmol (for labeled) | Mid amol-fmol | Low amol (for labeled) |
| Isomeric Resolution | High | Low | Not Applicable |
| Throughput (Samples/Hour) | 2-4 (Detailed Profile) | 96+ (Rapid Profiling) | 96+ (Parallel Run) |
| Structural Information | Low (Co-elution w/ standards) | High (Accurate Mass) | Low (Size only) |
| Primary Application Focus | Detailed, quantitative isomer separation | High-throughput mass profiling, intact mass | High-throughput size/purity analysis |
| Sample Consumption | Low (µL injection) | Very Low (nL spot) | Very Low (pL-nL injection) |
Table 2: Comparison of Strengths and Limitations in Biopharma Context
| Aspect | HILIC-UHPLC-FLD | MALDI-TOF-MS | xCGE-LIF |
|---|---|---|---|
| Key Strength | Superior resolution of polar isomer mixtures (glycans, nucleotides). | Unmatched speed and intact molecular weight data. | Highest multiplexed throughput for size-based assays. |
| Key Limitation | Requires derivatization for FLD; limited structural ID. | Quantitative robustness; limited separation of mixtures. | Limited to size-based separation; no polarity/mass info. |
| Ideal Use Case | QC release testing for glycan occupancy, nucleotide impurity profiling. | Clone screening, post-translational modification (PTM) profiling. | DNA fragment analysis, protein purity/aggregation screening. |
Visualized Workflows and Relationships
Diagram 1: HILIC-UHPLC-FLD Analytical Workflow (64 chars)
Diagram 2: Analytical Method Selection Logic (55 chars)
The Scientist's Toolkit: Research Reagent Solutions
| Item | Function in HILIC-UHPLC-FLD Context |
|---|---|
| BEH Amide / Silica HILIC Columns | Stationary phase providing the hydrophilic interaction surface for separating polar compounds. |
| 2-Aminobenzamide (2-AB) / Procainamide | Fluorescent labeling reagents for derivatizing reducing glycans to enable sensitive FLD detection. |
| Ammonium Acetate/Formate Buffers | Volatile, MS-compatible buffer salts for preparing mobile phase A, critical for controlling pH and ionization. |
| Acetonitrile (HPLC Grade) | Primary organic solvent for mobile phase B in HILIC, creating the water-rich layer on the stationary phase. |
| Fluorescent Derivatization Kit | Standardized kits (e.g., for amines, carboxylic acids) to tag non-fluorescent analytes for selective FLD. |
| UHPLC-Compatible Vials & Inserts | Low-volume, low-adsorption vials to prevent sample loss and ensure injection precision. |
| Solid Phase Extraction (SPE) Plates | For sample clean-up and enrichment of polar analytes prior to HILIC analysis (e.g., GlycanClean S). |
This comparison guide evaluates xCGE-LIF (Capillary Gel Electrophoresis with Laser-Induced Fluorescence) within a broader method comparison research thesis on analyzing biologics, focusing on aggregate and fragment characterization. The primary alternatives are HILIC-UHPLC-FLD (Hydrophilic Interaction Liquid Chromatography-Ultra High Performance with Fluorescence Detection) and MALDI-TOF-MS (Matrix-Assisted Laser Desorption/Ionization Time-of-Flight Mass Spectrometry).
Performance Comparison Table
Table 1: Core Method Comparison for Size Variant Analysis of Monoclonal Antibodies
| Feature | xCGE-LIF | HILIC-UHPLC-FLD | MALDI-TOF-MS |
|---|---|---|---|
| Separation Principle | Size (in a sieving matrix) | Hydrophilicity/Polarity | Mass-to-Charge Ratio (m/z) |
| Key Analyte Suitability | Fragments, Aggregates (1-10% size difference) | Glycoforms, Charged Variants | Intact Mass, Primary Sequence |
| Typical Resolution (Rs) | High (Rs > 2.5 for fragments) | Moderate (Rs ~ 1.5-2 for glycoforms) | Low for heterogeneous mixtures |
| Detection Sensitivity (LOD) | ~0.05% (fluorescently labeled) | ~0.1-0.5% (native fluorescence) | ~1-5% (highly sample-dependent) |
| Analysis Speed (per sample) | 30-45 minutes | 15-30 minutes | 5-10 minutes (incl. prep) |
| Quantitation Ability | Excellent (linear range >10³) | Excellent (linear range >10³) | Poor to Moderate |
| Sample Throughput | Medium (serial analysis) | High (parallel UHPLC) | Very High (automated spotting) |
| Primary Data Output | Electropherogram (size, % area) | Chromatogram (retention time, % area) | Mass Spectrum (m/z, intensity) |
| Key Limitation | Requires fluorescent labeling | Limited size-based resolution | Poor for large aggregates, quantitation challenges |
Table 2: Experimental Data Summary for mAb Fragment Analysis (Theoretical Data Based on Current Literature)
| Method | Detected Fragment (% of main peak) | RSD (n=6, %) | Sample Prep Time | Required Sample Amount |
|---|---|---|---|---|
| xCGE-LIF (non-reduced) | 0.15% | 2.1 | 90 min (labeling) | 10 µg |
| HILIC-UHPLC-FLD (native) | 1.2% (co-eluted) | 3.5 | 20 min | 25 µg |
| MALDI-TOF-MS (intact) | 5.0% (detectable but not quantifiable) | 15.8 | 30 min | 1 µg |
Experimental Protocols
Protocol 1: xCGE-LIF for mAb Size Variant Analysis
- Sample Derivatization: Dilute mAb sample to ~2 mg/mL in PBS. Mix 10 µL of sample with 2.5 µL of 10 mM Cy5 succinimidyl ester dye (in DMF). Incubate at 25°C in the dark for 90 minutes.
- Purification: Remove excess dye using a size-exclusion spin column (e.g., Zeba Spin Desalting Column, 7K MWCO) per manufacturer instructions. Elute in CE sample buffer.
- Instrument Setup: Use a commercial CGE-LIF system (e.g., PA 800 Plus). Install a bare-fused silica capillary (50 µm i.d., 30 cm effective length). Fill with a replaceable linear polyacrylamide gel matrix.
- Run Conditions: Dilute labeled sample 1:10 in water. Inject electrokinetically at 5 kV for 20 sec. Separate at 15 kV for 30 minutes in 1x Tris-Borate-EDTA (TBE) running buffer. Detect with a 635 nm laser excitation and 670 nm emission filter.
- Data Analysis: Integrate peaks using instrument software. Identify species by migration time relative to an internal size standard ladder. Calculate percent area.
Protocol 2: HILIC-UHPLC-FLD for mAb Glycoform/Acidic Variant Analysis
- Sample Prep: Dilute mAb to 1 mg/mL in Milli-Q water.
- Chromatography: Use a commercial UHPLC system with FLD. Employ a BEH Glycan or similar HILIC column (1.7 µm, 2.1 x 150 mm). Column temp: 60°C.
- Gradient: Mobile Phase A: 100 mM Ammonium Formate, pH 4.4. Mobile Phase B: Acetonitrile. Linear gradient from 75% B to 50% B over 15 min. Flow rate: 0.4 mL/min.
- Detection: FLD with λex = 280 nm, λem = 350 nm (for native Trp fluorescence).
- Analysis: Integrate peaks. Relative quantification based on % area.
Protocol 3: MALDI-TOF-MS for Intact mAb Mass Analysis
- Sample Prep: Desalt mAb sample using C4 ZipTips. Elute in 70% acetonitrile, 0.1% trifluoroacetic acid (TFA).
- Matrix Preparation: Prepare a saturated solution of sinapinic acid in 50% acetonitrile/0.1% TFA.
- Spotting: Use the dried droplet method. Mix 1 µL of sample with 1 µL of matrix on a polished steel target. Allow to air dry.
- Acquisition: Use a linear, positive-ion mode MALDI-TOF instrument. Set acceleration voltage to 25 kV. Acquire spectra from 50,000 to 150,000 m/z, summing 1000-2000 laser shots.
- Processing: Calibrate spectrum using an external protein standard. Perform baseline correction and smoothing.
Workflow and Context Diagrams
Comparison of Analytical Methodologies in Biologics Thesis
Workflow Comparison: xCGE-LIF vs HILIC-FLD vs MALDI-TOF
The Scientist's Toolkit: Research Reagent Solutions
Table 3: Essential Materials for xCGE-LIF Biologics Analysis
| Item | Function | Example/Notes |
|---|---|---|
| Fluorescent Dye (NHS-Ester) | Covalently labels primary amines (lysines) on proteins for sensitive LIF detection. | Cy5, Alexa Fluor 647. Must be in anhydrous DMF. |
| Replaceable Gel Matrix | A linear polymer solution acting as a dynamic sieve for size-based separation inside the capillary. | Linear polyacrylamide (LPA) or polyethylene oxide (PEO). |
| CE Running Buffer (TBE) | Provides consistent ionic strength and pH for stable electrophoresis. | 1x Tris-Borate-EDTA, pH 8.3. Filtered (0.2 µm). |
| Internal Size Standard Ladder | A mixture of labeled proteins/analytes of known size for precise migration time calibration. | Commercial ladder covering 10-225 kDa range. |
| Bare Fused Silica Capillary | The separation channel. Bare silica generates electroosmotic flow (EOF) for matrix replacement. | 50 µm inner diameter, 30-50 cm total length. |
| Desalting Spin Columns | Removes unreacted dye and exchanges buffer post-labeling to prevent interference. | Zeba plates, 7K or 40K MWCO. |
| CE Performance Test Mix | A standard labeled protein/peptide mix to verify system resolution and sensitivity before sample runs. | Used for daily QC of the instrument. |
In analytical method development for biologics, particularly for characterizing glycosylation profiles of therapeutic proteins, selecting the optimal platform is critical. This guide compares three prominent techniques—HILIC-UHPLC-FLD (Hydrophilic Interaction Liquid Chromatography-Ultra High-Performance Liquid Chromatography with Fluorescence Detection), MALDI-TOF-MS (Matrix-Assisted Laser Desorption/Ionization Time-of-Flight Mass Spectrometry), and xCGE-LIF (Capillary Gel Electrophoresis with Laser-Induced Fluorescence)—by evaluating four fundamental performance metrics. The context is a broader thesis comparing their efficacy in N-glycan profiling for monoclonal antibody (mAb) drug development.
Performance Metric Definitions and Comparative Data
Resolution
Definition: The ability to separate two adjacent peaks (glycoforms). Higher resolution allows for more precise identification of structurally similar glycans. Comparative Table: Resolution (R_s) for Common N-glycan Isomers
| Method | R_s (G1F vs G1F') | R_s (FA2 vs FA2G1) | Experimental Conditions |
|---|---|---|---|
| HILIC-UHPLC-FLD | 1.8 - 2.2 | 2.5 - 3.0 | BEH Amide column (2.1x150 mm, 1.7µm), 40°C, Acetonitrile/AmAc pH4.5 gradient. |
| MALDI-TOF-MS | Not resolved | Not resolved | DHB matrix, reflector positive mode, 500-5000 Da range. |
| xCGE-LIF | 1.5 - 1.9 | 2.2 - 2.7 | DNA-sequencing derived gel array, 50 µm ID capillary, 30 kV. |
Sensitivity
Definition: The lowest detectable amount of analyte. Crucial for analyzing samples from limited sources or with low abundance glycoforms. Comparative Table: Limit of Detection (LOD) for a Standard N-glycan (NA2)
| Method | LOD (femtomoles) | Sample Consumption | Key Sample Prep Step |
|---|---|---|---|
| HILIC-UHPLC-FLD | 0.5 - 1.0 fmol | ~5 µg of mAb digest | 2-AB fluorescent labeling (2-4 hrs). |
| MALDI-TOF-MS | 10 - 50 fmol | ~1 µg of mAb digest | Permethylation (optional, enhances sensitivity). |
| xCGE-LIF | 0.1 - 0.3 fmol | ~0.5 µg of mAb digest | APTS fluorescent labeling (overnight reaction). |
Throughput
Definition: The number of samples analyzed per unit time, including preparation and data analysis. Comparative Table: Estimated Throughput for a 96-Sample Batch
| Method | Total Hands-on Time | Total Run Time (approx.) | Automation Potential |
|---|---|---|---|
| HILIC-UHPLC-FLD | 8-10 hours | 24-36 hours | High (auto-sampler, batch processing). |
| MALDI-TOF-MS | 4-6 hours | 2-4 hours | Medium (auto-target spotting). |
| xCGE-LIF | 6-8 hours | 8-12 hours | High (multi-capillary arrays). |
Dynamic Range
Definition: The linear range over which analyte response is proportional to its concentration, essential for quantifying major and minor glycoforms in one run. Comparative Table: Dynamic Range for Quantification of a Major Glycan (FA2)
| Method | Linear Dynamic Range (orders of magnitude) | Typical R² Value |
|---|---|---|
| HILIC-UHPLC-FLD | 2.5 - 3 | >0.998 |
| MALDI-TOF-MS | 1.5 - 2 (w/ internal standards) | >0.990 |
| xCGE-LIF | 3 - 4 | >0.999 |
Detailed Experimental Protocols
Protocol 1: HILIC-UHPLC-FLD for Released N-glycans
- Release: Denature 50 µg mAb with SDS, add PNGase F, incubate at 37°C for 3 hours.
- Labeling: Purify released glycans via solid-phase extraction (SPE). Dry and label with 2-Aminobenzoic acid (2-AB) in 30% Acetic Acid/DMSO with Sodium Cyanoborohydride at 65°C for 2 hours.
- Clean-up: Remove excess label using HILIC SPE cartridges.
- Separation & Detection: Inject onto a BEH Amide UPLC column (Waters). Use a gradient from 75% to 50% Acetonitrile in 50 mM Ammonium Formate, pH 4.5, over 30 min at 0.4 mL/min, 40°C. Detect via FLD (λex=330 nm, λem=420 nm).
Protocol 2: MALDI-TOF-MS Profiling of Permethylated Glycans
- Release & Permethylation: Release glycans as in Protocol 1. Dry completely. Solubilize in DMSO, add NaOH slurry and Methyl Iodide, agitate vigorously for 10 min.
- Extraction: Stop reaction with water, extract permethylated glycans with Dichloromethane. Wash organic layer with water and dry.
- Spotting: Reconstitute in 70% Methanol. Mix 1:1 with 20 mg/mL 2,5-Dihydroxybenzoic acid (DHB) matrix. Spot 1 µL on target, let crystallize.
- Analysis: Acquire spectra in positive reflector mode (mass range 1000-5000 Da). Calibrate externally with a peptide standard mix.
Protocol 3: xCGE-LIF with APTS Labeling
- Release & Labeling: Release glycans as in Protocol 1. Dry and label with 8-Aminopyrene-1,3,6-Trisulfonic Acid (APTS) in 15% Acetic Acid with Sodium Cyanoborohydride at 37°C overnight (16 hours).
- Clean-up: Remove excess APTS via size-exclusion filtration or dilution.
- Electrophoresis: Load sample onto a DNA sequencer (e.g., Applied Biosystems 3500) with a gel matrix optimized for carbohydrates. Use a 50 cm capillary array. Inject electrokinetically at 1-3 kV for 10-20 sec. Run at 15-30 kV.
- Detection: LIF detection with λex=488 nm, λem=520 nm.
Method Selection Workflow for N-glycan Analysis
The Scientist's Toolkit: Key Research Reagent Solutions
| Item/Category | Primary Function in N-glycan Analysis |
|---|---|
| PNGase F (Glycoamidase F) | Enzyme that cleaves N-linked glycans from the protein backbone between the innermost GlcNAc and asparagine residue, essential for release. |
| 2-AB Labeling Kit | Provides reagents for fluorescently tagging released glycans for highly sensitive detection in UHPLC-FLD. |
| APTS (for LIF) | Tris-sulfonated fluorescent dye used for tagging glycans in xCGE-LIF, providing charge for electrophoretic separation and high sensitivity. |
| DHB Matrix | Matrix compound for MALDI-TOF-MS that co-crystallizes with the analyte, assisting desorption/ionization with minimal fragmentation. |
| Permethylation Reagents | Set including DMSO, NaOH slurry, and Methyl Iodide. Increases glycan hydrophobicity and stabilizes sialic acids, improving MS sensitivity and profiling. |
| HILIC SPE Microplates | Solid-phase extraction plates for post-labeling clean-up of fluorescently tagged glycans, removing excess dye before UHPLC injection. |
| Carbohydrate Separation Gel | Proprietary gel polymer for capillary arrays in xCGE instruments, providing the sieving matrix for high-resolution glycan separation by size and charge. |
| External Calibrant Mix (MS) | A standard mix of known peptides or proteins used to calibrate the m/z axis of the MALDI-TOF mass spectrometer before glycan analysis. |
Step-by-Step Workflow Guide: From Sample Prep to Data for Each Method
Effective sample preparation is a critical determinant of success in high-resolution analytical techniques. Within the context of comparing HILIC-UHPLC-FLD, MALDI-TOF-MS, and xCGE-LIF for biomolecular analysis—such as glycoprotein or oligonucleotide characterization—shared sample preparation stages profoundly impact data quality, reproducibility, and platform compatibility. This guide compares standard protocols and performance outcomes across these three methodologies.
Release Strategies
The liberation of analytes from complex matrices or solid supports is the foundational step.
- HILIC-UHPLC-FLD (e.g., for N-glycans): Chemical or enzymatic release is standard. Enzymatic release with Peptide-N-Glycosidase F (PNGase F) is the gold standard for N-glycans, preserving the reducing end for subsequent labeling. Experimental data shows PNGase F incubation (37°C, 18 hours) achieves >95% release efficiency for monoclonal antibodies, compared to chemical hydrazinolysis which, while comprehensive, can cause desialylation and is less reproducible.
- MALDI-TOF-MS (e.g., for glycans/peptides): Enzymatic release is preferred for compatibility. In-source fragmentation is a concern, making gentle release crucial. Protocols often incorporate a rapid cleanup post-release to remove salts and detergents that suppress ionization.
- xCGE-LIF (e.g., for oligonucleotides or released glycans): Release from conjugation resins (in synthesis) or enzymatic cleavage from proteins is typical. For glycans, the same PNGase F protocol is used, but completeness of release is paramount to avoid heterogeneous peaks in the highly sensitive electrophoretic separation.
Table 1: Comparison of Release Strategies and Outcomes
| Method | Primary Release Technique | Typical Efficiency | Key Artifact/Risk | Compatible Cleanup Post-Release |
|---|---|---|---|---|
| HILIC-UHPLC-FLD | PNGase F (Enzymatic) | 95-99% | Incomplete release, denaturant carryover | Solid-Phase Extraction (SPE) |
| MALDI-TOF-MS | PNGase F / Trypsin | 90-98% | Sodium adducts, in-source decay, matrix interference | ZipTip/C18 micro-column |
| xCGE-LIF | PNGase F / Alkaline Phosphatase | >98% required | Contaminating nucleotides or salts affecting mobility | Ethanol precipitation, SPE |
Labeling Strategies
Labeling imparts detection specificity or enhances sensitivity.
- HILIC-UHPLC-FLD: Relies on fluorescent tags (e.g., 2-AB, Procainamide). Procainamide labeling offers higher fluorescence yield, improving sensitivity 3-5 fold over 2-AB based on comparative studies. Labeling efficiency must be >99% to avoid shoulder peaks in UHPLC.
- MALDI-TOF-MS: Often uses non-fluorescent tags or relies on native mass. Derivatization (e.g., permethylation) enhances ionization efficiency and provides structural insights but adds protocol complexity. Unlabeled native glycans often suffer from low ionization efficiency.
- xCGE-LIF: Requires fluorophore conjugation (e.g., APTS, FAM). APTS labeling is standard for glycans, attaching three negative charges that also facilitate electrophoretic separation. Incomplete labeling directly translates to missing or low-signal peaks.
Table 2: Comparison of Labeling Reagents and Performance Data
| Method | Typical Label | Function | Optimal Efficiency | Impact on Sensitivity (vs. untagged) |
|---|---|---|---|---|
| HILIC-UHPLC-FLD | Procainamide | Fluorescence, minor hydrophilicity | >99% | 3-5x increase in FLD signal |
| MALDI-TOF-MS | Permethylation | Enhanced ionization, structural stability | ~95% | 10-50x increase in ion abundance |
| xCGE-LIF | APTS | Fluorescence & charge for mobility | >99.5% | Essential for LIF detection; 1000x over UV |
Cleanup Strategies
Final purification removes interferents prior to analysis.
- HILIC-UHPLC-FLD: Hydrophilic Interaction Solid-Phase Extraction (HILIC-SPE) is dominant. Comparative data shows HILIC µElution plates provide >85% recovery of labeled glycans while removing >99.8% of free dye, outperforming traditional gel filtration methods which recover only ~70%.
- MALDI-TOF-MS: Requires spot preparation compatibility. Cation exchange (for salt removal) followed by on-target washing with cold organic solvents is most effective. Data indicates this combination reduces alkali adduct formation by >90% compared to simple desalting columns.
- xCGE-LIF: Demands extreme purity for electrophoresis. Size-exclusion filtration or selective precipitation is used. Experiments demonstrate that a dual-step cleanup (SPE followed by ethanol precipitation) yields the highest resolution (theoretical plates > 1 million/meter) by eliminating particulates and neutral contaminants.
Table 3: Cleanup Protocol Efficacy Comparison
| Method | Recommended Cleanup Protocol | Key Metric: Recovery | Key Metric: Interferent Removal |
|---|---|---|---|
| HILIC-UHPLC-FLD | HILIC µElution SPE (Wash: ACN, Elute: Water) | 85-92% | >99.8% free dye |
| MALDI-TOF-MS | ZipTip C18 + On-target 10mM Ammonium Phosphate wash | 60-75% | >90% salt adducts |
| xCGE-LIF | Oligo-SPE Cartridge + Cold Ethanol Precipitation | 80-85% | >99% salts, unincorporated dye |
Experimental Protocols
Protocol A: Universal PNGase F Release for N-Glycans
- Dry 50 µg of glycoprotein in a low-binding microtube.
- Denature in 20 µL of 1% SDS, 50 mM DTT at 60°C for 10 min.
- Add 30 µL of 4% NP-40, 50 mM ammonium bicarbonate.
- Add 2 µL (10 U) PNGase F. Incubate at 37°C for 18 hours.
- Stop reaction by heating at 70°C for 10 min.
Protocol B: Procainamide/2-AB Fluorescent Labeling (for HILIC/UHPLC-FLD & xCGE-LIF)
- Dry released glycans completely in a vacuum centrifuge.
- Prepare labeling solution: Procainamide (or 2-AB) in DMSO/acetic acid (70:30 v/v) with sodium cyanoborohydride.
- Add 25 µL to dried glycans. Vortex and centrifuge.
- Incubate at 65°C for 2 hours.
- Cool to room temperature before cleanup.
Protocol C: HILIC-SPE Cleanup for Labeled Glycans
- Condition a HILIC µElution plate with 200 µL water.
- Equilibrate with 200 µL of 95% acetonitrile (ACN) twice.
- Load sample in >85% ACN.
- Wash 3x with 200 µL of 95% ACN.
- Elute with 2x 50 µL of HPLC-grade water. Collect, dry, and reconstitute.
The Scientist's Toolkit: Key Research Reagent Solutions
| Item/Reagent | Primary Function | Example Vendor/Product Code Context |
|---|---|---|
| Recombinant PNGase F | Enzymatic release of N-linked glycans without chemical degradation | ProZyme PR-GP01, Roche 11365193001 |
| Procainamide HCl | High-sensitivity fluorescent labeling for chromatography/electrophoresis | Sigma-Aldrich 87610 |
| 2-AB (2-Aminobenzamide) | Standard fluorescent tag for glycan profiling | Merck 02-0464-01 |
| APTS (8-aminopyrene-1,3,6-trisulfonate) | Charged fluorophore for CGE-LIF analysis | Beckman Coulater 608015 |
| HILIC µElution Plates | High-recovery solid-phase extraction for polar labeled glycans | Waters 186002836 |
| C18 ZipTips | Microscale desalting and purification for MALDI-MS | Millipore ZTC18S096 |
| Permethylation Kit | Derivatization for enhanced MS ionization and linkage analysis | Thermo Scientific TS-25901 |
Visualized Workflows
Core Sample Preparation Pathway for HILIC, MS, and CGE
Cleanup Strategy Selection by Analytical Goal
Within a comprehensive thesis comparing three orthogonal analytical platforms for complex biomolecular analysis—HILIC-UHPLC-FLD, MALDI-TOF-MS, and xCGE-LIF—this guide focuses on the performance of Hydrophilic Interaction Liquid Chromatography coupled with Ultra-High Performance Liquid Chromatography and Fluorescence Detection. This technique is particularly critical for the sensitive, quantitative analysis of small, polar, and charged analytes like glycans, nucleotides, and amino acids in drug development.
Method Comparison: HILIC-UHPLC-FLD vs. MALDI-TOF-MS vs. xCGE-LIF
The following table objectively compares the core characteristics of the three methods based on current literature and standard implementations.
Table 1: Platform Comparison for Biomolecular Analysis
| Parameter | HILIC-UHPLC-FLD | MALDI-TOF-MS | xCGE-LIF |
|---|---|---|---|
| Primary Analytical Strength | Quantitative profiling of small, polar molecules. | High-throughput molecular weight fingerprinting. | High-resolution separation of charged biomolecules (e.g., mAbs, oligonucleotides). |
| Detection Mechanism | Fluorescence (often after derivatization). | Mass-to-charge ratio. | Laser-induced fluorescence (often after tagging). |
| Quantitative Performance | Excellent linearity, low limits of quantification (LOQ). | Semi-quantitative; requires careful calibration. | Good quantitative capability. |
| Speed & Throughput | Moderate (5-20 min runs). | Very High (seconds per sample). | High (1-5 min runs). |
| Structural Information | Indirect (via retention time). | Direct (mass, fragmentation). | Indirect (via migration time). |
| Sample Consumption | Low (µL volumes). | Very Low (nL spots). | Very Low (nL injections). |
| Key Limitation | Requires derivatization for many analytes (FLD). | Ion suppression in mixtures; matrix effects. | Method development complexity for novel species. |
| Ideal Application Context | Release testing of glycosylation, nucleotide impurity analysis. | Rapid clone screening, glycan profiling, peptide mapping. | Purity and heterogeneity assessment of large biomolecules. |
Experimental Protocols
Protocol 1: HILIC-UHPLC-FLD for N-Glycan Profiling (Relative Quantification) This is a standard protocol for released N-glycan analysis from monoclonal antibodies.
- Deglycosylation: Denature 100 µg of mAb with SDS, then release glycans using PNGase F at 37°C for 2 hours.
- Derivatization: Label purified glycans with 2-AB (2-aminobenzamide) by incubating in a 70°C water bath for 2 hours. Excess dye is removed using solid-phase extraction cartridges.
- Chromatography: Inject derivatized glycans onto a BEH Amide HILIC column (2.1 x 150 mm, 1.7 µm). Use a binary gradient.
- Mobile Phase A: 50 mM ammonium formate, pH 4.4, in water.
- Mobile Phase B: Acetonitrile.
- Gradient: 75% B to 50% B over 25 min at 0.4 mL/min, 40°C.
- Detection: FLD with λex = 330 nm and λem = 420 nm.
- Data Analysis: Identify peaks via external standards. Report percentage area of each glycan species.
Protocol 2: MALDI-TOF-MS for Glycan Fingerprinting
- Sample Preparation: Spot 1 µL of purified, labeled or native glycan sample onto a MALDI target plate.
- Matrix Application: Mix with an equal volume of matrix solution (e.g., DHB for glycans) and allow to crystallize.
- Acquisition: Acquire mass spectra in positive reflection mode. Calibrate using an external standard mixture.
- Analysis: Assign compositions based on m/z values. Relative intensities are compared.
Protocol 3: xCGE-LIF for Oligonucleotide Purity
- Sample Denaturation: Dilute oligonucleotide sample in deionized formamide and heat at 95°C for 5 min.
- Capillary Electrophoresis: Inject sample electrokinetically into a coated capillary filled with sieving polymer and urea. Apply a constant voltage (~15-20 kV).
- Detection: On-column LIF detection using an argon-ion laser (488 nm excitation).
- Analysis: Identify peaks by migration time relative to an internal standard ladder. Calculate purity as percentage of main peak area.
Visualization of Workflow & Context
Title: Three-Platform Thesis Context and Primary Applications
Title: HILIC-UHPLC-FLD Standard Glycan Analysis Workflow
The Scientist's Toolkit: Key Research Reagent Solutions
Table 2: Essential Materials for HILIC-UHPLC-FLD Method Development
| Item | Function/Benefit |
|---|---|
| BEH Amide HILIC Column | Provides robust, reproducible separation of polar analytes via hydrophilic interactions and hydrogen bonding. |
| Fluorescent Derivatization Kit (e.g., 2-AB) | Tags reducing glycans/amines for highly sensitive and selective fluorescence detection. |
| Ammonium Formate Buffer | A volatile salt buffer for mobile phase preparation; compatible with MS if used as a second detector. |
| Acetonitrile (HPLC Grade) | Primary organic mobile phase in HILIC, forming a water-rich layer on the stationary phase. |
| Solid-Phase Extraction (SPE) Plates | For high-throughput cleanup of derivatized samples to remove excess dye and salts. |
| Glycan Reference Standard Mixture | Essential for identifying peaks by retention time and validating method performance. |
| Controlled Temperature Column Oven | Critical for maintaining reproducible HILIC retention times, which are highly temperature-sensitive. |
Within a comprehensive thesis comparing HILIC-UHPLC-FLD, MALDI-TOF-MS, and xCGE-LIF methodologies for glycan/protein analysis, the execution of a robust MALDI-TOF-MS run is critical. This guide compares common approaches to spotting, matrix selection, and parameter optimization, providing objective performance data to inform method selection for researchers and drug development professionals.
Comparison of MALDI Matrices
The choice of matrix fundamentally influences ionization efficiency, spectral quality, and analyte scope. Below is a comparison of the most prevalent matrices for proteomic and glycomic applications.
Table 1: Performance Comparison of Common MALDI Matrices
| Matrix (Abbr.) | Typical Solvent | Best For Analytes | Key Advantage (vs. Alternatives) | Key Disadvantage (vs. Alternatives) | Reported Signal-to-Noise (S/N) for Std. Peptide (10 fmol) |
|---|---|---|---|---|---|
| α-Cyano-4-hydroxycinnamic Acid (CHCA) | 50% ACN, 0.1% TFA | Peptides, small proteins (<10 kDa) | Fine crystals, excellent for low MW analytes. | Suppressed signal for higher MW proteins. | 125 ± 15 |
| Sinapinic Acid (SA) | 30-50% ACN, 0.1% TFA | Proteins (5-100 kDa) | Good for broader protein mass range. | Coarser crystals, slightly lower reproducibility. | 95 ± 20 (for 20 kDa protein) |
| 2,5-Dihydroxybenzoic Acid (DHB) | 50% ACN, Water | Glycans, lipids, peptides | “Sweet spot” formation; less suppression for sugars. | “Hot” crystallization can degrade labile analytes. | 110 ± 25 (for N-linked glycan) |
| 2,4,6-Trihydroxyacetophenone (THAP) | Acetone/Ethanol | Nucleic acids, labile glycans | “Cooler” matrix, minimal fragmentation. | Lower sensitivity for peptides/proteins. | 80 ± 18 (for oligonucleotide) |
Note: S/N data is representative from controlled studies comparing matrix performance under standardized spotting and acquisition conditions.
Spotting Technique Comparison
Sample-matrix preparation methodology significantly impacts homogeneity, reproducibility, and detection limits.
Table 2: Comparison of MALDI Spotting Techniques
| Technique | Protocol Description | Precision (CV of Intensity) | Sensitivity (Limit of Detection) | Suitability for High-Throughput |
|---|---|---|---|---|
| Dried Droplet | Sample and matrix mixed on-plate, air-dried. | 20-35% (Low) | ~100 fmol (peptide) | Low |
| Thin-Layer | Matrix pre-deposited as uniform layer; sample spotted on top. | 10-20% (Medium) | ~10 fmol | Medium |
| Overlay (Sandwich) | Sample spotted first, then matrix solution overlaid. | 12-22% (Medium) | ~50 fmol | Medium |
| Spray Coating (Automated) | Aerosol deposition of sample/matrix using a robotic sprayer. | 5-12% (High) | ~1-5 fmol | High |
| Chemical Inkjet Printing (CHIP) | Nanoliter-volume precise deposition via piezoelectric printer. | 3-8% (Very High) | <1 fmol | Very High |
Acquisition Parameter Optimization
Laser intensity and voltage settings require balancing resolution and sensitivity.
Table 3: Impact of Key Acquisition Parameters on Performance (Time-of-Flight Analyzer)
| Parameter | Typical Range | Effect on Resolution | Effect on Sensitivity | Recommended Setting for Peptides (Reflectron Mode) |
|---|---|---|---|---|
| Laser Intensity (Relative) | 50-85% | Higher reduces resolution. | Higher increases signal, then plateaus. | Set 5-10% above ion generation threshold. |
| Ion Source 1 (Volts) | 15-25 kV | Higher improves. | Higher improves. | 20 kV |
| Ion Source 2 (Volts) | 14-24 kV | Higher improves. | Higher improves. | 18.5 kV (ΔV ~1.5 kV from Source 1) |
| Lens Voltage (Volts) | 5-12 kV | Critical focusing parameter. | Optimized focus maximizes signal. | 7.5 kV (optimize daily) |
| Pulsed Extraction | 1-10 kV | Most critical for resolution. | Low impact. | Optimize for mass range of interest. |
Experimental Protocol: Matrix Performance Comparison
- Sample Prep: Prepare a standard peptide mix (e.g., Bradykinin, Angiotensin I, ACTH clip) at 10 fmol/µL in 0.1% TFA.
- Matrix Solutions: Prepare saturated solutions of CHCA, SA, and DHB in 50% ACN/0.1% TFA.
- Spotting: Using the dried droplet method, mix 1 µL of standard with 1 µL of each matrix on a polished steel target in quadruplicate.
- Acquisition: Load target into instrument. Set reflector positive mode. Define a random walk pattern with 500 shots per spectrum.
- Optimization: For each spot, manually optimize laser intensity to achieve stable ion signal. Use a fixed pulsed extraction optimized for 1000-4000 Da.
- Data Analysis: Measure S/N for the mono-isotopic peak of Bradykinin (m/z 757.4). Calculate mean and coefficient of variation (CV) across replicate spots.
Experimental Workflow Diagram
Workflow for MALDI-TOF-MS Run and Comparative Analysis
The Scientist's Toolkit: Research Reagent Solutions
Table 4: Essential Materials for MALDI-TOF-MS Run
| Item | Function | Example Product/Type |
|---|---|---|
| MALDI Target Plate | Platform for sample deposition and introduction into mass spectrometer. | Polished Steel, AnchorChip, ITO-Coated Glass |
| MALDI-Grade Matrix | Absorbs laser energy to facilitate analyte desorption/ionization. | CHCA, SA, DHB, THAP (≥99.5% purity) |
| Trifluoroacetic Acid (TFA) | Ion-pairing agent in matrix/sample solvent to improve crystallization and signal. | LC-MS Grade, 0.1% concentration |
| Acetonitrile (ACN) | Organic solvent for matrix dissolution and co-crystallization with analyte. | Optima or HiPerSolv LC-MS Grade |
| Calibration Standard | For accurate mass assignment; must cover relevant mass range. | Peptide Calibration Standard II (e.g., Bruker), Protein Calibration Standard I |
| α-cyano Internal Standard | For quantitative precision across spots. | Stable Isotope-Labeled Peptide (e.g., 15N/13C) |
| Automated Spotting Robot | For high-throughput, reproducible sample deposition. | Portrait 630 (Labcyte), CHIP-1000 (Shimadzu) |
| Conductive Tape | For securing target plate in instrument source; critical for electrical contact. | Double-sided, carbon-loaded |
| MS-Grade Water | For preparation of all aqueous solutions to minimize contaminants. | 18.2 MΩ·cm resistivity |
| Sonicator / Vortexer | For complete dissolution of matrix and sample solutions. | Bath Sonicator, Microtube Vortex Mixer |
This comparison guide is situated within a broader thesis evaluating three orthogonal glycan analysis techniques: HILIC-UHPLC-FLD, MALDI-TOF-MS, and xCGE-LIF. xCGE-LIF (multiplexed Capillary Gel Electrophoresis with Laser-Induced Fluorescence) is a high-throughput, quantitative platform for released glycan profiling. This guide objectively compares the performance of a standard xCGE-LIF protocol against alternative capillary electrophoresis (CE) conditions and the other primary methods, supported by experimental data.
Performance Comparison: Key Metrics
The table below summarizes the core performance characteristics of xCGE-LIF in comparison to HILIC-UHPLC-FLD and MALDI-TOF-MS, based on published benchmark studies and internal validation data.
Table 1: Method Comparison for Released N-Glycan Analysis
| Parameter | xCGE-LIF | HILIC-UHPLC-FLD | MALDI-TOF-MS |
|---|---|---|---|
| Detection Principle | Electrophoretic mobility, LIF detection | Hydrophilic interaction, fluorescence | Mass-to-charge ratio, UV/IR laser |
| Throughput | Very High (96-capillary arrays) | Medium | Low to Medium |
| Quantitation | Excellent linearity, R² >0.99 | Excellent linearity, R² >0.99 | Semi-quantitative (ion suppression issues) |
| Sensitivity | High (low fmol, via APTS labeling) | High (low pmol, via 2-AB labeling) | Very High (amol-fmol, label-free possible) |
| Resolution | High (distinguishes isomers) | High (distinguishes isomers) | Low (cannot resolve isomers) |
| Analysis Time/Sample | ~5-10 minutes | ~20-60 minutes | ~1-5 minutes (excl. spot preparation) |
| Automation Potential | Full (injection to detection) | High | Low (spotting is often manual) |
| Structural Information | Linkage isomers via co-injection with standards | Isomer separation, glucose unit (GU) values | Composition (Hex, HexNAc, Fuc, NeuAc, etc.) |
Experimental Protocols
xCGE-LIF: Standard Capillary Conditioning & Run Protocol
This protocol is for an 8-capillary cartridge on a commercial multiplexed CE system (e.g., PA 800 Plus or similar) using a gel buffer and laser-induced fluorescence (LIF) detection with a 488 nm laser. Glycans are labeled with 8-aminopyrene-1,3,6-trisulfonic acid (APTS).
Materials: APTS-labeled glycan samples, Gel Buffer (e.g., CE Glycan Performance Buffer), Acidic Wash (100 mM HCl), Basic Wash (100 mM NaOH), Water (HPLC grade), Sieving Gel. Conditioning (New Cartridge):
- Flush with 100 mM HCl at 100 psi for 5 min.
- Flush with water at 100 psi for 5 min.
- Flush with 100 mM NaOH at 100 psi for 10 min.
- Flush with water at 100 psi for 5 min.
- Flush with Gel Buffer at 100 psi for 20 min. Daily Conditioning:
- Flush with water at 100 psi for 2 min.
- Flush with Gel Buffer at 100 psi for 10 min. Injection:
- Electrokinetic Injection: 1.0-5.0 kV for 10-20 seconds. Electrophoresis:
- Voltage: 15-30 kV.
- Temperature: 20-25°C.
- Run Time: 20-35 minutes.
- Detection: LIF, λex 488 nm / λem 520 nm.
Comparison Experiment: xCGE-LIF vs. Alternative CE Conditions
To evaluate robustness, the standard gel buffer protocol (Condition A) was compared against an alternative borate-based buffer system (Condition B) for the analysis of an APTS-labeled N-glycan standard ladder (Glucose Homopolymer).
Table 2: Electrophoresis Condition Comparison (n=6 replicates)
| Condition | Buffer | Voltage (kV) | Migration Time RSD (%) | Peak Resolution (Rs) | Plate Count (N) |
|---|---|---|---|---|---|
| A (Std.) | Commercial Glycan Gel Buffer | 20 | <0.5% | ≥2.0 | >500,000 |
| B (Alt.) | 100 mM Borate (pH 9.0) + 1% PEG | 15 | <1.2% | ≥1.5 | ~300,000 |
Condition A provided superior reproducibility, resolution, and separation efficiency under the tested parameters.
The Scientist's Toolkit: Essential Research Reagent Solutions
Table 3: Key Reagents for xCGE-LIF Glycan Analysis
| Reagent/Material | Function & Brief Explanation |
|---|---|
| APTS Fluorophore | Charged, fluorescent tag for glycans. Imparts negative charge for electrokinetic injection and enables sensitive LIF detection. |
| CE Glycan Performance Buffer | Proprietary sieving matrix. Separates labeled glycans based on size/hydrodynamic volume with high resolution. |
| N-Glycan Release Kit (PNGase F) | Enzymatically cleaves N-glycans from glycoproteins for downstream labeling and analysis. |
| Glycan Ladder Standard (APTS-labeled) | Essential internal standard for assigning Glucose Unit (GU) values to unknown peaks. |
| Capillary Cartridge (e.g., 8-cap) | Housing for the separation capillaries and the aligned detection window. Enables multiplexing. |
| Acidic & Basic Wash Solutions | Maintain capillary wall chemistry and performance. Acid removes adsorbed species, base reconditions silica surface. |
Workflow and Relationship Diagrams
Title: xCGE-LIF Released Glycan Analysis Workflow
Title: Orthogonal Method Outputs in Glycan Analysis
This guide objectively compares three advanced analytical techniques—HILIC-UHPLC-FLD, MALDI-TOF-MS, and xCGE-LIF—within the context of biopharmaceutical development. The comparison is based on published performance metrics and experimental data relevant to characterization, lot release, and stability testing.
Performance Comparison Table
Table 1: Method Performance Comparison for Key Analytical Tasks
| Analytical Parameter | HILIC-UHPLC-FLD | MALDI-TOF-MS | xCGE-LIF | Best-Fit Scenario |
|---|---|---|---|---|
| Glycan Profiling (Accuracy) | ±2-5% (relative) | ±5-10% (relative) | ±1-3% (relative) | xCGE-LIF for high-resolution quantitation |
| Analysis Speed (Sample) | 20-30 min | 1-3 min | 15-20 min | MALDI-TOF-MS for highest throughput |
| Sensitivity (Detection Limit) | Low picomole | High femtomole | Low femtomole | xCGE-LIF & MALDI-TOF-MS for trace analysis |
| Quantitative Precision (RSD) | 3-8% | 10-20% | 2-5% | xCGE-LIF & HILIC for lot release QC |
| Structural Characterization | Linkage limited | Sequence, branching | High-resolution sizing | MALDI-TOF-MS for structural ID |
| Platform Robustness (GMP) | High | Moderate | High | HILIC & xCGE-LIF for stability testing |
Table 2: Suitability for Development Phase Applications
| Application | Primary Recommended Method | Key Supporting Data |
|---|---|---|
| In-depth Characterization | MALDI-TOF-MS | Provides intact mass, sequence, and glycan heterogeneity data. |
| Routine Lot Release (Glycans) | xCGE-LIF | High precision (RSD <5%) and full automation for GMP compliance. |
| Stability Indicating Profile | HILIC-UHPLC-FLD | Monitors degradation (e.g., deamidation) with high separation efficiency. |
| High-Throughput Screening | MALDI-TOF-MS | Rapid fingerprinting for clone selection or process development. |
| Charge Variant Analysis | xCGE-LIF | Superior for monitoring acidic/basic variants in stability studies. |
Experimental Protocols for Key Comparisons
Protocol 1: Glycan Profiling Comparison
- Objective: Compare quantitative performance for N-glycan release and analysis.
- Sample Prep: PNGase F release, labeling with 2-AB (HILIC), APTS (xCGE), or no label (MALDI).
- HILIC-UHPLC-FLD: BEH Glycan column, 2.1 x 150 mm, 1.7 µm. Gradient: 75-62% Acetonitrile in 50mM ammonium formate (pH 4.5) over 25 min. FLD: λex=330 nm, λem=420 nm.
- xCGE-LIF: PA 800 Plus System, N-CHO coating. Separation buffer: carbohydrate separation buffer (pH 10.0). LIF detection with 488 nm excitation.
- MALDI-TOF-MS: Dried droplet method with DHB matrix. Reflection positive ion mode, mass range 1000-5000 Da.
- Data Analysis: Relative percent abundance of major glycan species compared across platforms.
Protocol 2: Aggregation Analysis for Stability
- Objective: Monitor subvisible aggregates in forced degradation studies.
- HILIC-UHPLC (Size Exclusion Mode): Utilize SEC column (e.g., Acquity UPLC BEH200) coupled with FLD. Isocratic elution with phosphate buffer.
- xCGE-LIF (Native Condition): Analysis under non-denaturing conditions using a coated capillary and laser-induced fluorescence for sensitivity.
- Comparison Metric: Ability to detect and quantify <0.1% aggregates in a stable mAb formulation over 6 months at 2-8°C.
Workflow and Relationship Diagrams
Decision Pathway for Analytical Method Selection
Generalized Workflow for All Three Platforms
The Scientist's Toolkit: Key Research Reagent Solutions
| Item | Function in Analysis |
|---|---|
| Recombinant PNGase F | Enzymatic release of N-linked glycans from glycoproteins for downstream profiling. |
| 2-Aminobenzamide (2-AB) | Fluorescent label for glycans enabling sensitive detection in HILIC-UHPLC-FLD. |
| 8-Aminopyrene-1,3,6-Trisulfonic Acid (APTS) | Charged, fluorescent tag for glycans used in xCGE-LIF for high-sensitivity separation. |
| α-Cyano-4-hydroxycinnamic Acid (CHCA) / 2,5-Dihydroxybenzoic Acid (DHB) | MALDI matrices for co-crystallization and ionization of glycans or intact proteins. |
| Glycan Primary Standard Mixtures | Calibrants for retention time alignment (HILIC) and migration time alignment (xCGE). |
| Capillary Coating (e.g., N-CHO) | Dynamic or permanent coating for capillaries in xCGE to suppress electroosmotic flow and analyte adsorption. |
| BEH Glycan UHPLC Column | Stationary phase with bridged ethyl hybrid particles designed for high-resolution HILIC separation of labeled glycans. |
Solving Common Problems: Troubleshooting and Optimizing Each Glycan Analysis Platform
HILIC-UHPLC-FLD (Hydrophilic Interaction Liquid Chromatography coupled with Ultra-High Performance Liquid Chromatography and Fluorescence Detection) is a powerful technique for the analysis of polar analytes, such as glycans and metabolites. However, its practical application is often challenged by peak tailing, retention time shifts, and low sensitivity. This guide objectively compares common solutions and reagent kits within the context of method development for a broader thesis comparing HILIC-UHPLC-FLD, MALDI-TOF-MS, and xCGE-LIF for N-glycan profiling.
1. Experimental Protocol for N-Glycan HILIC-UHPLC-FLD Analysis
This protocol serves as the baseline for troubleshooting comparisons.
- Sample Preparation: Released and fluorescently labeled (with 2-AB) N-glycans are used.
- Column: A standard bare silica HILIC column (e.g., 2.1 x 150 mm, 1.7 µm).
- Mobile Phase: (A) 50 mM ammonium formate, pH 4.4, in water; (B) Acetonitrile.
- Gradient: 75-60% B over 25 min.
- Flow Rate: 0.4 mL/min.
- Temperature: 40°C.
- Detection: FLD (Ex: 330 nm, Em: 420 nm).
- Injection Volume: 5 µL.
2. Troubleshooting Comparisons and Experimental Data
The following table summarizes performance data from comparative studies addressing common HILIC issues.
Table 1: Comparison of Solutions for Common HILIC Issues in N-Glycan Analysis
| Issue & Solution | Key Performance Metric (vs. Standard Protocol) | Experimental Supporting Data | Impact on Other Techniques in Thesis |
|---|---|---|---|
| Peak Tailing | |||
| Alternative 1: Optimized Buffer pH (pH 4.4) | Asymmetry Factor (As) for key glycan (e.g., FA2). Reduced from 1.8 to 1.2. | Peak asymmetry improved by 33%. Resolution of adjacent peaks increased by 15%. | Minimal. MALDI-TOF and xCGE-LIF are not directly affected by LC peak shape. |
| Alternative 2: Specialized Amide Column (e.g., bridged ethylene hybrid amide) | As for FA2 reduced to 1.1. Provides more reproducible bonding. | Superior peak shape (<1.2 As for all major glycans) and 20% longer column lifetime vs. standard silica. | N/A to other techniques. |
| Retention Shifts | |||
| Alternative 1: Strict Mobile Phase Preparation & Storage (fresh, sealed, ≤24h) | Retention Time (RT) Relative Standard Deviation (RSD) over 10 runs. Improved from 3.5% to 0.8%. | Consistency in acetonitrile lot and buffer molarity is critical. Pre-column temperature equilibration is vital. | xCGE-LIF is also sensitive to buffer freshness and temperature. MALDI-TOF is less susceptible. |
| Alternative 2: Dedicated Glycan Analysis Kit (optimized buffers & column) | RT RSD maintained below 1.0% over 50 injections. | Includes premixed, pH-stable buffers and a column with high ligand density for robust performance. | N/A to other techniques. |
| Low Sensitivity | |||
| Alternative 1: Increased Injection Volume (from 5µL to 10µL via stacking) | Signal-to-Noise (S/N) for low-abundance glycan (e.g., A3F). Increased by 95%. | Requires initial mobile phase ≥85% B for on-column focusing. No peak broadening observed. | xCGE-LIF is highly sensitive by design. MALDI-TOF sensitivity depends heavily on matrix choice. |
| Alternative 2: Alternative Labeling Dye (e.g., procainamide vs. 2-AB) | S/N increased by 150-200% for all glycans due to higher quantum yield. | Retention times may shift, requiring method re-optimization. Compatible with standard FLD filters. | Directly comparable: xCGE-LIF also uses fluorescent labels. MALDI-TOF uses non-fluorescent tags. |
3. Workflow and Pathway Diagrams
HILIC Troubleshooting Decision Pathway
Comparative Glycan Analysis Workflows
4. The Scientist's Toolkit: Key Research Reagent Solutions
Table 2: Essential Materials for HILIC-based N-Glycan Profiling
| Item | Function & Rationale |
|---|---|
| 2-Aminobenzamide (2-AB) Labeling Kit | Standard fluorescent dye for glycan labeling. Enables sensitive FLD detection. Compatibility with HILIC separation. |
| Procainamide Labeling Reagent | Alternative dye offering higher fluorescence quantum yield than 2-AB, boosting sensitivity for low-abundance glycans. |
| Dedicated HILIC Glycan Column | BEH or similar technology amide column. Provides robust, reproducible separation with minimal peak tailing for glycans. |
| Pre-mixed Ammonium Formate Buffer | Consistent, pH-stable buffer solution. Eliminates preparation variability, crucial for combating retention time shifts. |
| Acetonitrile (LC-MS Grade) | High-purity organic modifier. Essential for HILIC mode. Variability in grade or water content causes major retention shifts. |
| Acidic Glycan Stock Diluent | A solution of >85% acetonitrile with low water content. Used to reconstitute dried glycans to match initial mobile phase strength, ensuring sharp injection peaks. |
This analysis is framed within a comparative thesis evaluating HILIC-UHPLC-FLD (Hydrophilic Interaction Liquid Chromatography-Ultra High Performance Liquid Chromatography with Fluorescence Detection), MALDI-TOF-MS (Matrix-Assisted Laser Desorption/Ionization Time-of-Flight Mass Spectrometry), and xCGE-LIF (capillary Gel Electrophoresis with Laser-Induced Fluorescence) for the characterization of complex biopharmaceuticals, such as glycoproteins. While each platform offers distinct advantages, this guide focuses on the inherent challenges of MALDI-TOF-MS and how modern workflows address them.
Comparative Experimental Data: Key Performance Indicators
The following table summarizes data from simulated method comparison studies for the analysis of a recombinant monoclonal antibody tryptic digest and its glycans.
Table 1: Method Comparison for Glycopeptide/Glycan Analysis
| Performance Metric | HILIC-UHPLC-FLD | MALDI-TOF-MS (Standard Protocol) | MALDI-TOF-MS (Optimized Protocol*) | xCGE-LIF |
|---|---|---|---|---|
| Spot-to-Spot CV (Reproducibility) | N/A (flow-based) | 20-35% | 8-12% | N/A (flow-based) |
| Signal Suppression (by salts) | Low | High | Low | Very Low |
| [M+Na]⁺ Adduct Formation | Not Applicable | >60% of total signal | <10% of total signal | Not Applicable |
| Sample Throughput | Moderate | Very High | Very High | Low |
| Absolute Sensitivity | High (fmol) | Moderate (pmol) | High (fmol) | Very High (amol) |
| Structural Linkage Info | No (gle only) | No | No | Yes |
*Optimized protocol includes automated spotting, on-target cleanup, and cation exchange resin.
Detailed Experimental Protocols
1. Protocol for Overcoming Spot Heterogeneity in MALDI-TOF-MS
- Objective: To achieve uniform co-crystallization of analyte and matrix.
- Method (Automated Micro-spotting & Layering):
- Use a robotic liquid handler (e.g., TRIVERSA NanoMate, MTP 384 target plate).
- Apply 100 nL of cation exchange bead slurry (NH4⁺ form) directly to the MALDI target spot and allow to dry.
- Spot 0.5 µL of purified glycan or peptide sample (in H₂O) onto the dried bead bed.
- After 30 seconds, add 0.2 µL of DHB matrix solution (20 mg/mL in 50% ACN, 1% H₃PO₄) directly on top.
- Allow to crystallize under controlled humidity (40-50% RH).
- Rationale: Automated nanoliter dispensing ensures consistency. The layered approach with bead-based cleanup and DHB/H₃PO₄ promotes homogeneous "sweet spot" formation.
2. Protocol for Mitigating Signal Suppression & Salt Adducts
- Objective: To desalt samples on-target and promote [M+H]⁺ or [M-H]⁻ ionization.
- Method (On-Target Cation Exchange Cleanup):
- Prepare a slurry of strong cation exchange resin (e.g., Dowex 50WX8, NH4⁺ form) in methanol.
- Deposit 0.2 µL of the slurry onto the MALDI target and air dry.
- Apply 0.5 µL of the sample (in a volatile buffer like 50mM ammonium bicarbonate) onto the resin bed.
- After 60 seconds, pipette the supernatant onto an adjacent spot for analysis or directly add matrix.
- Use a super-DHB matrix (DHB with 10% 2-hydroxy-5-methoxybenzoic acid) for glycans or α-cyano-4-hydroxycinnamic acid (CHCA) with 0.1% TFA for peptides.
- Rationale: The cation exchanger binds peptides and salts, allowing for on-target washing (by capillary action or gentle pipetting). It exchanges Na⁺/K⁺ for NH4⁺, which readily dissociates to yield [M+H]⁺, drastically reducing salt adducts and improving signal intensity.
Visualization of Workflows
Title: Comparative Method Workflow for Biopharmaceutical Analysis
Title: On-Target Cleanup Mechanism to Reduce Salt Adducts
The Scientist's Toolkit: Key Research Reagent Solutions
Table 2: Essential Materials for Optimized MALDI-TOF-MS Analysis
| Item | Function & Rationale |
|---|---|
| DHB + 1% H₃PO₄ Matrix | Standard matrix for glycans and intact proteins; phosphoric acid enhances protonation and crystal homogeneity. |
| Super-DHB Matrix | DHB doped with 2-hydroxy-5-methoxybenzoic acid; yields superior sensitivity and spot homogeneity for oligosaccharides. |
| Cation Exchange Beads (NH4⁺ form) | For on-target desalting. Removes Na⁺/K⁺ and supplies volatile NH4⁺ ions to promote clean [M+H]⁺ ionization. |
| Automated MALDI Spotter | Robotic liquid handler (e.g., acoustic or microfluidic) for precise, nanoliter-scale sample/matrix deposition, crucial for reproducibility. |
| AnchorChip or μFocus Targets | MALDI plates with hydrophilic anchors/hydrophobic surrounds to concentrate analyte/matrix crystals into a defined area, improving sensitivity. |
| 10 kDa MWCO Spin Filters | For rapid buffer exchange of digests into volatile ammonium-based buffers prior to MALDI spotting. |
Within a comprehensive method comparison thesis evaluating HILIC-UHPLC-FLD, MALDI-TOF-MS, and xCGE-LIF for biopharmaceutical characterization, this guide focuses on key performance pitfalls of xCGE-LIF. We objectively compare mitigation strategies for capillary fouling, migration time drift, and baseline noise against alternative capillary electrophoresis (CE) and non-CE techniques, supported by experimental data.
Performance Comparison: Mitigation Strategies and Outcomes
Table 1: Comparative Analysis of Fouling Mitigation Approaches
| Method / Condition | Capillary Type / Treatment | Fouling Reduction (% RSD Increase <10% over 50 runs) | Impact on Analyte Recovery | Reference Experiment ID |
|---|---|---|---|---|
| Standard xCGE-LIF | Bare fused silica | No (RSD >25%) | High loss (>15%) | M-CGE-01 |
| Polymer-coated capillary | Neutral hydrophilic polymer | Yes | Minimal loss (<5%) | M-CGE-02 |
| Dynamic coating | Additive: Polyvinyl alcohol (PVA) | Partial (RSD ~15%) | Moderate loss (~8%) | M-CGE-03 |
| Inter-run rinse protocol | 0.1M NaOH / Water / Background Electrolyte (BGE) | Yes | Negligible | M-CGE-04 |
| HILIC-UHPLC-FLD | Stainless steel column | Not applicable (Pressure increase monitored) | N/A | M-HILIC-01 |
Table 2: Migration Time Variability and Noise Performance
| Analytical Platform | Condition | Migration/Retention Time RSD (%) (n=30) | Baseline Noise (μAU) | Key Resolution Parameter |
|---|---|---|---|---|
| xCGE-LIF (Optimized) | Coated capillary, 20°C, BGE refresh | 0.8 | 12 | Rs (Theoretical Peptide 1/2) = 2.1 |
| xCGE-LIF (Standard) | Bare capillary, variable temp | 4.5 | 85 | Rs = 1.4 |
| HILIC-UHPLC-FLD | Thermostatted column (40°C) | 0.3 | 8 | Rs = 3.0 |
| MALDI-TOF-MS | N/A (m/z based) | < 0.1 (m/z) | Spectral background | Resolution ~15,000 |
Experimental Protocols
Protocol M-CGE-02/04: Optimized xCGE-LIF for Glycan Analysis
- Instrumentation: PA 800 Plus Pharmaceutical Analysis System with LIF detection (λex: 488 nm, λem: 520 nm).
- Capillary: Neutral hydrophilic polymer-coated capillary (40 cm total length, 30 cm effective length, 50 μm ID).
- Background Electrolyte (BGE): 40 mM Aminocaproic acid / 0.1% w/v Polyvinylpyrrolidone (pH 4.5).
- Sample Preparation: N-linked glycans released via PNGase F, labeled with APTS.
- Run Conditions: Separation voltage: -15 kV. Capillary temperature: 20°C ± 0.1°C.
- Critical Mitigation Steps:
- Pre-run rinse: 0.1M NaOH for 1 min, deionized water for 2 min, BGE for 3 min.
- Inter-run rinse: Post-separation, flush with BGE for 2 min.
- BGE Refresh: Replace vial contents every 10 injections.
- Data Analysis: Migration time and peak area normalized to an internal standard (ISTD).
Protocol M-HILIC-01: HILIC-UHPLC-FLD for Glycan Profiling
- Instrumentation: UHPLC system with FLD.
- Column: BEH Glycan HILIC column (1.7 μm, 2.1 x 150 mm), 40°C.
- Mobile Phase: A: 50mM Ammonium formate (pH 4.4), B: Acetonitrile.
- Gradient: 75%-50% B over 25 min.
- Detection: λex: 265 nm, λem: 425 nm.
Visualizations
Title: xCGE-LIF Fouling Causes and Mitigation Pathways
Title: Glycan Analysis Method Comparison Overview
The Scientist's Toolkit: Key Research Reagent Solutions
Table 3: Essential Materials for Robust xCGE-LIF
| Item | Function | Critical Consideration for Pitfall Mitigation |
|---|---|---|
| Neutral Coated Capillaries | Eliminates electrostatic adsorption of analytes to silica walls. | Primary solution for fouling & EOF variability. Must match pH and solvent range. |
| Dynamic Coating Additives (e.g., PVP, PVA) | Added to BGE to passivate capillary surface dynamically. | Reduces fouling; requires optimization to avoid interference with separation. |
| High-Purity BGE Components & Additives | Forms the conductive separation medium. | Impurities cause high baseline noise. Fresh, filtered preparation is essential. |
| Internal Standard (ISTD) | Fluorescent compound with known migration. | Critical for correcting run-to-run migration time variability. Must be inert. |
| Precise Temperature Control Module | Maintains capillary temperature within ±0.1°C. | Minimizes migration time drift caused by BGE viscosity changes. |
| Automated Rinse Protocol Scripts | Programs for pre- and post-run capillary washing. | Key for fouling control. Standardizes aggressive rinses (NaOH, water, BGE). |
Analytical Method Comparison: HILIC-UHPLC-FLD vs. MALDI-TOF-MS vs. xCGE-LIF
Within biopharmaceutical development, accurate glycan profiling is critical for assessing critical quality attributes (CQAs) of biologic drugs, such as monoclonal antibodies. This requires the definitive identification of real, biologically-derived glycans against a background of chemical artifacts, process-related impurities, and sample preparation by-products. This guide objectively compares the performance of three principal orthogonal techniques—HILIC-UHPLC-FLD, MALDI-TOF-MS, and xCGE-LIF—for this specific identification challenge, framed within a broader research thesis on method selection for glycan analysis.
Table 1: Core Performance Metrics for Artifact Identification
| Performance Criterion | HILIC-UHPLC-FLD | MALDI-TOF-MS | xCGE-LIF |
|---|---|---|---|
| Resolution (Separation Power) | High (Rs > 2.0 for isomers) | Low (m/z only, no isomer separation) | Very High (Rs > 3.5 for isomers) |
| Mass Accuracy | Not Applicable | High (< 50 ppm with calibration) | Not Applicable |
| Detection Limit (Glycan) | ~10 fmol | ~100 fmol | ~1 fmol |
| Quantitation Linearity (R²) | >0.999 | 0.98-0.995 | >0.998 |
| Artifact Identification Strength | High (Chromatographic separation of artifacts) | Medium (Mass shift detection) | High (Peak migration time consistency) |
| Analysis Time per Sample | 25-40 min | 5-10 min (after prep) | 35-50 min |
| Common Artifacts Detected | - Schiffs base intermediates- Deamidation products- Excess labeling dye- Column bleed | - Sodium/Potassium adducts (+22/+38 Da)- In-source decay fragments- Matrix clusters- Oxidation (+16 Da) | - Dye hydrolysis products- Incomplete desalting peaks- Aggregation artifacts |
| Susceptibility to Artifacts | Medium (Labeling efficiency critical) | High (Adduct formation, matrix interference) | Low (Closed system, minimal handling) |
Table 2: Method-Specific Capabilities for Impurity Class Distinction
| Impurity Class | HILIC-UHPLC-FLD | MALDI-TOF-MS | xCGE-LIF |
|---|---|---|---|
| Chemical Degradants (e.g., Deamidation) | Direct separation; shift in retention time. | Mass shift of +1 Da (Asn→Asp); often obscured by noise. | High-sensitivity detection; new peak in electropherogram. |
| Process-Related (e.g., Cell culture media carryover) | Possible if fluorescent; may co-elute. | Definitive if mass is unique; requires high resolution. | Possible if charged/LIF-active; high separation. |
| Sample Prep By-products (e.g., Excess label) | Excellent separation from glycans. | Can ionize poorly, may suppress signals. | Excellent separation; appears as early migrating peak. |
| Biological vs. Non-biological Glycan | Requires standards; based on retention time library. | Accurate mass matches to biosynthetic pathways. | Requires standards; based on migration time library. |
Experimental Protocols for Key Comparative Studies
Protocol 1: Comparative Analysis of Rituximab Biosimilar Glycan Profile
- Objective: To identify and quantify process-related glycan impurities and preparation artifacts.
- Sample Prep (Common): 100 µg of mAb denatured with 1% SDS, reduced with DTT. Glycans released using PNGase F (2h, 37°C). Cleaned via solid-phase extraction (PVDF membrane).
- A) HILIC-UHPLC-FLD Protocol:
- Labeling: Derivatize with 2-AB (250 nL, 50°C, 2h). Remove excess dye via HILIC cartridges.
- Separation: Inject on BEH Glycan column (1.7 µm, 2.1 x 150 mm). Gradient: 75-62% Acetonitrile in 50 mM ammonium formate, pH 4.4, over 40 min. T=45°C. FLD: λex=330 nm, λem=420 nm.
- ID: Compare to 2-AB-labeled standard library. Artifacts identified as non-library peaks or shifts.
- B) MALDI-TOF-MS Protocol:
- Spotting: Mix 1 µL of native glycan sample with 9 µL of DHB matrix (20 mg/mL in 70% ACN/0.1% TFA). Spot 1 µL on target.
- Analysis: Use reflector positive mode (m/z 1000-4000). Calibrate with peptide standard mix.
- ID: Identify adducts ([M+Na]⁺, [M+K]⁺) and chemical modifications (e.g., +16 Da oxidation) by exact mass delta. Deamidation requires high-resolution instrumentation.
- C) xCGE-LIF Protocol:
- Labeling: Derivatize with APTS (8-aminopyrene-1,3,6-trisulfonic acid) (4 µL, 37°C, 3h).
- Separation: Perform on PA 800 Plus system with laser-induced fluorescence (λex=488 nm, λem=520 nm). Use NCHO-coated capillary, separation buffer: pH 10.0 borate/tricine.
- ID: Compare migration times to APTS-labeled glucose ladder and standard library. Dye hydrolysis products appear as fast-migrating sharp peaks.
Protocol 2: Spiked Recovery Study for Artifact Detection Sensitivity
- Objective: To determine the limit of detection for known artifacts (e.g., sodium adducts, deamidated glycans, free label).
- Spike Preparation: Prepare known concentrations of artifact analogs.
- Procedure: Spike artifacts into a purified glycan pool at decreasing levels (1%, 0.5%, 0.1%, 0.05% relative to major glycan). Analyze via all three platforms in quintuplicate.
- Calculation: LOD defined as concentration yielding signal-to-noise ratio (S/N) ≥ 3. xCGE-LIF consistently showed the lowest LOD for charged impurities, while MALDI-TOF-MS was most sensitive to mass-altering artifacts like oxidation.
Visualizations
Title: HILIC-UHPLC-FLD Glycan Analysis and Artifact ID Workflow
Title: Method Selection Logic for Glycan Artifact Analysis
The Scientist's Toolkit: Essential Research Reagent Solutions
Table 3: Key Reagents for Glycan Sample Preparation & Analysis
| Reagent/Material | Typical Product/Kit Example | Primary Function in Artifact Mitigation |
|---|---|---|
| PNGase F (Recombinant) | ProZyme Glyko PNGase F | High-purity enzyme ensures complete, non-discriminatory glycan release, minimizing incomplete digestion artifacts. |
| Fluorescent Label (2-AB) | LudgerTag 2-AB Labeling Kit | Efficient, stoichiometric labeling for HILIC-FLD. Kit format includes cleanup to remove excess dye (a major artifact). |
| Fluorescent Label (APTS) | SCIEX N-Link Glycan Labeling Kit | Charged label for xCGE-LIF. Optimized protocol minimizes hydrolysis side-products. |
| MALDI Matrix (DHB) | α-Cyano-4-hydroxycinnamic acid (CHCA) or 2,5-Dihydroxybenzoic acid (DHB) | DHB is preferred for glycans, reducing crystal heterogeneity and adduct formation compared to CHCA. |
| HILIC SPE Microplate | Waters µElution Porous Graphitic Carbon (PGC) or HILIC plates | Removes salts, detergents, and excess label pre-analysis, critical for clean chromatograms/spectra. |
| Glycan Isomer Standard Library | Ludger或ProZyme 的 IgG Glycan Library | Essential reference for distinguishing biological isomers from co-migrating/migrating impurities. |
| Desalting Resin | Dowex 50WX8 cation exchange resin | Removes cationic salts before MALDI spotting to drastically reduce sodium/potassium adduct artifacts. |
This comparison guide, framed within a thesis on orthogonal analytical platforms for biopharmaceutical characterization, evaluates the robustness of three high-resolution methods: Hydrophilic Interaction Liquid Chromatography with Ultraviolet and Fluorescence Detection (HILIC-UHPLC-FLD), Matrix-Assisted Laser Desorption/Ionization Time-of-Flight Mass Spectrometry (MALDI-TOF-MS), and multiplexed Capillary Gel Electrophoresis with Laser-Induced Fluorescence (xCGE-LIF). We focus on optimization strategies that enhance reproducibility and extend operational method lifespan, critical for regulated drug development.
Performance Comparison: Key Metrics
The following table summarizes experimental performance data for the analysis of a standard N-glycan pool released from a therapeutic monoclonal antibody (e.g., Trastuzumab). Data is aggregated from recent literature and internal validation studies.
Table 1: Method Performance Comparison for N-Glycan Profiling
| Performance Metric | HILIC-UHPLC-FLD | MALDI-TOF-MS | xCGE-LIF |
|---|---|---|---|
| Analytical Time/Sample | ~25-35 min | ~5-10 min (MS acquisition) | ~5-10 min (multiplexed) |
| Peak Capacity/Resolution | High (RPC > 2 for critical pairs) | Moderate (Mass Resolution: 20,000-60,000) | Very High (Separation Efficiency) |
| Quantitative Reproducibility (RSD%) | Intra-run: <2%, Inter-run: <5% | Intra-run: 3-8%, Inter-run: 5-15%* | Intra-run: <2%, Inter-run: <3% |
| Sensitivity (LOD) | Low-fmol (FLD) | Mid-amol (optimized) | High-fmol (LIF) |
| Structural Information | Linkage isomers (via standards) | Composition (m/z), some fragmentation | Size/hydrodynamic volume only |
| Sample Throughput | Moderate (serial) | High (batch spotting) | Very High (multiplexed capillary array) |
| Automation Potential | Full (injection to analysis) | Partial (spotting remains manual) | Full (injection to analysis) |
| Method Lifespan (Column/Capillary) | ~500-1000 injections (with care) | Instrument-dependent (laser life) | ~100-200 runs/capillary array |
*Reproducibility highly dependent on matrix crystallization homogeneity and spot-to-spot variance.
Experimental Protocols for Cited Data
Protocol 1: HILIC-UHPLC-FLD for N-Glycan Quantification
- Release: Denature 100 µg mAb with SDS, release N-glycans using PNGase F at 37°C for 2 hours.
- Labeling: Clean released glycans, label with 2-AB fluorescent tag via reductive amination (65°C, 2 hours).
- Cleanup: Remove excess label using HILIC solid-phase extraction (SPE) microplates.
- Chromatography: Inject onto a BEH Amide column (2.1 x 150 mm, 1.7 µm). Use a gradient from 75% to 50% ACN in 50 mM ammonium formate, pH 4.4, over 25 min. Flow: 0.4 mL/min. Column temperature: 60°C.
- Detection: FLD: λex=330 nm, λem=420 nm.
Protocol 2: MALDI-TOF-MS for Glycan Fingerprinting
- Sample Prep: Release and label glycans (optional). Desalt using porous graphitized carbon (PGC) tips.
- Matrix Application: Spot 1 µL of sample mixed 1:1 with super-DHB matrix solution (20 mg/mL in 70% ACN) on a target plate. Allow to dry under ambient conditions.
- Calibration: Calibrate instrument using a peptide or glycan standard mix covering the relevant m/z range.
- Acquisition: Acquire spectra in positive reflection mode. Mass range: 1000-5000 Da. Laser intensity optimized for signal-to-noise. Acquire 2000-5000 shots per spot from random positions.
Protocol 3: xCGE-LIF for High-Throughput Glycan Screening
- Labeling: Release and label glycans with APTS fluorophore (via reductive amination).
- Dilution: Dilute labeled glycans in Hi-Di formamide with appropriate internal size standards (e.g., Glucose Homopolymer ladder).
- Instrument Setup: Load samples into a 96-well plate. Install a 8- or 16-capillary array with a compatible gel matrix (e.g., carbohydrate separation gel).
- Run Conditions: Apply separation voltage of ~500 V/cm. Use LIF detection with a 488 nm laser and 520 nm emission filter.
- Data Analysis: Normalize migration times to the internal standard ladder for Glycan Unit (GU) assignment.
Visualization of Method Workflows
Title: HILIC-UHPLC-FLD N-Glycan Analysis Workflow
Title: MALDI-TOF-MS Analysis Process
Title: xCGE-LIF High-Throughput Process
The Scientist's Toolkit: Essential Research Reagent Solutions
Table 2: Key Reagents and Consumables for Robust Glycan Analysis
| Item | Function & Importance for Robustness |
|---|---|
| PNGase F (Recombinant) | High-activity, protease-free enzyme for consistent, complete N-glycan release from proteins. |
| 2-AB or APTS Dye Kits | Standardized, high-purity fluorophores for sensitive, quantitative labeling. Kits minimize batch variation. |
| BEH Amide UHPLC Columns | Robust stationary phase with high batch-to-batch reproducibility for HILIC separations. |
| Super-DHB Matrix | Optimized MALDI matrix for glycans, promotes homogeneous crystallization for better shot-to-shot reproducibility. |
| Carbohydrate Separation Gel Buffer | Standardized, viscosity-controlled polymer matrix for reproducible CGE separations and extended capillary life. |
| Glycan GU/Size Standards | Calibrant ladders (e.g., dextran, glucose homopolymer) essential for accurate peak assignment across all platforms. |
| HILIC & PGC SPE Microplates | Enable high-recovery, reproducible cleanup of labeled glycans, removing salts and excess dye. |
Head-to-Head Comparison: Validation, Data Quality, and Strategic Method Selection
This comparison guide objectively evaluates three advanced analytical platforms—HILIC-UHPLC-FLD, MALDI-TOF-MS, and xCGE-LIF—within a research thesis focused on the characterization and quality control (QC) of biopharmaceuticals, specifically monoclonal antibodies (mAbs) and glycoproteins. The assessment is based on four critical validation parameters.
Key Experimental Protocols
1. Glycan Profiling (N-linked Glycosylation)
- Sample Prep: Released glycans from a reference mAb (e.g., NISTmAb) via enzymatic digestion (PNGase F). Labeling with 2-AB for HILIC-FLD and procainamide for xCGE-LIF. No label required for MALDI-TOF-MS.
- HILIC-UHPLC-FLD: Column: BEH Glycan, 1.7 µm, 2.1 x 150 mm. Mobile phase: Gradient of ammonium formate (pH 4.5) and acetonitrile. Detection: Fluorescence (Ex: 330 nm, Em: 420 nm).
- xCGE-LIF: System configured for carbohydrate analysis. Separation matrix: borate-based gel buffer. Detection: Laser-Induced Fluorescence.
- MALDI-TOF-MS: Sample spotted with DHB matrix. Analysis in positive ion, reflection mode. Data processed for glycan mass identification and relative quantification.
2. Charge Variant Analysis
- Sample: Intact mAb under stressed (forced degradation) and native conditions.
- xCGE-LIF: Using a coated capillary and proprietary sieving gel for capillary isoelectric focusing (cIEF). Detection at 280 nm.
- HILIC-UHPLC-FLD (indirect): Not typically used for charge variants. Platform used here for aggregate analysis via SEC-UHPLC (not compared in this table).
3. Precision & Accuracy Assessment
- A spiked recovery study with a known glycoprotein standard (e.g., ribonuclease B) across 5 replicates over 3 days. Calculated %RSD (precision) and %Recovery (accuracy).
Quantitative Platform Comparison
Table 1: Validation Parameter Performance Across Platforms
| Parameter | HILIC-UHPLC-FLD | MALDI-TOF-MS | xCGE-LIF |
|---|---|---|---|
| Precision (Repeatability) | Excellent (%RSD < 2%) | Moderate (%RSD 5-15%) | Excellent (%RSD < 2%) |
| Accuracy (Recovery) | High (95-105%) | Moderate (80-110%)* | High (94-106%) |
| Linearity (Glycan Quant.) | Wide (R² > 0.998) | Narrower (R² ~0.990) | Wide (R² > 0.995) |
| Robustness (to buffer/op. changes) | High | Low to Moderate | Moderate to High |
| Key Application Strength | Quantitative Glycan Profiling | Structural Identification & High-Throughput Screening | Charge Variant & Glycan Profiling |
| Key Limitation | Limited Structural Detail | Semi-Quantitative, Matrix Effects | Limited Mass Information |
Accuracy in MALDI-TOF-MS is highly dependent on sample prep and matrix choice. *Linearity is affected by ion suppression and detector saturation.
The Scientist's Toolkit: Essential Research Reagent Solutions
| Item | Function |
|---|---|
| PNGase F Enzyme | Enzymatically releases N-linked glycans from the protein backbone for analysis. |
| 2-Aminobenzamide (2-AB) | Fluorescent label for glycans, enabling sensitive detection in HILIC-FLD and LC-MS. |
| DHB Matrix | Matrix for MALDI-TOF-MS, enabling soft ionization of glycan and protein samples. |
| cIEF Gel Buffer & pI Markers | Proprietary ampholyte mixtures and known pI standards for calibrating charge-based separations in xCGE. |
| NIST Monoclonal Antibody | Widely accepted reference material for method development and inter-platform comparison. |
Method Comparison and Data Integration Workflow
Glycan Analysis Pathways Across Platforms
This analysis provides a direct comparison of Hydrophilic Interaction Liquid Chromatography with Fluorescence Detection (HILIC-FLD) and multiplexed Capillary Gel Electrophoresis with Laser-Induced Fluorescence (xCGE-LIF) for absolute quantitation of biologics, within a broader methodological research thesis.
Quantitative Performance Comparison Table
| Performance Metric | HILIC-FLD | xCGE-LIF |
|---|---|---|
| Quantitation Range | 0.1 - 100 µg/mL (therapeutic mAb) | 0.05 - 10 µg/mL (antibody fragment) |
| Limit of Detection (LOD) | ~0.03 µg/mL | ~0.01 µg/mL |
| Limit of Quantitation (LOQ) | ~0.1 µg/mL | ~0.05 µg/mL |
| Accuracy (% Recovery) | 98-102% | 95-105% |
| Precision (% RSD) | Intra-run: <2%; Inter-run: <5% | Intra-run: <3%; Inter-run: <6% |
| Analysis Time per Sample | ~20-30 minutes (incl. equilibration) | ~5-10 minutes (multiplexed) |
| Sample Consumption | ~10-50 µL (injection) | ~1-5 nL (injection) |
| Key Application Focus | Released N-glycans, sialic acid, charge variants | Oligonucleotides, mAb size variants, fragment analysis |
Detailed Experimental Protocols
Protocol 1: HILIC-FLD for N-Glycan Absolute Quantitation
- Release: Denature 100 µg of mAb with RapiGest, reduce, and alkylate. Release N-glycans using PNGase F (2 hours, 37°C).
- Labeling: Purify released glycans via solid-phase extraction (SPE). Fluorescently label with 2-AB (2-aminobenzamide) in a 30:70 DMSO:acetic acid solution containing sodium cyanoborohydride. Incubate at 65°C for 2 hours.
- Purification: Remove excess label using HILIC SPE cartridges (e.g., PhyNexus μPAC).
- Chromatography: Inject onto a UHPLC BEH Amide column (2.1 x 150 mm, 1.7 µm). Use a gradient (Buffer A: 50 mM ammonium formate, pH 4.5; Buffer B: acetonitrile). Temperature: 60°C. Flow rate: 0.4 mL/min.
- Detection & Quantitation: FLD detection (Ex: 330 nm, Em: 420 nm). Use an external calibration curve of 2-AB labeled glucose homopolymer (GHP) for absolute quantitation based on glycan response factors.
Protocol 2: xCGE-LIF for Oligonucleotide Absolute Quantitation
- Sample Prep: Dilute siRNA or antisense oligonucleotide sample in deionized water. Mix 9 µL of sample with 1 µL of internal standard (fluorescently labeled, known concentration).
- Denaturation: Heat the mixture at 95°C for 5 minutes, then immediately place on ice for 3 minutes.
- Instrument Setup: Load samples onto a 96-well plate. Use a multiplexed CGE system (e.g., SCIEX PA 800 Plus or equivalent) with a laser-induced fluorescence detector (488 nm Ex/520 nm Em). Install a dye-coated capillary (50 µm ID, 30 cm length) filled with sieving gel.
- Separation: Apply injection voltage of 5 kV for 10 seconds. Perform separation at -15 kV for 30 minutes. Use a polymer matrix optimized for oligonucleotide size separation.
- Data Analysis: Integrate peak areas for target and internal standard. Calculate absolute concentration using the internal standard calibration method, correcting for migration time and peak area ratios.
Visualization of Method Workflows
Title: HILIC-FLD N-Glycan Quantitation Workflow
Title: xCGE-LIF Oligonucleotide Quantitation Workflow
The Scientist's Toolkit: Key Research Reagent Solutions
| Item | Primary Function in Analysis |
|---|---|
| PNGase F (Glycoamidase) | Enzymatically cleaves N-linked glycans from glycoproteins for HILIC-FLD analysis. |
| 2-AB (2-Aminobenzamide) | Fluorescent tag for labeling released glycans, enabling highly sensitive FLD detection. |
| Ammonium Formate Buffer | Volatile salt buffer for HILIC mobile phase, compatible with MS and FLD. |
| BEH Amide UHPLC Column | Stationary phase for HILIC separation based on glycan hydrophilicity. |
| Fluorescent Internal Std | Known-concentration, labeled oligonucleotide for normalization and quantitation in xCGE-LIF. |
| Capillary Sieving Gel | Polymer matrix for size-based separation of oligonucleotides or proteins in CGE. |
| Dye-Coated Capillary | Capillary with covalent coating to suppress electroosmotic flow (EOF) for reproducible CGE. |
| Glucose Homopolymer (GHP) | Calibrant ladder for creating a retention time and quantitative response model for glycans. |
In the analytical characterization of biotherapeutics, such as monoclonal antibodies (mAbs), the choice of technique profoundly impacts the structural insights obtained. This comparison guide, situated within a broader thesis evaluating HILIC-UHPLC-FLD, MALDI-TOF-MS, and xCGE-LIF for attribute monitoring, objectively contrasts the orthogonal strengths of HILIC-based separations and MALDI-TOF-MS.
Core Performance Comparison
The following table summarizes the key performance metrics for analyzing glycans released from a reference mAb (e.g., NISTmAb).
Table 1: Quantitative Performance Comparison for Released N-Glycan Analysis
| Parameter | HILIC-UHPLC-FLD (with 2-AB labeling) | MALDI-TOF-MS (with DHB matrix) |
|---|---|---|
| Primary Strength | Isomeric Separation & Quantitative Profiling | Accurate Mass & Glycan Composition |
| Resolution Metric | Chromatographic Resolution (Rs > 1.5 for key isomers) | Mass Resolution (e.g., 20,000 - 30,000 FWHM) |
| Mass Accuracy | Not Applicable | < 5 ppm (with internal calibration) |
| Quantitative Linearity (RSD) | < 5% (peak area, major glycans) | 10-20% (peak intensity, varies with composition) |
| Key Isomers Distinguished | Galactose isomers (G1α1,3 vs. G1α1,6), Sialic acid linkages (α2,3 vs α2,6) via derivatization | Typically not separated; reported as summed composition (e.g., FA2G2S1) |
| Detection Sensitivity | Low-fmol (via FLD) | High-fmol to low-pmol |
| Sample Throughput | Moderate (10-30 min/run) | High (minutes/spot, rapid acquisition) |
Detailed Experimental Protocols
Protocol 1: HILIC-UHPLC-FLD for Isomeric N-Glycan Profiling
- Release: Denature 100 µg of mAb with SDS, reduce with DTT, and alkylate with iodoacetamide. Digest with PNGase F (2.5 U/µg, 37°C, 18h).
- Labeling: Isolate glycans via solid-phase extraction (SPE) on a hydrophilic resin. Label with 2-Aminobenzamide (2-AB) in a 30:70 (v/v) mixture of acetic acid and DMSO containing sodium cyanoborohydride (65°C, 2h).
- Purification: Remove excess label via HILIC SPE cartridges.
- Separation: Inject labeled glycans onto a BEH Glycan or similar HILIC column (2.1 x 150 mm, 1.7 µm). Use a mobile phase gradient (A: 50mM ammonium formate pH 4.4, B: acetonitrile) from 70% B to 50% B over 30 min at 0.4 mL/min, 40°C.
- Detection: Use FLD (ex: 250 nm, em: 428 nm). Identify peaks via external GU value calibration with a 2-AB labeled dextran ladder.
Protocol 2: MALDI-TOF-MS for Glycan Composition Profiling
- Release & Purification: Release glycans as in Protocol 1, step 1. Desalt using porous graphitized carbon (PGC) microtips.
- Spotting: Mix the glycan sample 1:1 (v/v) with a 10 mg/mL solution of 2,5-Dihydroxybenzoic acid (DHB) in 50% acetonitrile/0.1% TFA. Spot 1 µL onto a ground-steel MALDI target and allow to crystallize.
- Calibration: Apply spots of an external calibrant (e.g., peptide or glycan standard mix) adjacent to samples.
- Acquisition: Acquire mass spectra in positive reflection mode. Set laser intensity to just above the ion generation threshold. Accumulate 2000-5000 shots per spectrum across a m/z range of 1000-5000.
- Processing: Perform internal calibration if available using known glycan peaks (e.g., FA2). Assign compositions using exact mass (typically < 5 ppm tolerance).
Experimental Workflow & Logical Relationship
Diagram Title: Analytical Pathways for Glycan Characterization
The Scientist's Toolkit: Research Reagent Solutions
Table 2: Essential Reagents and Materials
| Item | Function in Analysis | Typical Example/Supplier |
|---|---|---|
| PNGase F (R) | Enzyme that releases N-linked glycans from the protein backbone for detailed analysis. | ProZyme Glyko PNGase F |
| 2-Aminobenzamide (2-AB) | Fluorescent tag for glycans enabling highly sensitive and quantitative detection in HILIC-FLD. | Sigma-Aldrich |
| BEH Glycan Column | Stationary phase designed for high-resolution HILIC separation of labeled glycans. | Waters ACQUITY UPLC BEH Glycan |
| 2,5-Dihydroxybenzoic Acid (DHB) | MALDI matrix facilitating soft ionization of glycans for mass spectrometric analysis. | Bruker Daltonics DHB |
| Porous Graphitized Carbon (PGC) Tips | Solid-phase extraction tips for efficient desalting and purification of glycans prior to MS. | Glygen PGX PGC Tips |
| Dextran Hydrolysis Ladder | Standard for assigning Glucose Unit (GU) values to HILIC peaks for glycan identification. | Waters GU Calibration Standard |
| Ammonium Formate | Volatile buffer salt for creating pH-stable mobile phases in HILIC-UHPLC. | Thermo Scientific |
| NIST Monoclonal Antibody (RM 8671) | Reference material for method development, qualification, and inter-laboratory comparison. | NIST RM 8671 |
This comparison guide evaluates three prominent analytical methods for therapeutic protein characterization, specifically N-glycan analysis, within the context of a broader thesis comparing HILIC-UHPLC-FLD, MALDI-TOF-MS, and xCGE-LIF. The analysis focuses on throughput, labor, and consumable costs, supported by recent experimental data.
Experimental Protocols for Cited Data
1. HILIC-UHPLC-FLD Protocol:
- Sample Prep: Released N-glycans are labeled with 2-AB. Excess label is removed using solid-phase extraction (SPE) cartridges.
- Chromatography: Separations are performed on a BEH Amide column (e.g., 2.1 x 150 mm, 1.7 µm) under UHPLC conditions. Mobile phase A is typically 50 mM ammonium formate (pH 4.4), and B is acetonitrile. A gradient from 70-80% B to 50% B over ~25 min is used.
- Detection: Fluorescence (λex=330 nm, λem=420 nm) provides quantitative data.
2. MALDI-TOF-MS Protocol:
- Sample Prep: Released glycans are spotted on a target plate with a suitable matrix (e.g., 2,5-dihydroxybenzoic acid).
- Analysis: Spectra are acquired in positive ion reflection mode. Instrument calibration is performed daily with an external glycan standard mixture.
- Data Processing: Spectra are processed using dedicated software (e.g., flexAnalysis) for peak picking and assignment. Quantitation is semi-quantitative based on relative peak intensities.
3. xCGE-LIF Protocol:
- Sample Prep: Released N-glycans are labeled with APTS. Excess dye is removed via size-exclusion filtration or purification plates.
- Analysis: Samples are loaded onto a carbohydrate separation gel cartridge on a capillary electrophoresis instrument (e.g., PA 800 Plus). Separation occurs at a fixed voltage (~30 kV) with laser-induced fluorescence detection (λex=488 nm, λem=520 nm).
- Data Processing: Electropherograms are analyzed using software (e.g., 32 Karat) to assign peaks to a glucose ladder unit (GU) value.
Table 1: Throughput and Hands-on Time Analysis
| Metric | HILIC-UHPLC-FLD | MALDI-TOF-MS | xCGE-LIF |
|---|---|---|---|
| Sample Preparation Time (Hands-on, per 96 samples) | ~4-5 hours | ~2-3 hours | ~3-4 hours |
| Instrument Run Time (per sample) | ~25-30 minutes | ~3-5 minutes (incl. spot drying) | ~5-10 minutes |
| Total Time to Result (for 96 samples) | ~48-60 hours | ~8-12 hours | ~12-20 hours |
| Degree of Automation Potential | Medium (SPE can be automated) | Low (spotting is often manual) | High (96-well plate based) |
| Primary Throughput Bottleneck | Long chromatographic run time | Manual sample spotting & drying | Sequential capillary runs |
Table 2: Cost Analysis (Estimated per Sample)
| Cost Component | HILIC-UHPLC-FLD | MALDI-TOF-MS | xCGE-LIF |
|---|---|---|---|
| Consumables (Columns, capillaries, plates) | $12 - $18 (UHPLC column major cost) | $3 - $7 (target plates, matrix) | $8 - $15 (capillary cartridges, sieving gel) |
| Labels & Chemicals | $5 - $10 | $1 - $3 | $4 - $8 (APTS label is costly) |
| Instrument Capital Cost | High | Medium-High | Medium |
| Maintenance Annual Cost | High (pump seals, detector lamps) | Medium (laser, target replacement) | Medium (capillary cartridge replacement) |
Workflow Diagrams
Title: HILIC-UHPLC-FLD Quantitative N-Glycan Workflow
Title: Method Selection Logic for N-Glycan Analysis
The Scientist's Toolkit: Key Research Reagent Solutions
Table 3: Essential Materials for N-Glycan Analysis
| Item | Function | Common Example/Kit |
|---|---|---|
| PNGase F | Enzyme for releasing N-linked glycans from the protein backbone. | Recombinant, glycerol-free PNGase F. |
| Fluorescent Dye (2-AB) | Labels glycans for highly sensitive fluorescence detection in HILIC-FLD. | 2-Aminobenzamide (2-AB) labeling kit. |
| Fluorescent Dye (APTS) | Charged fluorophore for labeling glycans in xCGE-LIF. | 8-Aminopyrene-1,3,6-trisulfonic acid (APTS). |
| MALDI Matrix (DHB) | Facilitates ionization of glycans for mass spectrometric analysis. | 2,5-Dihydroxybenzoic acid (DHB). |
| HILIC UHPLC Column | Stationary phase for separating labeled glycans by hydrophilicity. | BEH Amide, 1.7 µm particle size. |
| xCGE-LIF Gel Buffer | A sieving polymer matrix for size-based separation of APTS-labeled glycans. | Carbohydrate Separation Gel Buffer. |
| Glycan Standard | Calibrant for assigning retention/migration times or m/z values. | Dextran ladder or defined glycan standard mixture. |
| SPE Plate (for HILIC) | Removes excess labeling dye and salts from samples. | Hydrophilic-modified polystyrene divinylbenzene plates. |
Selecting the optimal analytical method is a critical, phase-dependent decision in biopharmaceutical development. This guide compares three high-resolution techniques for characterizing critical quality attributes like glycosylation and charge variants: Hydrophilic Interaction Liquid Chromatography with Fluorescence Detection (HILIC-UHPLC-FLD), Matrix-Assisted Laser Desorption/Ionization Time-of-Flight Mass Spectrometry (MALDI-TOF-MS), and multiplexed Capillary Gel Electrophoresis with Laser-Induced Fluorescence detection (xCGE-LIF). The choice among them hinges on the specific needs of Research & Development (R&D), Quality Control (QC), and Regulatory Submissions.
Method Comparison & Performance Data
Table 1: Core Method Comparison for Biopharmaceutical Analysis
| Feature | HILIC-UHPLC-FLD | MALDI-TOF-MS | xCGE-LIF |
|---|---|---|---|
| Primary Application | Released glycan profiling (qualitative & relative quantitative) | Glycan profiling, mass confirmation, high-throughput screening | Released glycan profiling, oligosaccharide mapping, charge variant analysis |
| Throughput | Moderate (sample prep intensive) | High (rapid acquisition) | Very High (multiplexed, parallel separation) |
| Sensitivity | High (fmol with fluorescence labeling) | Moderate | Very High (amol with LIF detection) |
| Quantitation | Excellent (linear dynamic range >10³) | Semi-quantitative | Excellent (linear dynamic range >10⁴) |
| Structural Info | Linkage isomers (via standards), composition | Compositional mass (accurate mass) | Size-based separation (GU values) |
| Ease of Use | Moderate (requires UHPLC expertise) | Simple (minimal training for acquisition) | Simple (highly automated) |
| Regulatory Readiness | High (robust, validated, compendial) | Moderate (often used for characterization) | High (increasingly adopted for QC) |
| Cost per Sample | Medium | Low | Low (high multiplexing) |
Table 2: Experimental Performance Data from Comparative Studies
| Analytical Parameter | HILIC-UHPLC-FLD | MALDI-TOF-MS | xCGE-LIF |
|---|---|---|---|
| Repeatability (%RSD, peak area) | < 5% | 10 - 20% | < 3% |
| Intermediate Precision (%RSD) | < 10% | 15 - 25% | < 8% |
| Analytical Time per Sample | ~30-60 min | ~5 min (plate reading) | ~5-10 min (multiplexed, 96 samples in ~2 hrs) |
| Resolution of Sialylated Isomers | High | Low (cannot resolve without derivatization) | Moderate |
| Detection of Low-Abundance Species | Yes | Limited by ion suppression | Excellent (high sensitivity LIF) |
Experimental Protocols for Key Comparisons
Protocol 1: Released N-Glycan Profiling (Common Sample Preparation)
- Denaturation: Incubate 100 µg of monoclonal antibody in 20 µL of 1% SDS, 50 mM DTT at 60°C for 10 min.
- Enzymatic Release: Add 10 µL of 10% Triton X-100 and 2 µL (500 U) of PNGase F. Incubate at 37°C for 3 hours.
- Cleanup: Purify released glycans using solid-phase extraction (SPE) with hydrophilic interaction or graphitized carbon cartridges.
- Labeling:
- For HILIC-FLD/XCCE-LIF: Reconstitute in 10 µL of 2-AB/ProA labeling dye, incubate at 65°C for 2 hours. Remove excess dye via SPE.
- For MALDI-TOF-MS: Reconstitute in 10 µL of water for direct spotting or permethylate for enhanced sensitivity.
Protocol 2: HILIC-UHPLC-FLD Analysis
- Column: BEH Glycan, 1.7 µm, 2.1 x 150 mm.
- Mobile Phase: A) 50 mM ammonium formate, pH 4.4; B) Acetonitrile.
- Gradient: 70-53% B over 25 min at 0.4 mL/min, 40°C.
- Detection: FLD (Ex λ: 330 nm, Em λ: 420 nm).
- Data Analysis: Assign peaks using a dextran ladder (Glucose Unit, GU) and external standards. Quantify via relative peak area.
Protocol 3: MALDI-TOF-MS Analysis
- Sample Spotting: Mix 0.5 µL of purified glycan sample with 0.5 µL of DHB matrix (20 mg/mL in 50% ACN, 0.1% TFA) on target.
- Instrument: Use a reflector-positive mode.
- Acquisition: Mass range: 500-5000 m/z. Laser intensity optimized for signal. 2000 shots accumulated per spectrum.
- Data Analysis: Spectral processing (baseline subtraction, smoothing). Assign compositions based on accurate mass (± 50 ppm).
Protocol 4: xCGE-LIF Analysis
- Instrument: Multi-capillary system (e.g., 8-96 capillaries).
- Gel Matrix: High-performance carbohydrate separation gel.
- Sample Prep: Dilute 2-AB labeled glycans in water/sample buffer. Load onto 96-well plate with appropriate size standards.
- Run Conditions: Separation at kV for 30-60 minutes.
- Detection: LIF (Ex λ: 488 nm, Em λ: 520 nm).
- Data Analysis: Automated peak identification and quantitation using migration time indexed to an internal standard ladder.
Visualization of Method Selection Logic
Title: Decision Logic for Analytical Method Selection
The Scientist's Toolkit: Essential Research Reagent Solutions
Table 3: Key Reagents and Materials for Glycan Analysis
| Item | Function & Application |
|---|---|
| PNGase F (Rapid) | Enzyme for efficient release of N-linked glycans from glycoproteins under non-denaturing or denaturing conditions. |
| 2-Aminobenzamide (2-AB) | Fluorescent label for glycans; enables highly sensitive detection in HILIC-FLD and xCGE-LIF. |
| InstantAB Labeling Kit | A commercial kit for rapid, one-step glycan labeling with 2-AB, minimizing sample preparation time. |
| Procainamide (ProA) | Alternative fluorescent tag offering higher sensitivity than 2-AB for LIF detection, used in xCGE-LIF. |
| SIGMA Glycan Library | A set of defined, 2-AB labeled N-glycan standards used for peak assignment based on Glucose Unit (GU) values in HILIC. |
| DHB Matrix (2,5-Dihydroxybenzoic Acid) | Common matrix for MALDI-TOF-MS analysis of underivatized glycans, promoting soft ionization. |
| Carbograph SPE Cartridge | Solid-phase extraction cartridge for clean-up of released, labeled glycans, removing salts and detergents. |
| HiPlex Glycan Assay Chips/Buffers | Pre-packaged, optimized gel matrices and buffers for use in xCGE-LIF systems, ensuring run-to-run reproducibility. |
| Dextran Ladder (DP10-50) | A hydrolysate of dextran used as an external standard to create a GU calibration curve for HILIC retention time alignment. |
| Internal Standard (e.g., APTS-labeled dextran) | Fluorescently labeled standard added to every sample in xCGE-LIF for precise migration time normalization and quantitation. |
Conclusion
The comparative analysis of HILIC-UHPLC-FLD, MALDI-TOF-MS, and xCGE-LIF reveals a complementary landscape of tools for N-glycan analysis, where no single method is universally superior. HILIC-UHPLC-FLD excels in robust, quantitative, isomer-sensitive profiling ideal for quality control. MALDI-TOF-MS offers unparalleled speed and simplicity for high-throughput screening and mass profiling. xCGE-LIF provides exceptional resolution and sensitivity with high multiplexing capability. The optimal choice is dictated by the specific phase of development, required information depth (quantitative vs. qualitative), and available resources. Future directions point toward increased automation, data integration via multi-platform orthogonal approaches, and the application of advanced machine learning for data interpretation. Embracing a fit-for-purpose strategy, leveraging the strengths of each platform, will be crucial for accelerating the development of next-generation, high-quality biotherapeutics with well-defined critical quality attributes.