Absolute Quantification of Glycans: A Comprehensive Guide to the Full Glycome Internal Standard Approach for MALDI-TOF-MS
This article provides a comprehensive guide for researchers and drug development professionals on implementing a full glycome internal standard approach for accurate, absolute quantification of glycans using MALDI-TOF-MS.
Absolute Quantification of Glycans: A Comprehensive Guide to the Full Glycome Internal Standard Approach for MALDI-TOF-MS
Abstract
This article provides a comprehensive guide for researchers and drug development professionals on implementing a full glycome internal standard approach for accurate, absolute quantification of glycans using MALDI-TOF-MS. We cover the foundational principles of glycan analysis and why quantification is a major challenge. The methodological section details a step-by-step protocol for selecting, preparing, and using isotopically-labeled internal standards across the entire glycome. We address common troubleshooting issues in sample preparation, matrix selection, and spectral interpretation, offering optimization strategies for sensitivity and reproducibility. Finally, we validate the approach through comparative analysis with other techniques (like LC-MS and HPLC) and present data on accuracy, precision, and linear dynamic range. This guide aims to equip scientists with the knowledge to achieve robust, quantitative glycomics data for biomarker discovery and biotherapeutic development.
Why Quantify Glycans? Understanding the Challenge and Core Principle of Internal Standardization
Application Note AN-001: Full Glycome Internal Standard (FGIS) for Serum N-Glycan Quantification in Cancer Biomarker Discovery
Objective: To quantify alterations in the serum N-glycome associated with hepatocellular carcinoma (HCC) using a Full Glycome Internal Standard (FGIS) approach for MALDI-TOF-MS, enabling absolute quantification and inter-laboratory reproducibility.
Background: Glycosylation changes on serum proteins, such as increased branching and fucosylation, are hallmark events in HCC. Precise quantification of these changes is crucial for developing clinical biomarkers but is hampered by a lack of standardized quantification methods.
Experimental Protocol: FGIS-Enabled Serum N-Glycan Preparation for MALDI-TOF-MS
Step 1: Serum Protein Denaturation & Release.
- Dilute 10 µL of human serum with 90 µL of 50 mM ammonium bicarbonate buffer.
- Denature by adding 1 µL of 10% SDS and heating at 65°C for 10 min.
- Add 10 µL of 10% Igepal CA-630 to sequester SDS.
- Add 2 µL of recombinant PNGase F (500 U/µL) and incubate at 37°C for 18 hours.
Step 2: FGIS Addition and Glycan Cleanup.
- Add 10 µL of the FGIS Mixture (see Reagent Solutions) to the released glycan sample. This contains a known molar quantity of 13C-labeled, non-natural glycans covering major structural classes.
- Desalt and purify glycans using porous graphitized carbon (PGC) solid-phase extraction tips.
- Elute glycans with 40% acetonitrile containing 0.1% TFA, followed by 60% acetonitrile with 0.1% TFA. Combine eluates and dry in a vacuum concentrator.
Step 3: MALDI Target Preparation & Data Acquisition.
- Reconstitute glycans in 20 µL of ultrapure water.
- Spot 1 µL of sample mixed 1:1 with super-DHB matrix (20 mg/mL in 50% acetonitrile) onto a polished steel MALDI target.
- Acquire spectra in positive reflection mode on a MALDI-TOF/TOF instrument (e.g., Bruker ultrafleXtreme).
- Acquisition Parameters: Mass range: 1000-5000 Da; Laser frequency: 2000 Hz; 5000 shots summed per spectrum.
Step 4: Data Processing and Absolute Quantification.
- Process spectra (smoothing, baseline subtraction) using proprietary software (e.g., flexAnalysis).
- For each target native glycan peak ([M+Na]+), identify the nearest eluting FGIS glycan peak based on retention behavior in PGC-SPE (simulated by mass proximity in a defined window).
- Apply the response factor calculated from the FGIS standard to the native glycan peak intensity.
- Calculate absolute quantity using the formula:
[Glycan]_{abs} = (Peak Area_{Native} / Peak Area_{FGIS}) * [FGIS]_{known}
Results & Data Presentation:
Table 1: Absolute Quantification of Key Serum N-Glycans in HCC vs. Control Cohorts (n=50/group)
| Glycan Composition (HexNAc-Hex-Fuc-NeuAc) | Mean Quantity in Control (pmol/µL serum) | Mean Quantity in HCC (pmol/µL serum) | Fold Change (HCC/Control) | p-value |
|---|---|---|---|---|
| 4-5-1-0 (Core Fucosylated Triantennary) | 1.23 ± 0.31 | 3.87 ± 0.89 | 3.15 | <0.0001 |
| 3-3-0-0 (Biantennary) | 12.45 ± 2.15 | 8.91 ± 1.76 | 0.72 | 0.003 |
| 4-4-0-2 (Disialylated Tetraantennary) | 0.89 ± 0.21 | 2.45 ± 0.67 | 2.75 | <0.0001 |
| 3-4-1-0 (Fucosylated, Galactosylated) | 3.21 ± 0.78 | 6.54 ± 1.23 | 2.04 | 0.001 |
Conclusion: The FGIS approach enables robust, absolute quantification of serum N-glycans. Data confirm significant increases in fucosylated and branched structures in HCC, providing a quantitative foundation for multi-glycan biomarker panels.
Protocol PR-002: Glycoengineered mAb Critical Quality Attribute (CQA) Monitoring via FGIS-MALDI-TOF-MS
Objective: To monitor site-specific glycosylation (e.g., Fc G0, G1, G2, G1F, G2F) on a therapeutic monoclonal antibody (mAb) during bioprocessing using an FGIS workflow for comparability and lot-release analytics.
Detailed Protocol:
Step 1: mAb Digestion and Glycan Release.
- Dilute purified mAb to 1 mg/mL in 50 mM ammonium bicarbonate.
- Add trypsin at a 1:20 (w/w) enzyme-to-substrate ratio. Incubate at 37°C for 4 hours.
- Heat-inactivate at 80°C for 10 min.
- Add PNGase F (2 µL per 100 µg mAb) and incubate at 37°C for 3 hours.
Step 2: FGIS Addition and SPE.
- Spike in 5 µL of mAb-Specific FGIS Mix containing 13C-labeled versions of G0, G1F, G2F, and Man5.
- Acidify sample with 1% TFA.
- Load onto a C18 tip to separate glycans (flow-through) from peptides (retained). Collect flow-through and dry.
Step 3: Permethylation for Enhanced MS Sensitivity.
- Reconstitute dried glycans in DMSO.
- Perform sodium hydroxide/DMSO slurry-based permethylation.
- Extract permethylated glycans with dichloromethane and water. Dry organic phase.
Step 4: MALDI-MS Analysis & Quantification.
- Reconstitute in 10 µL methanol. Spot with DHB matrix.
- Acquire spectra in positive linear mode for higher mass range.
- Use FGIS peaks as internal calibrants and quantification references for each glycoform class.
Table 2: Fc Glycosylation CQA Results for Three Bioreactor Lots of mAb-X
| Glycoform | Lot A (% of Total Glycans) | Lot B (% of Total Glycans) | Lot C (% of Total Glycans) | Specification Target |
|---|---|---|---|---|
| G0F | 2.1 ± 0.3 | 1.9 ± 0.2 | 7.8 ± 0.6 | ≤5.0% |
| G1F | 28.5 ± 1.1 | 30.1 ± 1.3 | 25.4 ± 1.0 | 25-35% |
| G2F | 62.3 ± 1.5 | 60.8 ± 1.7 | 58.9 ± 1.4 | ≥55% |
| Man5 | 0.5 ± 0.1 | 0.4 ± 0.1 | 1.2 ± 0.2 | ≤1.5% |
| Total Afucosylation | 0.8 ± 0.2 | 1.1 ± 0.2 | 1.5 ± 0.3 | ≤2.0% |
Conclusion: FGIS-MALDI-TOF-MS provides a high-throughput, precise method for mAb glycosylation CQA monitoring. Lot C shows a notable excursion in G0F, highlighting the need for process control.
The Scientist's Toolkit: Research Reagent Solutions
Table 3: Essential Reagents for FGIS-MALDI Glycomics
| Item | Function in Protocol |
|---|---|
| Full Glycome Internal Standard (FGIS) Kit | A predefined mixture of stable isotope (13C)-labeled, non-natural glycans. Serves as internal calibrants and quantification standards for native glycans across the structural range. |
| Recombinant PNGase F (Glycerol-free) | Enzyme for efficient release of N-glycans from glycoproteins under non-denaturing or denaturing conditions. |
| PGC (Porous Graphitized Carbon) SPE Tips | For solid-phase extraction clean-up of released glycans, removing salts and peptides, with selective elution based on hydrophilicity. |
| Super-DHB Matrix | 9:1 mixture of 2,5-dihydroxybenzoic acid and 2-hydroxy-5-methoxybenzoic acid. Optimal matrix for glycan ionization in MALDI-TOF-MS. |
| Permethylation Reagents (DMSO, NaOH, CH3I) | For derivatizing glycans to improve MS ionization efficiency, stabilize sialic acids, and provide structural information via fragmentation. |
| 13C6-Aniline Labeling Reagent | Alternative labeling agent for glycans; 13C-aniline facilitates quantification via mass shift and improved ionization. |
Diagrams
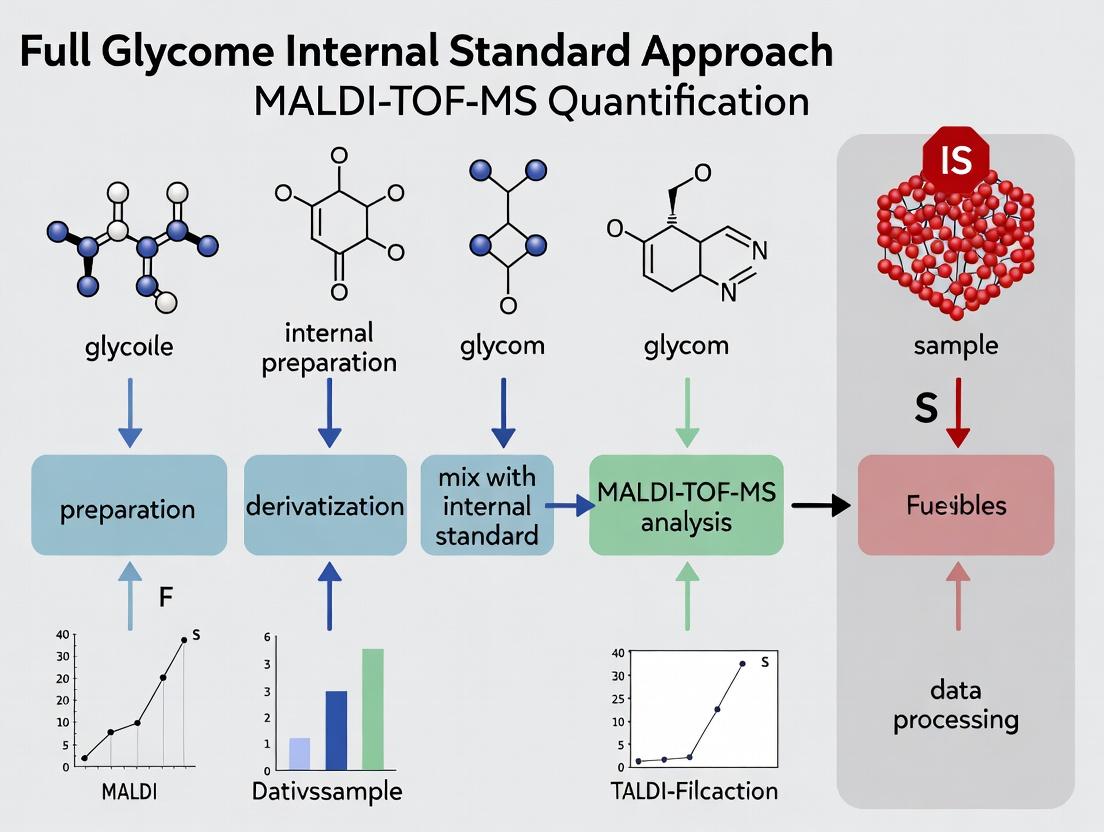
Title: FGIS-MALDI Workflow for Glycan Quantification
Title: Key Enzymes in N-Glycan Biosynthesis Pathway
Application Notes: Quantification Challenges in MALDI-TOF-MS Glycomics
MALDI-TOF-MS is a powerful tool for glycan profiling due to its high sensitivity, speed, and tolerance to salts/buffers. However, its quantitative utility is severely hampered by several inherent factors. The following table summarizes the primary challenges and their quantitative impact based on current literature.
Table 1: Key Quantification Challenges in MALDI-TOF-MS Glycomics
| Challenge | Underlying Cause | Quantitative Impact (Reported Variability) | Proposed Mitigation in Literature |
|---|---|---|---|
| Ion Suppression | Competitive ionization between analytes of different sizes/structures. | Can cause >50% signal variance for co-crystallized analytes. | Extensive sample purification, use of internal standards (IS). |
| Matrix Adduct Formation | Non-covalent binding of matrix ions (e.g., Na+, K+) to glycans. | Multiple peaks per analyte; intensity distribution variable (±15-30%). | Cation exchange resins, controlled salt addition. |
| Laser Shot Heterogeneity | Inhomogeneous co-crystallization of sample and matrix ("sweet spots"). | Spot-to-spot CV often >20-30%; intra-spot CV also high. | Rastering over entire spot, summing many laser shots (≥1000). |
| Differential Desorption/Ionization | Glycans with different masses/structures have different ionization efficiencies. | Response can vary by an order of magnitude for isomeric glycans. | Structuraly matched internal standards (often unavailable). |
| Poor Reproducibility of Matrices | Batch-to-batch variability of common matrices (e.g., DHB). | Inter-day CVs of 25-40% are common without rigorous standardization. | Use of pre-mixed, QC'd commercial matrix solutions. |
The central thesis of employing a "full glycome internal standard" approach seeks to address these challenges by providing a structurally identical, isotopically labeled IS for every native glycan in a sample, thereby normalizing for variability in desorption, ionization, and detection.
Detailed Protocols
Protocol 1: Preparation of Permethylated Glycans for MALDI-TOF-MS Analysis with Spike-In Standards
This protocol is optimized for N-glycan released from glycoproteins or from cell lysates.
Research Reagent Solutions Toolkit:
| Item | Function |
|---|---|
| PNGase F (R-) | Enzyme for releasing N-glycans from glycoproteins/peptides without core α1-3 fucose activity. |
| Anhydrous Dimethyl Sulfoxide (DMSO) | Solvent for the permethylation reaction. |
| Iodomethane (CH₃I) | Methylation reagent for glycan permethylation (enhances sensitivity and stability). |
| Sodium Hydroxide Beads | Solid base catalyst for permethylation. |
| ¹³C-labeled Reducing Agent (e.g., ¹³C-cyanoborohydride) | For generating stable isotope-labeled internal standards via reduction. |
| DHB Matrix Solution (20 mg/mL in 50% ACN, 1 mM NaTFA) | Common MALDI matrix for glycans; DHB = 2,5-Dihydroxybenzoic acid. |
| Cation Exchange Resin (Na+ form) | Converts all glycan adducts to uniform [M+Na]+ ions for simpler spectra. |
| Solid-Phase Extraction (SPE) Cartridges (C18 & Porous Graphitized Carbon) | For purification of released glycans from salts, detergents, and peptides. |
Procedure:
- Glycan Release: Release N-glycans from your target protein (10-100 µg) using PNGase F in a volatile buffer (e.g., 50 mM ammonium bicarbonate, pH 8.0) overnight at 37°C.
- Desalting/Purification: Pass the reaction mixture through a C18 SPE cartridge (to retain peptides/proteins) and collect the flow-through containing glycans. Further purify using a Porous Graphitized Carbon (PGC) SPE cartridge. Elute glycans with 40% acetonitrile (ACN) in 0.1% TFA, then dry completely.
- Spike-In of Isotopic Standards: At this stage, reconstitute the dried native glycans in a known volume of water. Add a predetermined amount of your synthesized full glycome internal standard (FGIS) mixture—a matched set of ¹³C/¹⁵N-labeled glycans.
- Permethylation (Optional but Recommended):
- Prepare a slurry of NaOH beads in anhydrous DMSO.
- Add the glycan sample (with spiked IS) in DMSO to the slurry.
- Add iodomethane dropwise under gentle agitation. React for 15-20 minutes at room temperature.
- Quench the reaction with water.
- Extract permethylated glycans with dichloromethane. Wash the organic layer several times with water and dry.
- Cation Exchange: Reconstitute the permethylated glycans in 20 µL of ACN/water (70:30). Pass through a small column of cation exchange resin (Na+ form) to convert all glycan ions to sodium adducts. Dry the eluent.
- MALDI Target Spotting: Reconstitute the final sample in 10 µL of 50% ACN. Mix 1 µL of this sample with 1 µL of DHB matrix solution on the MALDI target. Allow to dry completely at room temperature.
- Data Acquisition:
- Acquire spectra in positive ion reflection mode.
- Use a laser intensity sufficiently above the threshold to ensure good signal-to-noise.
- Acquire a minimum of 1000 laser shots per spot, rastering across the entire sample spot to average out heterogeneity.
- For quantitative comparison, analyze all samples in a single, randomized run to minimize instrument drift effects.
Protocol 2: Relative Quantification Workflow Using Full Glycome Internal Standards (FGIS)
This protocol outlines the data processing steps after acquisition using the FGIS method.
Procedure:
- Spectral Pre-processing: Perform baseline subtraction, smoothing (Savitzky-Golay), and peak detection (S/N threshold >5) using your instrument software or external tools (e.g., mMass).
- Peak Alignment & Pairing: Align peaks across all spectra in the experiment. For each native (light) glycan peak (m/z = M), identify its corresponding heavy internal standard peak (m/z = M + Δ), where Δ is the known mass shift from isotopic labeling (e.g., 3 Da for a triply charged permethylated glycan reduced with ¹³C-borohydride).
- Peak Intensity Extraction: Extract the integrated peak area (or height) for each light/heavy pair.
- Ratio Calculation & Normalization: Calculate the Light/Heavy (L/H) ratio for each glycan species. Normalize these ratios to a calibrator sample (e.g., a pool of all samples) run on the same target plate to correct for inter-run variability.
- Statistical Analysis: Use the normalized L/H ratios for downstream comparative statistical analysis (e.g., t-tests, ANOVA).
Visualizations
Title: FGIS MALDI-TOF Glycomics Workflow
Title: Quant Hurdles & FGIS Correction Mechanism
The field of clinical glycomics has long relied on relative quantification, reporting glycan changes as normalized percentages or ratios. While informative for discovery, this approach fails to determine the absolute molar quantity of glycans per molecule or per sample volume—a critical parameter for biomarker validation, pharmacokinetic studies, and therapeutic potency assays. This application note positions the development of a Full Glycome Internal Standard (FGIS) approach for MALDI-TOF-MS as a foundational solution to this challenge, enabling the transition from relative profiling to rigorous absolute quantification required for clinical and regulatory decision-making.
The Quantitative Limitation of Relative Glycan Profiling
Relative quantification, typically achieved by normalizing individual glycan peak intensities to total ion count, masks biologically significant changes in absolute abundance. A change in the relative percentage of a glycan can result from an actual increase in its amount or a decrease in other glycans. For regulatory filings, such as for biosimilars or glyco-engineered biologics, absolute concentrations of critical quality attributes (e.g., sialylation, fucosylation) are mandatory.
Table 1: Pitfalls of Relative vs. Requirements of Absolute Quantification
| Aspect | Relative Quantification (Current Standard) | Absolute Quantification (FGIS-Enabled) |
|---|---|---|
| Output | Percentage or fold-change | Picomoles/µL or moles/mole |
| Impact of Total Glycome Shift | Misinterprets changes | Reports true concentration change |
| Cross-Sample Comparison | Challenging; requires equal total input | Directly comparable |
| Longitudinal Study Utility | Limited | High (tracks concentration over time) |
| Regulatory Acceptance | Low for critical attributes | High; required for lot release |
| Biomarker Threshold | Cannot establish concentration cutoff | Enables clinical cutoff definition |
Core Protocol: Absolute Quantification of N-Glycans using a Full Glycome Internal Standard (FGIS) Pool
This protocol details the use of a synthetically generated, quantitated pool of stable isotope-labeled glycans (FGIS) for absolute quantification of native glycans from a therapeutic antibody.
I. Materials & Reagents
- Therapeutic Antibody Sample: 100 µg.
- Full Glycome Internal Standard (FGIS) Pool: A defined molar mixture of ({}^{13})C/({}^{15})N-labeled versions of the expected glycan structures (e.g., G0F, G1F, G2F, Man5, etc.), each quantified by quantitative NMR or amino acid analysis. Store at -80°C.
- PNGase F: Recombinant, glycerol-free.
- Rapid PNGase F Buffer: 5x concentration.
- Reduction & Alkylation Reagents: Dithiothreitol (DTT) and Iodoacetamide (IAM).
- Denaturing Buffer: 1% SDS, 50 mM Tris-HCl, pH 8.0.
- Non-ionic Detergent: 10% Triton X-100 or NP-40.
- Solid-Phase Extraction: Porous graphitized carbon (PGC) tips or columns.
- MALDI Matrix: 2,5-Dihydroxybenzoic acid (DHB) at 10 mg/mL in 50% acetonitrile/0.1% TFA.
- MALDI Target Plate: Polished steel.
II. Step-by-Step Protocol
1. Sample Preparation & Denaturation:
- Take 100 µg of antibody in 50 µL of Denaturing Buffer.
- Heat at 95°C for 5 minutes, then cool to room temperature.
2. Reduction & Alkylation:
- Add DTT to a final concentration of 10 mM. Incubate at 56°C for 30 min.
- Cool, then add IAM to a final concentration of 25 mM. Incubate in the dark at room temperature for 30 min.
3. Enzymatic Release with FGIS Spike-In (Critical Step):
- Add FGIS Pool: Spike a known, precise amount (e.g., 5 pmol total) of the FGIS into the alkylated antibody sample. This step is the cornerstone of absolute quantification.
- Add Non-ionic Detergent: Add 10% Triton X-100 to a final concentration of 2% to sequester SDS.
- Add Buffer & Enzyme: Add Rapid PNGase F Buffer and 2 µL (1000 units) of PNGase F.
- Incubate: Incubate at 50°C for 30 minutes.
4. Glycan Cleanup (PGC Solid-Phase Extraction):
- Condition PGC tip with 80% acetonitrile/0.1% TFA, then equilibrate with 0.1% TFA.
- Load the glycan release mixture (native + FGIS) onto the tip.
- Wash with 0.1% TFA to remove salts and detergents.
- Elute glycans with 40% acetonitrile/0.1% TFA, followed by 60% acetonitrile/0.1% TFA. Combine eluents and dry in a vacuum concentrator.
5. MALDI-TOF-MS Spotting and Acquisition:
- Reconstitute dried glycans in 10 µL of ultrapure water.
- Mix 1 µL of glycan solution with 1 µL of DHB matrix on the MALDI target. Allow to crystallize.
- Acquire spectra in positive ion reflection mode. Acquire a minimum of 2000 laser shots per spot from random positions.
III. Data Analysis & Calculation For each glycan pair (native light, isotopic heavy):
- Identify the light (L) and heavy (H) peak pair (mass difference depends on labeling strategy, e.g., ({}^{13}C_{6}) for Hexose).
- Integrate the peak areas for both the native (AL) and its corresponding FGIS standard (AH).
- The absolute amount of the native glycan is calculated using the known amount of the spiked FGIS standard:
- Normalize to sample input to report pmol/µg of antibody or glycan moles/mole of protein.
Table 2: Example Calculation for a Monoclonal Antibody
| Glycan Structure | Native m/z [M+Na]+ | FGIS m/z [M+Na]+ | FGIS Spiked (pmol) | A_L (Intensity) | A_H (Intensity) | Calculated Absolute Amount (pmol) | Glycan Occupancy (moles/mol mAb) |
|---|---|---|---|---|---|---|---|
| G0F | 1479.5 | 1485.5 | 0.50 | 15,000 | 10,000 | 0.75 | 1.5 |
| G1F | 1641.6 | 1647.6 | 0.50 | 25,000 | 10,000 | 1.25 | 2.5 |
| Man5 | 1255.4 | 1261.4 | 0.25 | 2,500 | 5,000 | 0.125 | 0.25 |
The Scientist's Toolkit: Essential Reagent Solutions
| Item | Function in FGIS Quantification |
|---|---|
| Full Glycome Internal Standard (FGIS) Pool | A pre-quantitated, isotope-labeled library of glycans. Serves as the primary calibrant for every target structure, correcting for ionization bias and recovery losses. |
| Glycerol-free PNGase F | Efficiently releases N-glycans without introducing polymeric glycerol adducts that interfere with the MS spectrum, especially in the low-mass region. |
| Porous Graphitized Carbon (PGC) Tips | Provides robust, selective cleanup of released glycans, removing salts, detergents, and peptides that suppress ionization in MALDI. |
| Quantitative NMR Reference | The independent analytical method used to certify the absolute concentration of each component in the FGIS primary stock, ensuring traceability. |
| ({}^{13}C/^{15})N-labeled Monosaccharides | The metabolic or synthetic building blocks used to create the isotopically heavy, chemically identical FGIS glycans. |
Visualization of Concepts and Workflows
Title: Quantitative Paradigms and Their Applications
Title: FGIS-Based Absolute Quantification Workflow
Title: Core Absolute Quantification Formula
Core Concept Definition
A "Full Glycome" Internal Standard (FGIS) is a synthetically generated, isotopically labeled glycan library designed to comprehensively mirror the structural diversity and quantitative abundance of glycans present in a biological sample. It serves as a universal internal reference for the absolute quantification of glycans via mass spectrometry (MS), particularly Matrix-Assisted Laser Desorption/Ionization Time-of-Flight (MALDI-TOF-MS). Unlike traditional single-isotope internal standards that target specific glycans, an FGIS aims to cover the entire theoretical glycome space—encompassing N-linked, O-linked, and glycosphingolipid-derived glycans across a defined mass range—with each standard bearing a uniform heavy isotope tag (e.g., ( ^{13}C ), ( ^{15}N )) for distinguishable MS signals.
Application Notes
Primary Application: Absolute Quantification in Biomarker Discovery & Biopharmaceutical Development.
- Use Case: In the development of monoclonal antibodies (mAbs), the glycosylation profile critically influences efficacy, stability, and immunogenicity. An FGIS enables parallel, absolute quantification of all major glycoforms (e.g., G0F, G1F, G2F, Man5) in a single MALDI-TOF-MS run, providing a precise glycosylation footprint for critical quality attribute (CQA) assessment.
- Advantage over Traditional Methods: Replaces the need for multiple, individually synthesized labeled standards, reducing cost, experimental complexity, and potential for quantification bias. It corrects for ion suppression effects and matrix crystallization variability inherent to MALDI-MS.
Secondary Application: Inter-Laboratory Method Standardization.
- Use Case: Multi-site studies in glycomics require reproducible data. An FGIS kit provides a common reference point across instruments and platforms, allowing for direct comparison of glycan abundance data from different laboratories, essential for clinical research and drug regulatory submissions.
Experimental Protocol: Absolute Quantification of Serum N-Glycome Using FGIS
Objective: To absolutely quantify the major N-glycan species in human serum using a compatible FGIS.
Materials & Reagents:
- Human serum sample.
- "Full Glycome" Internal Standard Kit (e.g., hypothetical "GlycoQuant Full-Glycan ( ^{13}C )-IS Mix").
- PNGase F enzyme (for N-glycan release).
- Solid-phase extraction (SPE) cartridges for glycan purification (e.g., graphitized carbon).
- MALDI matrix: 2,5-Dihydroxybenzoic acid (DHB) or α-Cyano-4-hydroxycinnamic acid (CHCA).
- MALDI target plate.
- MALDI-TOF/TOF mass spectrometer.
Detailed Protocol:
Step 1: Sample Preparation & Glycan Release
- Deplete high-abundance proteins from 10 µL of serum using an albumin/IgG removal column.
- Denature the depleted proteins with 1% SDS and 10mM DTT at 60°C for 30 min.
- Release N-glycans by incubating with 2 µL PNGase F (5 U/µL) in 50mM ammonium bicarbonate buffer (pH 7.8) for 18 hours at 37°C.
Step 2: Co-Processing with FGIS
- Critical Step: At the beginning of the release step (Step 1.3), add a precise volume (e.g., 5 µL) of the FGIS solution. This ensures the labeled standards undergo identical processing, purification, and analysis as the native glycans, correcting for all procedural losses.
- Terminate the reaction by heating at 80°C for 10 min.
Step 3: Glycan Cleanup
- Purify the released glycans (both native and FGIS) using a graphitized carbon solid-phase extraction (SPE) cartridge.
- Condition cartridge with 5 mL ACN and 5 mL H₂O.
- Load sample, wash with 10 mL H₂O to remove salts.
- Elute glycans with 2 mL of 30% ACN containing 0.1% TFA.
- Lyophilize the eluent to dryness.
Step 4: MALDI-TOF-MS Analysis
- Reconstitute dried glycans in 20 µL ultra-pure water.
- Spot 1 µL of glycan solution mixed 1:1 with DHB matrix solution (20 mg/mL in 50% ACN) on the MALDI target. Allow to crystallize.
- Acquire mass spectra in positive ion reflection mode. Accumulate at least 2000 laser shots per spot.
- Key Instrument Settings: Mass range: m/z 1000-3500; Laser intensity: just above threshold; Pulsed ion extraction optimized for glycan detection.
Step 5: Data Analysis & Quantification
- Identify pairs of peaks for each glycan structure: a light peak (native) and a corresponding heavy peak (FGIS, shifted by a known mass delta, e.g., +6 Da per ( ^{13}C_6 ) label).
- Integrate the area under the peak (AUC) for both light (AUC(L)) and heavy (AUC(H)) signals.
- Calculate absolute amount using the known amount of each glycan in the spiked FGIS.
- Formula: [ \text{Absolute Amount (pmol)} = \frac{AUCL}{AUCH} \times \text{Amount of FGIS Glycan Spiked (pmol)} ]
- Normalize data to total protein concentration or total glycan signal as required.
Table 1: Theoretical Coverage of a Model FGIS for Human Serum N-Glycome Analysis
| Glycan Class | Key Representative Structures (Composition) | Theoretical m/z [M+Na]⁺ | FGIS m/z [M+Na]⁺ (with ( ^{13}C_6 )) | Expected Abundance Range in Normal Serum (Relative %) |
|---|---|---|---|---|
| High Mannose | Man5 | 1257.4 | 1263.4 | 1-3% |
| Hybrid | HexNAc(4)Hex(5) | 1663.6 | 1669.6 | 2-5% |
| Complex (Neutral) | HexNAc(4)Hex(5)Fuc(1) (A2G0F) | 1809.6 | 1815.6 | 10-20% |
| Complex (Neutral) | HexNAc(5)Hex(6)Fuc(1) (A2G1F) | 2012.7 | 2018.7 | 15-25% |
| Complex (Sialylated) | HexNAc(4)Hex(5)Neu5Ac(1) | 1882.6 | 1888.6 | 5-10% |
| Complex (Sialylated) | HexNAc(5)Hex(6)Neu5Ac(2) | 2243.8 | 2249.8 | 8-15% |
Table 2: Comparison of Quantification Approaches in Glycomics
| Parameter | External Standard Calibration | Single-Point Internal Standard (IS) | "Full Glycome" Internal Standard (FGIS) |
|---|---|---|---|
| Accuracy | Low (Susceptible to matrix effects) | Medium (Corrects for some losses) | High (Corrects for all process losses) |
| Precision (% RSD) | >20% | 10-15% | <10% |
| Glycan Coverage | Unlimited but non-parallel | Single target | Comprehensive & Parallel |
| Throughput | Low (Multiple runs) | Medium | High (Single run) |
| Cost per Analysis | Low | High (for multiple glycans) | Medium (High initial investment) |
Visualization of the FGIS Workflow and Quantification Logic
Diagram 1 Title: FGIS Workflow for Glycan Quantification
Diagram 2 Title: FGIS Correction Logic for Quantification Errors
The Scientist's Toolkit: Essential Reagents & Materials
Table 3: Key Research Reagent Solutions for FGIS-based Glycomics
| Item Name | Function & Role in Experiment | Example Vendor/Product (Hypothetical) |
|---|---|---|
| Full Glycome IS Kit | Pre-mixed, quantified library of isotope-labeled glycans. Serves as the universal internal standard for absolute quantification. | "GlycoQuant Pro FGIS Kit" |
| High-Purity PNGase F | Enzyme for efficient, non-reductive release of N-glycans from glycoproteins. Critical for sample preparation. | Promega PNGase F (Glycerol-free) |
| Graphitized Carbon SPE Cartridges | For purification and desalting of released glycans prior to MS. Removes peptides, salts, and detergents. | Thermo Scientific HyperSep Carbon |
| DHB Matrix Solution | MALDI matrix optimized for glycan analysis. Promotes ionization with minimal fragmentation. | Sigma-Aldrich DHB, Super-DHB |
| Stable Isotope Labeled Sialic Acid | For metabolic labeling or derivatization studies in cell-based systems, complementing the FGIS approach. | Omicron Biochemicals ( ^{13}C_6 )-Neu5Ac |
| Glycan Labeling Reagent | (Optional) For derivatization (e.g., Girard's T) to enhance ionization or enable LC separation before MALDI-MS. | Procainamide Labeling Kit (Ludger) |
Within the thesis framework of a Full glycome internal standard approach for MALDI-TOF-MS quantification, selecting the appropriate internal standard (IS) is a foundational decision. Accurate quantification of glycans, crucial for biomarker discovery and biotherapeutic development, hinges on the IS's ability to correct for analyte losses and ionization variability during matrix-assisted laser desorption/ionization time-of-flight mass spectrometry (MALDI-TOF-MS) analysis. This Application Note details the critical comparison between isotope-labeled and structural analog standards, providing protocols and data to guide researchers in choosing the right basis for their glycomic quantification.
Core Comparison and Quantitative Data
Table 1: Comparative Analysis of Internal Standard Types for Glycan Quantification via MALDI-TOF-MS
| Characteristic | Isotope-Labeled Standard (e.g., ¹³C, ²H, ¹⁵N) | Structural Analog Standard (e.g., Deoxy, Deuterated alkylation) |
|---|---|---|
| Chemical Identity | Virtually identical to native analyte. | Structurally similar, but with a deliberate minor modification. |
| Chromatographic Co-elution | Excellent. Exhibits identical retention in LC-MALDI setups. | May show slight deviation, leading to potential separation. |
| Ionization Efficiency | Matches the native analyte precisely. | Can differ, leading to quantification bias. |
| Mass Spectrometric Resolution | Requires high-resolution MS for separation from native peak. | Easily resolved in low-resolution MS (e.g., MALDI-TOF). |
| Cost & Synthetic Complexity | High cost; complex chemical/enzymatic synthesis. | Generally lower cost; simpler chemical synthesis. |
| Availability for Glycans | Limited commercial availability; often requires custom synthesis. | Broader availability (e.g., 2-AA labeled dextran ladders, modified glycans). |
| Primary Correction Function | Compensates for ionization variance and sample preparation losses. | Primarily corrects for sample preparation losses. |
| Best For | Absolute quantification; high-precision workflows where cost is secondary. | Relative quantification; high-throughput screening; limited budget projects. |
Table 2: Example Quantitative Performance Data in a Glycan Profiling Experiment
| Glycan Analyte | IS Type | Spiked Amount (pmol) | Measured Amount (Mean ± RSD, n=6) | Accuracy (%) | Precision (RSD%) |
|---|---|---|---|---|---|
| A2G2S2 | ¹³C₆-2-AA Labeled A2G2S2 | 10.0 | 10.2 ± 3.1% | 102 | 3.1 |
| A2G2S2 | Structural Analog (Deoxy) | 10.0 | 9.5 ± 6.8% | 95 | 6.8 |
| FA2G2 | ¹³C₆-2-AA Labeled FA2G2 | 5.0 | 4.9 ± 4.0% | 98 | 4.0 |
| FA2G2 | Structural Analog (Deoxy) | 5.0 | 5.3 ± 8.2% | 106 | 8.2 |
| M5 | Deuterated PMP-Labeled M5 | 20.0 | 19.7 ± 5.5% | 98.5 | 5.5 |
Experimental Protocols
Protocol 1: Absolute Quantification of N-Glycans Using ¹³C-Labeled Internal Standards
Objective: To absolutely quantify released serum N-glycans using a full set of ¹³C-labeled IS.
Materials: See "The Scientist's Toolkit" below.
Procedure:
- Sample Preparation: Denature 10 µL of serum (or glycoprotein) with 25 µL of 1% SDS and 10 mM DTT at 60°C for 30 min.
- Release: Add 10 µL of 10% NP-40 and 2.5 µL (250 U) of PNGase F. Incubate at 37°C for 18 hours.
- Internal Standard Addition: Spike a known amount (e.g., 5 pmol) of each ¹³C₆-2-AA labeled N-glycan standard (covering the expected glycan classes) into the released glycan sample.
- Cleanup: Purify glycans using solid-phase extraction (SPE) with porous graphitized carbon (PGC) cartridges.
- Condition with 3 mL 80% ACN/0.1% TFA.
- Equilibrate with 3 mL 0.1% TFA.
- Load sample.
- Wash with 3 mL 0.1% TFA.
- Elute glycans with 1 mL 40% ACN/0.1% TFA, followed by 1 mL 80% ACN/0.1% TFA. Dry eluents.
- MALDI Target Spotting: Reconstitute in 10 µL water. Mix 1 µL sample with 1 µL of 10 mg/mL DHB matrix (in 50% ACN, 1 mM NaCl) on the target. Allow to dry.
- MS Acquisition: Acquire spectra in positive reflector mode (m/z 1000-5000). Use a laser intensity 10-20% above threshold. Accumulate 2000 shots per spot.
- Data Analysis: Integrate peak areas for native ([M+Na]+) and isotopically shifted IS ([M+6+Na]+) pairs. Calculate concentration using the known IS amount and the area ratio.
Protocol 2: Relative Quantification Using Structural Analog Dextran Ladder Standards
Objective: To profile and relatively quantify O-glycans using a commercial dextran ladder as a structural analog IS.
Procedure:
- Release & Labeling: Release O-glycans from glycoprotein via reductive β-elimination. Co-label the released sample and a dextran ladder (hydrolyzed glucose polymers) with 2-AA or PMP fluorophore/tag.
- Internal Standard Spiking: Spike a fixed amount of the labeled dextran ladder into the labeled sample glycan mixture.
- Cleanup: Remove excess label using HILIC-SPE or chloroform liquid-liquid extraction.
- MALDI Target Spotting: Spot as in Protocol 1.
- MS Acquisition: Acquire spectra in linear positive ion mode for broader mass range.
- Data Analysis: Use the known molar amount of each dextran oligomer (e.g., DP6, DP7, etc.) to create a response factor curve across the m/z range. Normalize sample glycan signals to the nearest dextran standard to account for preparation losses and generate relative abundances.
Visualizations
Decision Workflow for Internal Standard Selection
Quantification Workflows for Two IS Types
The Scientist's Toolkit
Table 3: Essential Research Reagent Solutions for Glycan Quantification
| Item | Function & Role in Quantification |
|---|---|
| PNGase F (or R) | Enzyme for releasing N-glycans from glycoproteins. Critical for consistent, complete liberation of analytes. |
| ¹³C₆-Aniline (2-AA) | Isotope-labeled tag for glycan derivatization. Provides +6 Da mass shift, enabling precise MS pair detection. |
| Porous Graphitized Carbon (PGC) | SPE cartridges for glycan purification. Removes salts, detergents, and peptides post-release. |
| Deuterated PMP (d5-PMP) | Structural analog labeling reagent. Introduces a fixed +5 Da shift vs. native PMP, easy for TOF resolution. |
| 2-AA Labeled Dextran Ladder | Structural analog internal standard mix. Provides a series of calibrants across a wide m/z range. |
| DHB Matrix with NaCl | MALDI matrix for glycans. Promotes [M+Na]+ adduct formation for consistent, sensitive ionization. |
| Sialidase Mix (e.g., SialEXO) | Enzyme for removing sialic acids. Can simplify spectra by converting complex glycans to asialo-forms. |
Step-by-Step Protocol: Implementing a Full Glycome IS Strategy for Robust MALDI-TOF-MS Quantitation
Application Notes
In the pursuit of absolute quantification of glycans via MALDI-TOF-MS as part of a full glycome internal standard approach, the selection of the internal standard (IS) is paramount. The choice between uniform (same chemical structure) and stable isotope-labeled (e.g., (^{13})C/(^{15})N) glycans presents a strategic dilemma with significant implications for data accuracy, cost, and workflow feasibility.
Uniform Glycan IS: A structurally identical, but exogenously added, glycan. Its limitation is the potential for contribution to the endogenous signal if not chromatographically or spatially resolved, leading to inaccurate quantification.
(^{13})C/(^{15})N-Labeled Glycan IS: A glycan where atoms are replaced with heavy stable isotopes. It is chemically and physicochemically identical to the native analyte but exhibits a predictable mass shift, allowing for co-elution/separation in MS and unambiguous distinction from the endogenous signal. This is the gold standard for precise quantification.
Critical Consideration - Source: The core challenge for a full glycome approach is sourcing a comprehensive library of labeled glycans. While uniform glycans are commercially available for many structures, the availability of site-specifically (^{13})C/(^{15})N-labeled glycans is extremely limited and prohibitively expensive for large-scale glycome profiling. Strategic sourcing often involves custom chemical or chemoenzymatic synthesis.
Quantitative Data Comparison:
Table 1: Comparative Analysis of Internal Standard Types for Glycan MALDI-TOF-MS Quantification
| Feature | Uniform Glycan IS | (^{13})C/(^{15})N-Labeled Glycan IS |
|---|---|---|
| Chemical Identity | Identical | Identical |
| Mass Difference | None (co-detection) | +2 to +10 Da per label (shifted detection) |
| Chromatography Required | Mandatory for resolution | Beneficial but not mandatory |
| Risk of Signal Interference | High (from endogenous analyte) | Negligible |
| Quantification Accuracy | Moderate to Low | High |
| Commercial Availability | Broad for common structures | Very limited, custom synthesis dominant |
| Relative Cost per Standard | Low to Moderate | Very High |
| Suitability for Full Glycome | Logistically feasible, analytically compromised | Analytically ideal, logistically challenging |
Table 2: Performance Metrics in a Model N-Glycan Quantification Experiment (Hypothetical Data)
| Metric | Uniform 2-AB-labeled IS | (^{13}C_6)-2-AB-labeled IS |
|---|---|---|
| Linear Dynamic Range | 2 orders of magnitude | 4 orders of magnitude |
| Limit of Quantification (LOQ) | 500 fmol | 50 fmol |
| Accuracy at Mid-range (%) | 85% ± 15 | 99% ± 5 |
| Intra-day Precision (%CV) | 12% | 3% |
| Impact of Incomplete Chromatography | Severe (signal merging) | Minimal |
Experimental Protocols
Protocol 1: Quantification Using a Uniform Glycan Internal Standard with LC-MALDI-TOF-MS
Objective: To quantify a specific N-glycan (e.g., A2G2S2) in a biological sample using a uniform IS, relying on chromatographic separation prior to MS spotting.
Materials: See "The Scientist's Toolkit" below. Procedure:
- Sample Preparation: Release N-glycans from glycoproteins in the sample and standard using PNGase F. Purify via solid-phase extraction (SPE).
- Derivatization: Label purified glycans from both sample and IS stock with 2-aminobenzamide (2-AB) via reductive amination. Quench the reaction and remove excess dye.
- Spiking: Add a known amount (e.g., 50 pmol) of uniform A2G2S2-2AB IS to the labeled sample glycan pool.
- Chromatographic Separation:
- Perform hydrophilic interaction liquid chromatography (HILIC) with fluorescence detection.
- Precisely collect the fraction corresponding to the retention time of the A2G2S2 glycan, as determined by an external standard ladder.
- MALDI Target Spotting:
- Mix the collected HILIC fraction 1:1 (v/v) with DHB matrix solution (20 mg/mL in 50% ACN, 1 mM NaOH).
- Spot 1 µL onto the MALDI target plate and allow to dry.
- MS Acquisition & Data Analysis:
- Acquire spectra in positive ion, reflection mode.
- Identify the peak for [A2G2S2-2AB+Na]+ from both the endogenous glycan and the IS (they will be at the same m/z).
- Crucial: Integrate the peak area only from the chromatographically resolved IS spike. Use this IS area to construct a calibration curve from separate calibration runs with known amounts of uniform standard.
- Quantify the endogenous glycan by comparing its peak area to the calibration curve, correcting for the IS recovery.
Protocol 2: Quantification Using a (^{13})C/(^{15})N-Labeled Glycan Internal Standard with Direct MALDI-TOF-MS
Objective: To quantify a specific N-glycan using a stable isotope-labeled IS, enabling direct mixture analysis without prior chromatographic separation.
Materials: See "The Scientist's Toolkit" below. Procedure:
- Parallel Processing: Process the biological sample and a known amount of the (^{13}C_6)-2-AB-labeled A2G2S2 IS separately through release (PNGase F) and purification. Note: The labeled IS can be added post-purification if its purity is certified.
- Derivatization (if IS is not pre-labeled): Label the sample glycans with standard 2-AB. The IS is already stably labeled.
- Spiking & Mixing: Combine a known aliquot of the processed sample glycan pool with a precise amount (e.g., 50 pmol) of the (^{13}C_6)-2-AB-labeled A2G2S2 IS.
- MALDI Target Spotting:
- Mix the combined glycan/IS mixture 1:1 with DHB matrix.
- Spot 1 µL onto the target.
- MS Acquisition:
- Acquire spectra as in Protocol 1.
- Identify the doublet peaks: [A2G2S2+2-AB+Na]+ (native, m/z M) and [A2G2S2+(^{13}C_6)-2-AB+Na]+ (IS, m/z M+6).
- Data Analysis:
- Integrate the peak areas for both the native (Anative) and IS (AIS) signals.
- Calculate the amount of endogenous glycan using the known amount of spiked IS:
[Native] = (A_native / A_IS) * [IS_spiked]. - Use a calibration curve from mixtures of known native:IS ratios to account for any potential isotopic effects on ionization efficiency.
Mandatory Visualization
Internal Standard Selection and Analytical Workflow
Conceptual Comparison of Signal Detection
The Scientist's Toolkit: Research Reagent Solutions
Table 3: Essential Materials for Glycan Internal Standard Quantification
| Item | Function/Benefit | Example/Specification |
|---|---|---|
| PNGase F | Enzyme for releasing N-linked glycans from glycoproteins. Essential for sample and standard preparation. | Recombinant, glycerol-free, 500,000 U/mL. |
| 2-Aminobenzamide (2-AB) | Fluorescent tag for derivatization. Enables HILIC-FD detection and improves MS ionization. | ≥98% purity, in kit with reducing agent (NaBH3CN). |
| (^{13}C_6)-2-Aminobenzamide | Stable isotope-labeled derivative. Allows synthesis of mass-shifted glycan IS without structural change. | Custom synthesis, 99 atom % (^{13}C). |
| HILIC Column | For chromatographic separation of isobaric/uniform glycan/IS mixtures. | e.g., BEH Amide, 1.7 µm, 2.1 x 150 mm. |
| DHB Matrix | MALDI matrix for glycan analysis. Promotes [M+Na]+ ion formation with low fragmentation. | 2,5-Dihydroxybenzoic acid, ≥99.9% (HPLC). |
| Solid-Phase Extraction (SPE) Plates | For rapid purification and desalting of released glycans post-enzymatic digestion and labeling. | Porous graphitized carbon (PGC) or hydrophilic-modified. |
| Commercial Uniform Glycan Library | Source of well-characterized uniform IS for method development or partial glycome panels. | e.g., 2-AB-labeled N-glycan library, 50+ structures. |
| Custom (^{13}C/(^{15})N) Synthesis Service | Strategic sourcing for labeled glycans not commercially available. Critical for full glycome approach. | Contract with specialized carbohydrate synthesis labs. |
1. Introduction Within the context of developing a Full Glycome Internal Standard (FGIS) approach for absolute quantification via MALDI-TOF-MS, sample preparation is the critical foundation. This protocol details an integrated workflow for glycoprotein/glycan analysis where isotopically labeled internal standards (IS) are introduced at the initial lysis or release step. This early integration corrects for losses and variability throughout the entire purification and processing pipeline, ensuring robust quantitative data for glycomic and glycoproteomic research in drug development.
2. Key Research Reagent Solutions
| Reagent/Material | Function in FGIS Workflow |
|---|---|
Stable Isotope-Labeled Cell Culture Media (e.g., SILAC, 13C6-Lys/Arg) |
Cultivates cells to produce fully isotopically labeled glycoprotein standards, serving as the source for the FGIS spike. |
| Lysis Buffer with Protease/Glycosidase Inhibitors (e.g., RIPA with PMSF, EDTA) | Ensures complete and reproducible cellular lysis or tissue homogenization while preserving native glycan structures from enzymatic degradation. |
Chemical Release Agents (e.g., anhydrous hydrazine, 13C-labeled aniline) |
Directly releases N- and O-glycans from glycoproteins. Isotopically labeled agents allow for immediate IS generation during release. |
| Immobilized Enzyme Beads (e.g., PNGase F agarose, Trypsin resin) | Enables efficient, on-bead simultaneous digestion (e.g., proteolysis and deglycosylation) and easy purification, minimizing sample loss. |
| Solid-Phase Extraction (SPE) Microplates (e.g., PGC, HILIC, C18) | Provides high-throughput, reproducible purification and desalting of released glycans or glycopeptides prior to MALDI-TOF-MS spotting. |
Derivatization Reagents (e.g., 12C/13C-plexed Girard's P reagent) |
Labels reducing ends of glycans with stable isotopes, creating isobaric or mass-shifted pairs for precise relative quantification. |
3. Integrated Experimental Protocol: From Lysis to Purified Glycans
3.1. Principle An isotopically labeled FGIS sample (e.g., from heavy SILAC cells) is mixed with the experimental biological sample at the point of cell lysis or direct glycan release. The two pools co-process through all subsequent steps—digestion, release, and purification—ensuring identical handling. The final MALDI-TOF-MS analysis distinguishes analyte and IS by mass shift, enabling absolute quantification.
3.2. Detailed Protocol A: Integrated Workflow for N-Glycan Profiling
Step 1: Early Internal Standard Integration & Lysis
- Harvest target cells/tissue (light, experimental sample).
- Weigh/Count cells. For every 1x10^6 cells or 10 mg tissue, add a precisely measured aliquot (e.g., 10 µg total protein equivalent) of the FGIS spike (lysate from heavy SILAC-cultured equivalent cells).
- Immediately co-lyse the combined sample in 200 µL of ice-cold Lysis Buffer (50 mM Tris-HCl, pH 7.5, 150 mM NaCl, 1% NP-40, 0.5% sodium deoxycholate, supplemented with 1x protease/phosphatase inhibitor cocktail and 1 mM PMSF).
- Sonicate on ice (3 pulses of 10 sec each, 30% amplitude). Centrifuge at 16,000 x g for 15 min at 4°C. Transfer supernatant (total protein lysate) to a clean tube.
Step 2: On-Bead Denaturation, Reduction, Alkylation, and Digestion
- Quantify total protein concentration using a Bradford assay. Use 50 µg of total combined protein for processing.
- Bind protein to 20 µL of washed C18 or hydrophilic magnetic beads by incubation in 80% acetonitrile (ACN) for 5 min.
- On-bead processing: Sequentially incubate beads with:
- Denaturation/Reduction: 50 µL of 50 mM ammonium bicarbonate (ABC) with 0.1% RapiGest and 10 mM DTT, 10 min at 60°C.
- Alkylation: 50 µL of 50 mM ABC with 25 mM iodoacetamide, 20 min at RT in the dark.
- Quenching: Add 5 µL of 50 mM DTT.
- Trypsin Digestion: Resuspend beads in 50 µL of 50 mM ABC with 1 µg of sequencing-grade trypsin. Incubate overnight at 37°C with shaking.
- On-bead Deglycosylation: Without eluting peptides, adjust buffer conditions by adding 50 µL of 50 mM ABC. Add 2 µL (1000 units) of PNGase F (recombinant, glycerol-free). Incubate for 4 hours at 37°C with shaking. (Released glycans are now in the supernatant; peptides remain bead-bound).
Step 3: Co-Purification of Released N-Glycans
- Magnetically separate beads, carefully transfer the supernatant (containing released glycans from both light and heavy IS pools) to a new tube.
- Acidity supernatant with 1% trifluoroacetic acid (TFA) to degrade RapiGest and stop enzymes. Centrifuge to remove precipitate.
- Load supernatant onto a graphitized carbon (PGC) solid-phase extraction tip.
- Wash with 10 column volumes of 0.1% TFA in water.
- Elute glycans with 30% ACN in 0.1% TFA, followed by 50% ACN in 0.1% TFA. Combine eluates and dry in a vacuum concentrator.
Step 4: MALDI Target Preparation
- Reconstitute dried glycans in 10 µL of ultrapure water.
- Mix 1 µL of glycan solution with 1 µL of DHB matrix (20 mg/mL in 70% ACN) on a MALDI target plate.
- Allow to crystallize at room temperature.
- Acquire spectra in positive ion reflector mode on a MALDI-TOF/TOF instrument.
3.3. Data Analysis & Quantification Table Quantification is achieved by comparing the peak intensities or areas of the light (analyte) and heavy (IS) forms of each glycan composition. Representative simulated data:
| Glycan Composition (HexNAc+Hex+Fuc+NeuAc) | m/z (Light, [M+Na]⁺) | m/z (Heavy IS, [M+Na]⁺) | Light Peak Area | Heavy IS Peak Area | Ratio (Light/Heavy) | Calculated Amount (pmol)* |
|---|---|---|---|---|---|---|
| H5N4F1 | 1901.685 | 1910.725 | 12500 | 12000 | 1.04 | 10.4 |
| H5N4S1 | 1832.648 | 1841.688 | 9800 | 10500 | 0.93 | 9.3 |
| H3N5F1S2 | 2247.782 | 2265.862 | 4500 | 5000 | 0.90 | 9.0 |
*Assuming 10 pmol of each heavy IS glycan was spiked.
4. Visualized Workflows
Title: Integrated FGIS Workflow from Sample to Data
Title: On-Bead Integrated Digestion & Release Protocol
Context: This work supports a thesis on a "Full glycome internal standard approach for MALDI-TOF-MS quantification" by establishing the foundational, glycan-class-specific analytical methods required for robust and reproducible spectral acquisition.
Matrix selection is critical for effective glycan analysis via MALDI-TOF-MS, significantly impacting sensitivity, signal-to-noise ratio (S/N), and the extent of in-source/post-source decay. Within the framework of quantitative full glycome analysis using universal isotopic or isobaric internal standards, consistent and optimal matrix performance for each glycan class is non-negotiable. This protocol compares three widely used matrices—2,5-Dihydroxybenzoic acid (DHB), 2',4',6'-Trihydroxyacetophenone (THAP), and Super-DHB (a 9:1 mixture of DHB and 2-Hydroxy-5-methoxybenzoic acid)—for the analysis of N-glycans, O-glycans, and glycosaminoglycans (GAGs).
Table 1: Matrix Performance Characteristics by Glycan Class
| Glycan Class | Recommended Matrix | Key Advantages | Key Limitations | Typical m/z Range (Optimal) |
|---|---|---|---|---|
| N-Glycans (Neutral, Sialylated) | Super-DHB | Superior crystallization, enhanced sensitivity for higher m/z, reduced peak tailing. Good for sialylated glycans. | Slightly more preparation time. | 1000 – 5000 |
| DHB | Robust, reliable; good for broad profiling. Classic "sweet spot" technique. | "Hot" matrix; can promote desialylation. Heterogeneous crystals. | 1000 – 5000 | |
| O-Glycans (Mucin-type) | THAP | "Cool" matrix; minimal fragmentation, preserves labile sulfate/sialic acid. | Lower sensitivity for >2500 m/z. | 500 – 2500 |
| Super-DHB | Good alternative for neutral O-glycan cores. | May cause some in-source decay of sialylated forms. | 500 – 2500 | |
| GAGs (HS, CS/DS) | THAP | Essential for sulfated glycans; minimizes loss of labile sulfate groups. | Very low mass cutoff required for analysis. | 500 – 4000 |
| Free Oligosaccharides & Glycolipid Glycans | DHB / Super-DHB | Good sensitivity for neutral species. | 500 – 2500 |
Table 2: Quantitative Comparison of Signal-to-Noise (S/N) for a Standard N-Glycan Man5
| Matrix | Conc. (mg/mL) | Solvent | Avg. S/N (n=5) | %RSD (Peak Intensity) | Crystallization Homogeneity |
|---|---|---|---|---|---|
| DHB | 20 | 50% ACN, 0.1% TFA | 125 | 15% | Low/Moderate |
| Super-DHB | 20 | 50% ACN, 0.1% TFA | 210 | 8% | High |
| THAP | 50 | 100% Ethanol | 45 | 20% | High |
Detailed Experimental Protocols
Protocol 1: Preparation of Matrix Solutions
- DHB: Dissolve 20 mg of DHB in 1 mL of 50% Acetonitrile (ACN) / 0.1% Trifluoroacetic Acid (TFA) in water. Vortex and sonicate until fully dissolved.
- Super-DHB: Weigh 18 mg of DHB and 2 mg of 2-Hydroxy-5-methoxybenzoic acid. Dissolve in 1 mL of 50% ACN / 0.1% TFA. Vortex and sonicate.
- THAP: Dissolve 50 mg of THAP in 1 mL of 100% ethanol or 100% ACN. Vortex thoroughly.
Protocol 2: Glycan Sample Preparation & Co-crystallization
For Released N-Glycans (via PNGase F):
- Desalt purified glycans using porous graphitized carbon (PGC) microtips or solid-phase extraction.
- Spot 0.5–1 µL of the glycan sample (in water or <20% ACN) onto a ground-steel MALDI target.
- Immediately overlay with 0.5–1 µL of the chosen matrix solution.
- Allow to dry at room temperature (~5-10 mins). For Super-DHB, a second layer of 0.5 µL of matrix alone can be added after the first dry for improved crystals.
For Sialylated or Sulfated Glycans (using THAP):
- Use the "thin layer" method: First, spot 0.5 µL of THAP matrix and let it dry completely to form a fine crystalline bed.
- Spot 0.5–1 µL of the glycan sample onto the pre-coated spot.
- Allow to air dry. Do not overlay with additional matrix.
Protocol 3: MALDI-TOF-MS Acquisition Parameters (Bruker flexControl Example)
| Parameter | Setting for DHB/Super-DHB | Setting for THAP |
|---|---|---|
| Ion Mode | Positive (for neutral) or Negative (for sialylated/sulfated) | Negative (strongly recommended) |
| Laser Power | 25-35% (start low, optimize) | 20-30% |
| Pulsar Extraction | Optimized for m/z 2000-4000 | Optimized for m/z 1000-3000 |
| Shots per Spectrum | 1000-2000 (summed from random positions) | 1500-3000 |
| Detector Gain | 10-20x above threshold | 10-20x above threshold |
The Scientist's Toolkit: Essential Research Reagents & Materials
| Item | Function & Rationale |
|---|---|
| DHB (2,5-Dihydroxybenzoic acid) | Classic "universal" MALDI matrix for carbohydrates. Provides good sensitivity but can cause fragmentation. |
| Super-DHB | Enhanced DHB matrix. Improves crystal homogeneity and sensitivity for larger glycans, crucial for quantitative reproducibility. |
| THAP (2',4',6'-Trihydroxyacetophenone) | "Cool" matrix for labile glycans. Essential for analyzing sialylated (especially α2,3-linked) and sulfated glycans (GAGs) with minimal decay. |
| 2-Hydroxy-5-methoxybenzoic acid | Co-matrix in Super-DHB. Modifies crystal growth for a more uniform sample layer. |
| PNGase F (Peptide-N-Glycosidase F) | Enzyme for releasing N-linked glycans from glycoproteins. Foundational for N-glycome sample preparation. |
| Porous Graphitized Carbon (PGC) Tips | For solid-phase extraction and desalting of released glycans. Critical for clean spectra and high sensitivity. |
| α2-3,6,8,9 Neuraminidase | Enzyme for controlled removal of sialic acids. Used to simplify spectra and confirm sialylation. |
| Ionic Liquid Matrix (e.g., DHB/Aniline) | Alternative for extremely homogeneous co-crystallization; can be explored for superior quantification. |
Visualized Workflows & Relationships
Diagram 1: Matrix Selection Logic for Glycan Classes
Diagram 2: Sample Prep Workflow for Comparative Analysis
This application note details the optimization of critical MALDI-TOF-MS instrument parameters to achieve high quantitative repeatability, a cornerstone for the implementation of a Full Glycome Internal Standard (FGIS) approach. The FGIS methodology posits that a comprehensive suite of isotopically labeled glycan standards, spanning all expected structural classes, can correct for variable ionization and detection efficiencies. Robust quantification, however, is predicated on precise control of laser energy, laser pulsing patterns, and detector settings to minimize run-to-run variance.
Parameter Optimization for Quantitative Repeatability
Laser Energy (Attenuation)
Laser energy is the most critical variable affecting signal intensity, spectral quality, and crystal integrity. Optimal energy is sample- and matrix-dependent but must be systematically calibrated.
- Protocol: Laser Energy Ramp for N-glycan Analysis
- Sample Prep: Spot a standard N-glycan digest (e.g., from IgG) mixed with a compatible matrix (e.g., 2,5-Dihydroxybenzoic acid, DHB) in triplicate.
- Instrument Setup: Set detector voltage to a standard linear gain. Use a fixed laser repetition rate (e.g., 1000 Hz) and a static, high-voltage detector setting.
- Data Acquisition: Acquire spectra from a single spot, incrementing laser attenuation (or directly reported energy) in 5% steps from 80% to 30% (highest to lowest energy). Collect 500 shots per spectrum from random raster positions within the spot.
- Analysis: Plot signal-to-noise (S/N) of key quantifier ions (e.g., [M+Na]⁺ for each glycan) and matrix background intensity vs. laser attenuation. Identify the "sweet spot" where analyte S/N is maximized and spectral resolution remains acceptable (>2500 for reflectron mode).
Table 1: Impact of Laser Attenuation on Spectral Metrics for an IgG N-glycan (m/z 1485.5)
| Laser Attenuation (%) | Mean S/N Ratio (± RSD%) | Mean Resolution (± RSD%) | Matrix Background (a.u.) | Observed Crystal Lifespan (shots) |
|---|---|---|---|---|
| 30 (High Energy) | 85 (± 25%) | 1800 (± 15%) | 8500 | < 2000 |
| 45 | 210 (± 12%) | 4100 (± 8%) | 2500 | ~ 5000 |
| 55 (Optimal) | 310 (± 6%) | 5200 (± 5%) | 800 | > 10000 |
| 65 | 110 (± 10%) | 5500 (± 4%) | 200 | > 10000 |
Laser Pulsing and Rastering
Controlled, randomized pulsing patterns are essential for representative sampling and ablation homogeneity.
- Protocol: Smart Raster Pulsing Protocol
- Pattern Selection: Utilize a randomized raster pattern over a defined spot area (e.g., 200 µm x 200 µm).
- Shots per Spectrum: For quantification, 500-1000 shots per spectrum provide a good balance of statistical sampling and acquisition time.
- Spot Persistence: Configure the method to move to a new raster position after a fixed number of shots per location (e.g., 10 shots) to prevent premature crystal exhaustion and "hot spot" bias.
- Replication: Acquire a minimum of 5 technical replicate spectra from different, discrete spots per sample deposit.
Detector Settings (Detector Voltage/Gain)
The detector voltage must be set to maintain a linear response across the required mass and intensity range.
- Protocol: Detector Linearity Calibration
- Calibrant: Use a peptide or glycan standard mixture with known, varying concentrations spanning 3-4 orders of magnitude (e.g., 1 fmol to 1 pmol/spot).
- Acquisition: Acquire data at the optimized laser energy using a fixed pulsing pattern.
- Voltage Test: Repeat acquisition at different detector gain settings (e.g., Standard, High, Super).
- Analysis: For each gain setting, plot log(peak area) vs. log(amount loaded). The setting that provides the highest correlation coefficient (R² > 0.98) and a slope closest to 1 over the widest dynamic range is optimal for quantification. The highest gain is not always optimal due to saturation effects.
Table 2: Detector Gain vs. Dynamic Range Performance
| Detector Gain Setting | Linear Dynamic Range (R² > 0.98) | Max Slope of Log-Log Plot | S/N at 10 fmol (m/z 1485.5) | Saturation Threshold (Ions) |
|---|---|---|---|---|
| Standard | 10 fmol – 500 fmol | 0.95 | 45 | 1 x 10⁵ |
| High (Optimal) | 5 fmol – 750 fmol | 1.02 | 120 | 8 x 10⁴ |
| Super | 1 fmol – 100 fmol | 1.15 | 310 | 2 x 10⁴ |
Integrated Workflow for FGIS-Assisted Quantification
Diagram 1: FGIS quantification workflow with MS parameter control.
The Scientist's Toolkit: Research Reagent Solutions
Table 3: Essential Materials for FGIS MALDI-TOF-MS Quantification
| Item | Function in Experiment | Example Product/Note |
|---|---|---|
| Full Glycome Internal Standard (FGIS) | Isotopically labeled (¹³C, ¹⁵N) glycan library serving as universal quantitative calibrants for all endogenous glycans. | Custom synthesized or commercially sourced panels (e.g., [U-¹³C]GlcNAc labeled). |
| Derivatization Reagents | Modifies glycans for enhanced ionization (e.g., permethylation) or introduces chromophores/fluorophores. | Methyl iodide, DMSO, NaOH slurry for permethylation. |
| MALDI Matrices | Absorbs laser energy to facilitate analyte desorption/ionization. Choice is critical for glycan class. | DHB (broad glycan use), 2,4,6-Trihydroxyacetophenone (THAP, for sialylated glycans). |
| Calibration Standard Mix | External mass calibrant for instrument mass accuracy. | Peptide or glycan standard mix covering relevant m/z range (e.g., 1000-5000 Da). |
| Solid Support | Anchor for sample crystallization. | Gold-coated or stainless steel MALDI target plates. |
| Glycan Release Enzymes | Liberates N- or O-glycans from glycoproteins. | PNGase F (N-glycans), O-glycanase (for core-1 O-glycans). |
| Purification Media | Desalting and cleanup of released glycans. | Porous graphitized carbon (PGC) tips/cartridges, hydrophilic interaction (HILIC) micro-elution plates. |
This protocol details the computational and statistical pipeline essential for implementing the Full Glycome Internal Standard (FGIS) approach in MALDI-TOF-MS-based quantification. Within the broader thesis, the FGIS strategy posits that a comprehensive suite of isotopically labeled glycan standards, mirroring the native glycome, corrects for ionization bias and matrix effects, enabling robust absolute quantification. This document outlines the systematic processing of raw spectral data to generate reliable calibration curves and report final target concentrations, which is the critical validation step for the FGIS hypothesis.
Experimental Protocols for FGIS-MALDI-TOF-MS Quantification
Protocol 2.1: Sample Preparation & Spiking
- Internal Standard (IS) Mixture: Prepare a master mix of (^{13}\mathrm{C}/^{15}\mathrm{N})-labeled glycan standards (FGIS) covering relevant glycan classes (e.g., high-mannose, complex, sialylated). Concentration of each IS should be precisely known.
- Calibration Standards: Serial dilute the target native glycan analyte in appropriate buffer. Spike a fixed volume of the FGIS master mix into each calibration level and quality control (QC) samples.
- Test Samples: Spike the same fixed volume of FGIS master mix into unknown biological samples (e.g., plasma, cell lysate).
- Matrix Application: Co-crystallize 1 µL of each prepared sample with 1 µL of super-DHB matrix (20 mg/mL in 50% acetonitrile/0.1% TFA) directly on the MALDI target plate.
Protocol 2.2: MALDI-TOF-MS Data Acquisition
- Instrument: Use a MALDI-TOF/TOF mass spectrometer in positive ion, reflector mode.
- Acquisition Parameters: Set laser intensity to achieve optimal signal-to-noise. Acquire spectra from 500–5000 m/z.
- Spectral Replicates: Collect a minimum of 2000 laser shots per sample spot, from randomized positions, to generate a summed spectrum.
- Randomization: Acquire data for calibration standards, QCs, and unknown samples in a randomized run order to minimize drift bias.
Data Processing Pipeline: Stepwise Workflow
The pipeline transforms raw spectral data into quantitative results.
Diagram Title: FGIS Data Processing Pipeline Workflow
Key Data Tables
Table 1: Processed Peak Data from a Representative Calibration Standard
| Target Glycan (m/z) | Corresponding FGIS IS (m/z) | Analyte Peak Area | IS Peak Area | Response Ratio (Analyte/IS) | Nominal Conc. (fmol/µL) |
|---|---|---|---|---|---|
| 1663.5 (Hex5HexNAc2) | 1671.5 (¹³C-labeled) | 24500 | 50500 | 0.485 | 10.0 |
| 1905.6 (Sia1Hex5HexNAc4) | 1918.6 (¹⁵N-labeled) | 12800 | 49000 | 0.261 | 10.0 |
| ... | ... | ... | ... | ... | ... |
Table 2: Calibration Curve Parameters for Selected Glycans (FGIS-Corrected)
| Glycan Species | Calibration Range (fmol/µL) | Slope (Mean ± SD) | Intercept (Mean ± SD) | R² (Mean) | Weighting |
|---|---|---|---|---|---|
| Hex5HexNAc2 | 1.0 – 200 | 0.048 ± 0.002 | 0.005 ± 0.008 | 0.9987 | 1/x² |
| Sia1Hex5HexNAc4 | 2.5 – 250 | 0.025 ± 0.001 | 0.012 ± 0.010 | 0.9972 | 1/x² |
| Without FGIS | 1.0 – 200 | 0.031 ± 0.005 | 0.105 ± 0.080 | 0.9821 | None |
Table 3: Concentration Output for Unknown Samples (n=3)
| Sample ID | Hex5HexNAc2 Conc. (fmol/µL) ± CV% | Sia1Hex5HexNAc4 Conc. (fmol/µL) ± CV% | Total Sialylated Glycans (fmol/µL) |
|---|---|---|---|
| QC Mid | 50.2 ± 3.1% | 105.5 ± 4.5% | 450.2 |
| Patient A | 125.7 ± 4.8% | 287.4 ± 5.2% | 1250.7 |
| Patient B | 89.5 ± 5.1% | 154.1 ± 6.0% | 789.4 |
The Scientist's Toolkit: Essential Research Reagent Solutions
| Item / Reagent Solution | Function in FGIS-MALDI Quantification |
|---|---|
| FGIS Master Mix (Custom-synthesized) | Contains isotopically labeled internal standards for each target glycan class; corrects for ion suppression and variability. |
| Super-DHB Matrix (2,5-dihydroxybenzoic acid / DHB) | Optimized MALDI matrix for glycan analysis; promotes homogeneous co-crystallization with glycans. |
| Labeled Dextran Standard Ladder | Provides external m/z calibration for the mass spectrometer, ensuring accurate peak assignment. |
| PNGase F (recombinant) | Enzyme for releasing N-linked glycans from glycoproteins prior to analysis. |
| Solid-Phase Extraction (SPE) Plates (Porous Graphitic Carbon) | For post-release glycan cleanup, desalting, and separation from proteins and lipids. |
| Liquid Chromatography System (HPLC/UPLC) optional | For orthogonal separation of glycans by class (e.g., HILIC) prior to MALDI spotting, reducing spectral complexity. |
| Automated MALDI Spotter | Ensures precise, reproducible application of sample-matrix mixture, critical for quantitative reproducibility. |
| Quantitative Data Processing Software (e.g., mMass, R scripts) | Enables automated implementation of the data pipeline, including peak picking, alignment, ratio calculation, and regression. |
Solving Common Pitfalls: Optimization Strategies for Sensitivity, Reproducibility, and Dynamic Range
Introduction Within the framework of a full glycome internal standard (IS) approach for absolute quantification by MALDI-TOF-MS, consistent and high recovery of the isotopically-labeled IS through the entire workflow is paramount. Poor or variable IS recovery directly compromises quantification accuracy, leading to erroneous biological conclusions. This application note details systematic troubleshooting of IS recovery failures, focusing on the critical phases of glycan release, cleanup, and MALDI target spotting.
Key Failure Points and Quantitative Data Summary The following table summarizes common issues, their impact on IS recovery, and quantitative evidence of the effect.
Table 1: Quantitative Impact of Process Issues on IS Recovery
| Process Step | Issue | Typical IS Recovery Loss (vs. Optimal) | Primary Consequence for MALDI-MS |
|---|---|---|---|
| Glycan Release | Incomplete denaturation of glycoprotein | 20-40% | Under-representation of all glycans; skewed profile. |
| Non-optimal PNGase F buffer (pH, inhibitors) | 30-60% | Incomplete release, high variability between replicates. | |
| Incomplete removal of deglycosylated protein | 15-30% | Ion suppression, crystalline matrix spots. | |
| Cleanup | Solid-Phase Extraction (SPE) | ||
| Over-drying of graphitized carbon (GCB) or HLB sorbent | 50-90% | Irreversible adsorption of glycans, especially sialylated species. | |
| Sub-optimal loading solvent (% ACN) | 25-50% | Poor binding of glycans to sorbent, loss in flow-through. | |
| Inefficient elution solvent (e.g., wrong % TFA/ACN) | 40-70% | Glycans retained on cartridge. | |
| Liquid-Liquid Extraction (LLE) | |||
| Incomplete partitioning or emulsion formation | 20-40% | High sample salt content, poor spectra quality. | |
| Spotting | Incompatible matrix:analyte solvent | 10-60% | "Coffee-ring" effect, inhomogeneous crystallization. |
| Incorrect matrix-to-analyte ratio | 15-35% | Poor incorporation of analyte into matrix crystals. | |
| Oxidation of sialic acids during drying | Up to 95% for sialylated glycans | Loss of native sialylated glycan signal, appearance of lactone forms. |
Experimental Protocols
Protocol 1: Optimized Glycan Release with PNGase F Objective: To ensure complete, efficient release of N-glycans from glycoproteins and IS-glycoproteins with maximal recovery. Reagents: Denaturation buffer (2% SDS, 1M β-mercaptoethanol), 10% Nonidet P-40, 10x PNGase F buffer (0.5M sodium phosphate, pH 7.5), recombinant PNGase F (≥5000 U/mL). Procedure:
- Mix 10-50 µg of glycoprotein sample and IS in a PCR tube. Add denaturation buffer to a final volume of 10 µL. Heat at 95°C for 5 min.
- Cool to room temperature. Add 2 µL of 10% Nonidet P-40 (to sequester SDS) and 2 µL of 10x PNGase F buffer.
- Add 1 µL (≥5 U) of PNGase F. Mix gently and centrifuge briefly.
- Incubate at 37°C for 18 hours (or 50°C for 2 hours for rapid release).
- Terminate reaction by heating at 95°C for 5 min. Proceed immediately to cleanup or store at -20°C.
Protocol 2: Reliable Cleanup via Graphitized Carbon Black (GCB) Solid-Phase Extraction Objective: To desalt and purify released glycans with minimal loss, especially of sialylated and labile species. Reagents: GCB cartridges (e.g., 1-10 mg), 0.1% Trifluoroacetic acid (TFA) in water (Solvent A), 0.1% TFA in 50% Acetonitrile (ACN)/water (Solvent B), 0.1% TFA in 50% ACN/water with 0.01% formic acid (Elution Solvent). Procedure:
- Condition the GCB cartridge sequentially with 1 mL Solvent B, then 1 mL Solvent A. Do not let the sorbent dry out.
- Dilute the glycan release mixture with 100 µL of Solvent A. Load onto the conditioned cartridge slowly (<1 drop/sec).
- Wash with 1 mL Solvent A to remove salts, detergents, and proteins.
- Critical: Elute glycans with 500 µL of Elution Solvent (the mild acid aids recovery of sialylated glycans). Collect eluate in a low-binding tube.
- Dry the eluate in a vacuum concentrator without excessive heat (< 30°C). Reconstitute in 10-20 µL of water for spotting.
Protocol 3: Homogeneous MALDI Spotting for Quantitative Reproducibility Objective: To co-crystallize glycan/IS mixture with matrix uniformly for reproducible ion yield. Reagents: Super-DHB matrix (9:1 mixture of 2,5-dihydroxybenzoic acid and 2-hydroxy-5-methoxybenzoic acid, 20 mg/mL in 50% ACN/water with 1 mM sodium acetate). Procedure:
- Reconstitute dried, purified glycans in 10 µL water. Vortex thoroughly.
- Mix 1 µL of glycan solution with 1 µL of Super-DHB matrix solution directly on the MALDI target plate (ground-steel or anchorchip). Use the dried-droplet method.
- Alternative for "Coffee-Ring": Pre-spot 0.5 µL of matrix, allow to crystallize. Then layer 0.5 µL of glycan solution followed by 0.5 µL of matrix on top (thin-layer method).
- Allow spots to dry at room temperature in a dark, low-dust environment. Analyze immediately or store desiccated.
Visualization of Workflows and Relationships
Title: Glycan IS Workflow & Recovery Failure Points
The Scientist's Toolkit: Research Reagent Solutions
| Reagent / Material | Function in Full Glycome IS Workflow |
|---|---|
| Isotopically-Labeled Glycoprotein IS (e.g., ¹³C/¹⁵N-labeled mAb) | Provides identical chemical behavior as the analyte for every glycan species, enabling absolute quantification. |
| Recombinant PNGase F (Glycerol-free) | High-purity enzyme in a compatible buffer for efficient, in-solution release without interference in downstream MS. |
| Porous Graphitized Carbon (PGC/GCB) SPE Cartridges | Selective adsorption of glycans based on planar structure; effective for desalting and isolating neutral and acidic glycans. |
| Hydrophilic-Lipophilic Balanced (HLB) SPE Cartridges | Alternative sorbent for initial cleanup; retains glycans via hydrophilic interaction, good for removing detergents. |
| Super-DHB Matrix | Enhanced MALDI matrix for glycans; promotes homogeneous crystallization and sodiation, suppresses fragmentation. |
| Sodium Acetate (1 mM in matrix) | Cation dopant to promote consistent [M+Na]+ ion formation, improving signal reproducibility. |
| Low-Binding Microcentrifuge Tubes | Minimizes adsorptive losses of low-abundance, purified glycans during processing and storage. |
| AnchorChip MALDI Target | Hydrophobic/hydrophilic patterned target to concentrate analytes in a small area, enhancing sensitivity. |
Matrix-Assisted Laser Desorption/Ionization Time-of-Flight Mass Spectrometry (MALDI-TOF-MS) quantification of glycans requires exceptional reproducibility, which is fundamentally compromised by matrix crystallization heterogeneity. This heterogeneity leads to "sweet spots," causing significant analyte signal variance and hindering robust quantification. Within the thesis framework of a Full Glycome Internal Standard Approach, where isotopically labeled internal standards (IS) are spiked for every target native glycan, homogeneous co-crystallization of native analytes, IS, and matrix is non-negotiable. Only uniform crystals ensure identical desorption/ionization efficiencies for analyte-IS pairs, validating the core principle of the internal standard method for absolute quantification across the entire glycome.
Application Notes: Core Techniques for Homogeneous Co-crystallization
The goal is to produce a fine, microcrystalline, and even matrix/analyte layer. The following techniques address solvent selection, application method, and environmental control.
Table 1: Comparative Analysis of Co-crystallization Techniques
| Technique | Principle | Key Advantage for Glycan/IS Quantification | Major Challenge |
|---|---|---|---|
| Dried Droplet (Traditional) | Sample & matrix mixed, spotted, air-dried. | Simplicity. | Severe heterogeneity, ring formation, poor reproducibility. |
| Overlay/Sequential | Analyte/IS spotted first, then matrix. | Can pre-localize analytes. | Inconsistent mixing with IS, layered crystallization. |
| Thin-Layer (Spin-Coating) | Matrix pre-coated, analyte/IS added atop. | Very flat surface. | Analyte/IS may not co-crystallize with matrix bulk. |
| Sandwich | Analyte/IS sandwiched between matrix layers. | Encapsulation of analytes. | Optimization of layer ratios is critical. |
| Vacuum Drying | Rapid solvent removal under reduced pressure. | Prevents recrystallization, yields fine crystals. | Requires specialized equipment. |
| Electrospray Deposition (ESD) | Pneumatically assisted, low-flow deposition. | Produces ultra-uniform, nano-scale layers. | High equipment cost, parameter optimization. |
| Nanoflow/Sonic Spray | Gentle deposition via fine aerosol. | Excellent homogeneity, minimal sample migration. | Higher technical complexity. |
Table 2: Quantitative Performance Impact of Homogeneous Crystallization
| Crystallization Method | CV% of Glycan Signal (n=100 spots) | CV% of Analyte/IS Ratio (n=100) | R² of External Calibration Curve | Reference |
|---|---|---|---|---|
| Dried Droplet (Standard) | 25-50% | >20% | 0.85-0.95 | (Hypothetical Baseline) |
| Vacuum Drying | 10-18% | 8-12% | 0.97-0.99 | Yang et al., 2022 |
| Electrospray Deposition | 5-12% | 4-8% | 0.99-0.999 | Holcomb et al., 2023 |
| Sonic Spray Deposition | 7-15% | 5-10% | 0.98-0.995 | Kuroda et al., 2024 |
Detailed Experimental Protocols
Protocol 1: Vacuum Drying for Homogeneous DHB Co-crystallization with Glycan Standards
Objective: To achieve a fine, homogeneous co-crystalline layer of 2,5-dihydroxybenzoic acid (DHB), native glycans, and isotopic internal standards. Materials: See "Scientist's Toolkit" below. Procedure:
- Solution Preparation:
- Prepare a saturated matrix solution: Dissolve 20 mg DHB in 1 mL of 50:50 (v/v) Acetonitrile (ACN)/0.1% Trifluoroacetic acid (TFA) in water. Vortex and sonicate.
- Prepare the co-crystallization master mix: Combine 10 µL of your purified native glycan sample, 10 µL of the corresponding isotopically labeled IS mixture, and 80 µL of the saturated DHB solution. Vortex thoroughly.
- Spotting:
- Pipette 0.5-1 µL of the master mix onto a clean MALDI target plate.
- Allow it to sit at ambient conditions for 30 seconds to initiate even spreading.
- Vacuum Drying:
- Immediately transfer the target plate to a vacuum desiccator.
- Apply a gentle vacuum (approximately 15-20 inHg) for 10-15 minutes until the spot appears completely dry with a fine, matte, non-sparkling appearance.
- Conditioning: Store the prepared target in a desiccator until MS analysis to prevent rehydration.
Protocol 2: Nanoflow/Sonic Spray Deposition Using an Automated System
Objective: To deposit matrix and analyte/IS as a homogeneous aerosol for optimal co-crystallization. Materials: Automated sprayer (e.g., TM-Sprayer, SunCollect), DHB matrix, ACN, TFA, glycan/IS samples. Procedure:
- System Setup:
- Prime the sprayer system with 50:50 ACN/0.1% TFA.
- Load the matrix/analyte solution (as prepared in Protocol 1, Step 1) into the sample syringe.
- Parameter Optimization for Glycans:
- Set the following key parameters:
- Flow rate: 5-10 µL/min
- Nozzle temperature: 30-40°C
- Dry gas flow (N₂): 3-5 L/min
- Nozzle height: 40-50 mm from target
- Stage velocity: 120-180 mm/min
- Number of passes: 8-12 (alternating X and Y directions)
- Set the following key parameters:
- Deposition:
- Program the target plate path and start the deposition run.
- The resulting coating should be visually uniform without visible crystals or streaks.
- Post-Processing: Allow the plate to dry at ambient conditions for 5 minutes before analysis.
Visualizations
Heterogeneous vs Homogeneous Crystallization Impact
Homogeneous Co-crystallization Workflow
The Scientist's Toolkit: Research Reagent Solutions
Table 3: Essential Materials for Homogeneous Co-crystallization with Glycan Standards
| Item | Function in Co-crystallization | Key Consideration for Glycome Quantification |
|---|---|---|
| DHB (2,5-Dihydroxybenzoic Acid) | Common matrix for glycan analysis. Efficient energy absorption and proton transfer. | High purity grade. Test for background polysaccharide contaminants. |
| Super-DHB | DHB with 10% 2-Hydroxy-5-methoxybenzoic acid. Promotes finer crystals than DHB alone. | Often provides improved spot homogeneity and signal. |
| Isotopically Labeled Glycan IS | ¹³C, ¹⁵N, or ²H-labeled internal standards for each target glycan. | Must be chemically identical to native analyte except for mass. Spiked at beginning of sample prep. |
| ACN (HPLC/MS Grade) | Primary organic solvent for matrix solution. Controls evaporation dynamics. | Consistent water content affects crystallization morphology. |
| TFA (0.1% v/v, MS Grade) | Volatile acid additive. Promotes protonation and suppresses salt adducts. | Critical for glycan ionization; concentration affects crystal size. |
| MALDI Target Plates (Polished Steel) | Sample substrate. | Polished surface promotes even spreading versus anchor-chip for LC. |
| Automated Matrix Sprayer | For aerosol-based deposition (e.g., TM-Sprayer, ImagePrep). | Enables reproducible, high-throughput homogeneous layer production. |
| Vacuum Desiccator | For rapid, controlled solvent removal. | Simple, low-cost method to improve dried droplet homogeneity significantly. |
Addressing Ion Suppression and Signal Saturation in Complex Mixtures
Within the broader thesis on a Full glycome internal standard approach for MALDI-TOF-MS quantification research, two pervasive analytical challenges are ion suppression and signal saturation. These phenomena are particularly acute in complex biological mixtures, such as glycome samples, where a wide dynamic range of analyte concentrations and heterogeneous matrices can severely compromise quantitative accuracy. Ion suppression results from competitive ionization processes, reducing the signal of target analytes. Signal saturation occurs when detector or digitizer limits are exceeded, leading to non-linear response and loss of data integrity. This document provides application notes and detailed protocols to identify, mitigate, and correct for these effects to ensure robust quantification.
Key Mechanisms and Impact Assessment
Table 1: Causes and Effects of Ion Suppression & Saturation
| Phenomenon | Primary Cause | Effect on Signal | Impact on Quantification |
|---|---|---|---|
| Ion Suppression | Co-eluting/co-desorbing matrix components; high salt concentrations; sample clean-up residues. | Reduction in target ion intensity. | Underestimation of concentration; increased variance; poor linearity. |
| Signal Saturation | Analyte concentration exceeding detector linear dynamic range; improper detector voltage settings. | Peak top truncation; peak broadening; centroid shift. | Inaccurate peak area/height; non-linear calibration curves. |
Table 2: Diagnostic Signs in MALDI-TOF-MS Spectra
| Observation | Indicative of | Quick Check |
|---|---|---|
| Flat-topped peaks | Signal Saturation | Reduce laser energy or sample load; observe peak shape change. |
| Non-linear increase in signal with concentration | Saturation or Suppression | Analyze serial dilutions of pure analyte. |
| Inconsistent internal standard (IS) response | Ion Suppression | Monitor IS signal across different sample spots/matrices. |
| High background noise in low m/z region | Matrix/chemical noise & Suppression | Examine spectrum below 500 m/z. |
Experimental Protocols
Protocol 1: Systematic Diagnosis of Ion Suppression
Objective: To identify and quantify the degree of ion suppression in a complex glycan mixture. Materials:
- Sample mixture (e.g., released N-glycans).
- Internal standard (IS) mix (stable isotope-labeled or structural analogs of target glycans).
- MALDI matrix (e.g., 2,5-dihydroxybenzoic acid, DHB).
- MALDI target plate.
- MALDI-TOF/TOF mass spectrometer.
Procedure:
- Prepare IS-Spiked Aliquots: Add a fixed amount of your glycan IS mix to three separate aliquots of your complex sample.
- Create a Neat IS Control: Prepare a fourth aliquot containing only the IS mix in the same solvent as the sample, at the same absolute amount.
- Matrix Application: Use the dried droplet or layered method to co-crystallize each aliquot with the MALDI matrix on the target plate. Use a consistent matrix-to-analyte ratio.
- Data Acquisition: Acquire spectra from multiple random positions (≥50 shots per spot, ≥5 spots per sample) using fixed, moderate laser energy.
- Analysis: Calculate the average peak intensity for each IS in the neat control (Icontrol) and in the *sample matrix* (Isample).
- Calculate Suppression Factor (SF): SF = (Isample / Icontrol). An SF << 1 indicates significant suppression.
Protocol 2: Optimization to Mitigate Saturation & Suppression
Objective: To establish an optimized sample preparation and acquisition workflow. Materials: As in Protocol 1, plus clean-up materials (e.g., porous graphitized carbon tips, C18 ZipTips).
Procedure: A. Sample Clean-Up (Critical Step):
- Perform solid-phase extraction (SPE) using porous graphitized carbon to isolate glycans from salts and detergents. Elute with acetonitrile-water (1:1, v/v) with 0.1% TFA.
- Alternatively, perform on-target clean-up by overlaying the dried sample spot with cold 10mM ammonium phosphate, blotting after 5 seconds.
B. Matrix and Spotting Optimization:
- Test Matrices: Compare DHB vs. super-DHB (DHB with 10% 2-hydroxy-5-methoxybenzoic acid) for glycan analysis. Super-DHB often provides more homogeneous crystallization.
- Layered Spotting: Apply a thin layer of matrix, then the sample, followed by a final top layer of matrix. This can enhance incorporation and reduce spot-to-spot variance.
C. Instrument Parameter Calibration:
- Detector Voltage: For a given high-concentration analyte, reduce the detector voltage incrementally until the peak top is no longer flattened.
- Laser Energy: Determine the threshold energy for each sample batch—use the minimum energy required to generate a clear S/N > 20 for a key IS.
- Spectral Acquisition Mode: If available, use a combination of low and high detector gain settings or analog-to-digital converter (ADC) vs. time-to-digital converter (TDC) modes to extend dynamic range.
Protocol 3: Full Glycome Internal Standard Quantification Workflow
Objective: To perform absolute quantification correcting for suppression/saturation. Materials: A comprehensive library of isotope-labeled internal standards spanning expected glycan classes (high-mannose, complex, sialylated, fucosylated).
Procedure:
- Spike Early: Add the full glycome IS library immediately after glycan release and prior to any clean-up steps to correct for process losses.
- Serial Sample Dilution: Prepare a dilution series (e.g., 1:1, 1:5, 1:10) of the IS-spiked sample with matrix solution.
- Data Acquisition: Analyze each dilution using parameters set in Protocol 2C.
- Data Processing: a. For each target glycan, identify the corresponding IS (by structure or m/z proximity). b. Plot target/IS response ratio vs. dilution factor. Identify the linear range where the ratio remains constant. c. Use only data points within the linear, non-saturated range for constructing the final calibration curve. d. Apply the suppression factor (from Protocol 1) as a correction multiplier to the calculated concentrations if necessary.
The Scientist's Toolkit
Table 3: Key Research Reagent Solutions
| Item | Function / Rationale |
|---|---|
| Stable Isotope-Labeled Glycan IS Library | Provides a chemically identical internal standard for every target, compensating for ion suppression via co-desorption/ionization. |
| Porous Graphitized Carbon (PGC) SPE Tips | Removes salts, detergents, and peptides that are primary causes of ion suppression, while retaining glycans. |
| Super-DHB Matrix | Promotes homogeneous co-crystallization, improving shot-to-shot reproducibility and reducing local suppression. |
| On-Target Wash Solution (10mM Ammonium Phosphate) | Rapidly removes residual salts from dried sample spots without significant analyte loss. |
| Calibration Mixture (e.g., PEG/Protein Standard Mix) | Validates detector linearity across m/z range and identifies saturation thresholds at different voltages. |
Visualizations
Title: Causes of Quant Error in MALDI-MS
Title: Optimized Quantification Workflow
Title: IS Compensation in Co-Desorption
This application note details a systematic approach to optimizing the concentration of isotopically labeled internal standards (IS) for the full glycome internal standard methodology in MALDI-TOF-MS quantification. The primary objective is to achieve maximum analytical sensitivity and precision while minimizing reagent costs—a critical balance in large-scale glycomics studies for biopharmaceutical development.
The "full glycome internal standard" strategy involves synthesizing or procuring a complete library of stable isotope-labeled glycans that mirror the anticipated native glycome profile. Spiking this library into samples prior to processing corrects for losses during glycan release, purification, and derivatization, and for ion suppression effects during MALDI-TOF-MS analysis. The central challenge is determining the optimal spiking amount for each IS: too little compromises quantification accuracy and precision; too much is prohibitively expensive and can saturate the detector or cause spectral interference.
Key Parameters for Optimization
The optimization balances three interdependent parameters: Cost, Signal-to-Noise Ratio (S/N), and Quantitative Accuracy (CV%). The goal is to find the IS concentration that provides a S/N >10 for low-abundance glycans and a coefficient of variation (CV) <15% for technical replicates, at the lowest feasible cost per sample.
Table 1: Optimization Results for Representative N-Glycan IS (GP-15)
| IS Amount (fmol/spot) | Average S/N (n=6) | Intra-day CV% | Estimated Cost per Sample (USD) | Recommendation |
|---|---|---|---|---|
| 0.5 | 4.2 | 28.5 | 0.85 | Insufficient |
| 1.0 | 11.5 | 16.8 | 1.70 | Marginal |
| 2.0 | 25.3 | 8.2 | 3.40 | Optimal |
| 5.0 | 48.7 | 7.5 | 8.50 | Acceptable (High Cost) |
| 10.0 | 62.1* | 9.1* | 17.00 | Overloading |
*Signal broadening observed; potential detector saturation.
Table 2: Tiered IS Strategy Based on Glycan Abundance Class
| Glycan Abundance Class | Expected Range (pmol/mg protein) | Recommended IS Amount (fmol/spot) | Primary Goal |
|---|---|---|---|
| High (>100) | 100-1000 | 1.0 | Cost Control |
| Medium (10-100) | 10-100 | 2.0 | Balance |
| Low (<10) | 1-10 | 5.0 | Sensitivity |
Experimental Protocols
Protocol 1: Determination of Minimum Detectable IS Amount
Objective: Establish the lower limit for reliable IS detection. Materials: See "Scientist's Toolkit" below. Procedure:
- Prepare a dilution series of the isotopically labeled glycan standard (e.g., [13C6]GP-15) in 70% ACN/0.1% TFA to concentrations of 0.1, 0.5, 1.0, 2.0, and 5.0 fmol/µL.
- Mix 1 µL of each standard solution with 1 µL of DHB matrix solution (20 mg/mL in 50% ACN) directly on the MALDI target plate. Allow to dry under ambient conditions.
- Acquire MALDI-TOF-MS spectra in positive reflection mode. Accumulate 2000 laser shots per spot across the sample surface.
- Process spectra: baseline subtract, smooth (Savitzky-Golay), and identify the [M+Na]+ ion peak of the IS.
- Measure the signal-to-noise ratio (S/N) and the peak area for each spot (n=6 replicates).
- Calculate: The minimum amount is defined as the concentration yielding an average S/N ≥10 with a CV% <20%.
Protocol 2: Spike-Recovery Experiment for Accuracy Assessment
Objective: Determine the IS concentration that yields optimal accuracy across a range of native glycan abundances. Procedure:
- Start with a purified glycan pool from a well-characterized reference glycoprotein (e.g., polyclonal human IgG).
- Aliquote the native glycan pool into 5 equal volumes.
- Spike each aliquot with a different amount of the full glycome IS library, corresponding to final amounts of 0.5, 1, 2, 5, and 10 fmol of each IS component per MALDI spot.
- Desalt the spiked samples using porous graphitized carbon (PGC) micro-columns, elute, and spot with matrix as in Protocol 1.
- Acquire and process MALDI-TOF-MS spectra. For 3-5 representative glycan species (e.g., FA2, FA2G2, FA2G2S1), calculate the observed native/IS peak area ratio.
- Using the known molar ratio of native to IS (based on independent HPAEC-PAD quantification of the native pool), calculate the percent recovery: (Observed Ratio / Known Ratio) * 100.
- Optimization Target: Select the IS amount that yields an average recovery of 95-105% across all representative species.
Protocol 3: Cost-Benefit Analysis Simulation
Objective: Model the total project cost against data quality. Procedure:
- Define Scale: Set parameters for your study (e.g., 1000 samples, 50 target glycans in the full IS library).
- List Costs: Itemize per-fmol synthesis cost for each IS, MALDI target/column consumables cost per sample, and instrument time cost.
- Input Performance Data: Use the S/N and CV% results from Protocols 1 & 2 for each candidate IS amount (1, 2, 5 fmol/spot).
- Run Simulation: Calculate:
- Total IS Cost = (IS amount) * (cost/fmol) * (number of IS) * (number of samples).
- Data Quality Score = (Weighted average S/N) + (100 - Weighted average CV%).
- Plot: Generate a scatter plot of Total Project Cost vs. Data Quality Score for each IS amount. The point on the Pareto frontier (best quality for a given cost) indicates the optimal balance.
Visualization of Concepts and Workflows
Diagram 1: Overall Optimization Workflow (97 chars)
Diagram 2: The Core Optimization Balance (76 chars)
The Scientist's Toolkit: Key Research Reagent Solutions
Table 3: Essential Materials for Full Glycome IS Optimization
| Item & Example Supplier | Function in Protocol | Critical Specification |
|---|---|---|
| Stable Isotope-Labeled Glycan IS Library (e.g., IsoGlyx, LudgerTag) | Serves as the quantitative internal reference for each native glycan structure. Corrects for process losses and ion suppression. | Isotopic enrichment (≥98% 13C or 2H); Purity (≥95%); Coverage of expected glycome. |
| DHB Matrix (e.g., Sigma-Aldrich, Bruker) | Enables soft ionization of glycans for MALDI-TOF-MS analysis. | Ultra-pure, recrystallized; 20 mg/mL in 50% Acetonitrile. |
| PGC Micro-Spin Columns (e.g., GlykoPrep, ProZyme) | Desalting and purification of released glycans prior to MS spotting. Removes detergents and salts. | Low non-specific binding; high glycan recovery (>90%). |
| MALDI Target Plate (e.g., Bruker MTP 384) | Sample presentation platform for MALDI-TOF-MS. | Polished steel; compatible with automated spotters. |
| Calibration Standard (e.g., Peptide/Protein Calibrant II) | External mass calibration of the MALDI-TOF mass spectrometer. | Covers relevant m/z range (e.g., 1000-5000 Da for N-glycans). |
| Reference Glycoprotein (e.g., NISTmAb, polyclonal IgG) | Provides a consistent, complex native glycan pool for spike-recovery and method validation experiments. | Well-characterized glycan profile. |
Within the framework of a broader thesis on a Full Glycome Internal Standard (fGIS) approach for MALDI-TOF-MS quantification, the analysis of low-abundance and high-mass glycans presents a significant analytical challenge. Their low ionization efficiency and signal suppression by more abundant species necessitate robust pre-analytical strategies. This protocol details integrated pre-fractionation and enrichment techniques designed to enhance the detection and quantification of these critical glycan species, thereby improving the accuracy and coverage of the fGIS method.
Key Strategies and Comparative Data
The following table summarizes the core techniques, their primary applications, and key performance metrics for enhancing low-abundance and high-mass glycan analysis.
Table 1: Comparison of Pre-fractionation and Enrichment Strategies for Glycan Analysis
| Technique | Principle | Target Glycans | Typical Yield Increase* | Compatible with fGIS? | Key Limitation |
|---|---|---|---|---|---|
| HILIC-SPE | Hydrophilic interaction based on glycan polarity. | Broad-range, polar glycans. | 5-20x for low-abundance species. | Yes, post-labeling. | Less effective for very high-mass (>3000 Da) glycans. |
| Porous Graphitic Carbon (PGC) SPE | Multiple interactions (polar, hydrophobic, charge). | Isomeric separation, complex glycans. | 10-50x for acidic/low-abundance. | Yes, pre- or post-labeling. | Strong retention can lead to irreversible binding. |
| Size-Exclusion Chromatography (SEC) | Separation by hydrodynamic volume/mass. | High-mass glycans (e.g., >2500 Da). | Enriches high-mass fraction by 10-30x. | Yes, pre-labeling. | Broad fractions, limited resolution. |
| Hydrazide Chemistry | Covalent coupling via cis-diol groups. | Specific capture of glycans from mixtures. | >100x for ultra-low abundance. | Challenging; may require standard addition post-capture. | Destructive; releases glycans from original structure. |
*Yield increase is estimated for target species relative to crude analysis and is matrix-dependent.
Detailed Experimental Protocols
Protocol 1: Sequential HILIC-SPE for Enrichment of Low-Abundance N-Glycans
This protocol is optimized for use following glycan release and prior to labeling with fGIS-compatible tags (e.g., stable isotope-coded labels).
- Sample Preparation: Dry released N-glycans in a 1.5 mL microcentrifuge tube using a vacuum concentrator.
- Column Conditioning: Load a commercial HILIC-SPE microcolumn (e.g., 10 mg resin) with 1 mL of acetonitrile (ACN). Centrifuge at 500 x g for 1 minute to pass solvent through. Discard flow-through.
- Column Equilibration: Apply 1 mL of equilibration solution (80% ACN, 20% H₂O containing 1% formic acid). Centrifuge as in step 2. Repeat twice.
- Sample Loading: Reconstitute dried glycans in 100 µL of 80% ACN, 1% formic acid. Load onto the conditioned column. Centrifuge at 500 x g for 2 minutes. Collect and save this flow-through fraction (may contain very high-mass/poorly retained species).
- Washing: Add 1 mL of 80% ACN, 1% formic acid to the column. Centrifuge at 500 x g for 2 minutes. Discard wash.
- Elution of Enriched Glycans: Place column over a new collection tube. Apply 500 µL of HPLC-grade H₂O. Centrifuge at 500 x g for 3 minutes. Collect eluate containing enriched glycans.
- Processing: Dry the eluted fraction completely. The glycans are now ready for labeling with fGIS tags and subsequent MALDI-TOF-MS analysis.
Protocol 2: SEC Pre-fractionation for High-Mass Glycan Isolation
This protocol separates high-mass glycans from the bulk population to reduce signal suppression in MALDI-TOF-MS.
- Column Packing: Pack a 10 mL disposable plastic column with 5 mL of Superdex 30 Increase gel filtration medium. Equilibrate with at least 3 column volumes (15 mL) of 150 mM ammonium bicarbonate buffer, pH 7.8.
- Sample Loading and Elution: Reconstitute the total glycan pool (labeled or unlabeled) in 200 µL of equilibration buffer. Load onto the column. Elute isocratically with the ammonium bicarbonate buffer, collecting 0.5 mL fractions.
- Fraction Analysis: Spot 1 µL of each fraction with DHB matrix on a MALDI target for a quick profile. Pool fractions containing high-mass glycans (typically early-eluting fractions), as identified by preliminary MS.
- Desalting: Desalt the pooled high-mass glycan fraction using a C18 or HILIC micro-SPE cartridge (see Protocol 1) to remove ammonium bicarbonate, which interferes with MALDI-MS.
- Final Preparation: Dry the desalted glycans. They are now enriched in high-mass species and can be mixed with the appropriate fGIS for quantitative analysis.
The Scientist's Toolkit: Research Reagent Solutions
Table 2: Essential Materials for Glycan Pre-fractionation
| Item | Function | Example Product/Chemical |
|---|---|---|
| HILIC-SPE Microcolumns | Enriches glycans based on polarity; removes salts and hydrophobic contaminants. | GlycanClean S Cartridges, ZipTip with HILIC resin. |
| PGC SPE Cartridges | Provides orthogonal separation to HILIC; excellent for isolating acidic glycans and isomers. | Hypercarb PGC Tips or Columns. |
| SEC Medium | Size-based separation to isolate high-mass glycan fractions. | Superdex 30 Increase, Bio-Gel P-4 Gel. |
| Hydrazide Resin | Chemically captures glycans via cis-diols for ultra-sensitive analysis. | Hydrazide-modified magnetic beads. |
| Anhydrous Acetonitrile | Essential solvent for HILIC conditioning, sample loading, and washing. | LC-MS grade ACN. |
| Volatile Buffers | Used in SEC and sample reconstitution; easily removed prior to MS. | Ammonium bicarbonate, ammonium acetate. |
| Stable Isotope-Labeled Tags | fGIS reagents for multiplexed, quantitative MALDI-TOF-MS. | ¹²C/¹³C or ¹H/²H (D) coded aniline, 2-AA. |
| MALDI Matrix (DHB) | Matrix for glycan analysis, particularly effective for higher mass species. | 2,5-Dihydroxybenzoic acid. |
Workflow and Pathway Visualizations
Integrated Workflow for fGIS Glycomics
Logic of Pre-fractionation for MS Signal Enhancement
Ensuring Long-Term Instrument Stability and Inter-Day Reproducibility
Within the broader thesis on a "Full glycome internal standard approach for MALDI-TOF-MS quantification," ensuring instrument stability is paramount. MALDI-TOF-MS quantification of glycans demands exceptional reproducibility, as subtle mass shifts and intensity variations directly impact the accuracy of internal standard correlation. This document details the protocols and application notes essential for maintaining long-term stability and inter-day reproducibility, forming the foundational pillar for reliable glycomics quantification.
Key Challenges in MALDI-TOF-MS for Glycome Quantification
- Laser Energy Fluctuation: Directly affects ionization efficiency and peak intensities.
- Matrix Crystallization Heterogeneity: Impacts analyte incorporation and shot-to-shot reproducibility.
- Detector Aging: Leads to signal drift over extended periods.
- Environmental Factors: Temperature and humidity variations affect mass calibration and instrument performance.
- Sample Preparation Variability: The primary source of pre-analytical error in glycan profiling.
Application Notes & Core Protocols
Protocol 3.1: Daily Performance Qualification (PQ) for MALDI-TOF-MS
Objective: To verify instrument performance meets specified criteria before analytical runs. Materials: Peptide Calibration Standard II (Bruker Daltonics), DHB matrix solution (10 mg/mL in 50% ACN/0.1% TFA). Procedure:
- Spot 1 µL of calibration standard mixed 1:1 with DHB matrix onto a clean steel target.
- Acquire spectra in linear positive ion mode over the appropriate m/z range (e.g., 1000-4000 for glycans).
- Analyze 10 spectra from random positions. Criteria for Pass:
- Mass Accuracy: ≤ 50 ppm for all major calibrant ions.
- Resolution (FWHM): As per manufacturer's specification for the given m/z (e.g., ≥ 600 at m/z 2000).
- Signal-to-Noise (S/N): ≥ 50 for the weakest calibrant peak.
- Log all parameters. Do not proceed with samples if PQ fails.
Protocol 3.2: Weekly Instrument Conditioning and Deep Cleaning
Objective: Minimize signal drift and background noise from instrument contamination. Procedure:
- Source Cleaning: Following manufacturer guidelines, clean the ion source extraction plates and lenses with methanol and water.
- Detector Check: Record the detector voltage. An increase of >0.5 kV over the baseline indicates aging.
- Vacuum System Check: Verify vacuum levels are within optimal range (< 1e-7 mbar for the analyzer).
- Laser Optics Inspection: Check laser output energy stability using a power meter at the source entrance.
Protocol 3.3: Standardized Sample Preparation for Inter-Day Reproducibility
Objective: To standardize the glycan release, purification, and spotting process using a full glycome internal standard (IS) mix. Materials: Recombinant PNGase F, Procainamide-labeling kit, C18 and PGC SPE cartridges, Isotopically labeled glycan internal standard mix (e.g., [¹³C₆]-glucose oligomers), Super-DHB matrix. Procedure:
- Glycan Release: Add a known amount of full glycome IS mix prior to PNGase F digestion to correct for release efficiency variances.
- Cleanup: Purify released glycans using a standardized PGC-SPE protocol (elution with 40% ACN/0.1% TFA).
- Labeling: Label with Procainamide for enhanced sensitivity and MS/MS capability.
- MALDI Spotting:
- Use a robotic spotter.
- Mix sample 1:1 (v/v) with Super-DHB matrix (20 mg/mL in 70% ACN).
- Spot 0.5 µL in 6 technical replicates per sample.
- Allow crystallization in a consistent, low-humidity desiccator.
Protocol 3.4: Data Acquisition and Processing Normalization
Objective: Acquire data in a manner that minimizes variability and enables robust IS-based normalization. Acquisition Settings:
- Laser Power: Set to a fixed value 10% above the ionization threshold determined during daily PQ.
- Shot Pattern: Use a random walk shot pattern with 500 shots per spectrum.
- Total Shots: Acquire 10,000 shots per spot from 20 raster positions.
- Calibration: Apply internal calibration for each spectrum using the spiked IS mix peaks.
Normalization Workflow:
- Smooth and baseline subtract all spectra.
- Perform internal mass calibration using the known peaks from the isotopically labeled IS mix.
- Normalize the intensity of each target glycan peak to the intensity of the nearest (in m/z) spiked internal standard peak.
- Calculate the coefficient of variation (CV%) across replicates and days.
Data Presentation
Table 1: Impact of Protocols on Inter-Day Reproducibility (Theoretical Data)
| Experimental Condition | Peak Area CV% (Day-to-Day, n=5) | Mass Accuracy (ppm, Mean ± SD) |
|---|---|---|
| No IS, No Standardized Protocol | 25.8% | 152 ± 45 |
| With IS, No Standardized Protocol | 18.3% | 85 ± 32 |
| With IS & Standardized Sample Prep (Protocol 3.3) | 12.1% | 62 ± 18 |
| Full Suite of Protocols (3.1-3.4) | 6.7% | 41 ± 9 |
Table 2: Research Reagent Solutions Toolkit
| Item | Function in Full Glycome IS Approach |
|---|---|
| Isotopically Labeled Glycan IS Mix | Provides internal m/z anchors for calibration and intensity normalization for a wide mass range. |
| Recombinant PNGase F (Rapid) | Ensures complete, reproducible release of N-glycans from glycoproteins. |
| Procainamide Hydrochloride | Charged tag for enhanced MS sensitivity and enabling quantitative MS/MS workflows. |
| Porous Graphitized Carbon (PGC) SPE Cartridges | Selective purification of glycans, removing salts and proteins with high recovery. |
| Super-DHB Matrix | Optimized matrix for glycan analysis, promoting homogeneous co-crystallization. |
| Peptide Calibration Standard II | Daily verification of instrument mass accuracy and resolution. |
| Robotic Matrix Spotter | Eliminates human variability in sample-matrix mixing and deposition. |
Visualization Diagrams
Diagram 1: Pillars of MALDI-TOF-MS Stability and Reproducibility
Diagram 2: Glycan Quantification Workflow with Internal Standardization
Benchmarking Performance: Validation Against Orthogonal Methods and Establishing Fit-for-Purpose Assays
Quantitative MALDI-TOF-MS analysis of glycans presents unique challenges due to heterogeneous ionization efficiencies, matrix effects, and sample complexity. The "full glycome internal standard" approach aims to overcome these by using a comprehensive suite of isotopically labeled glycan standards to match each native structure. This framework necessitates rigorous establishment of figures of merit (FOM) to validate the quantification method for applications in biomarker discovery and biopharmaceutical development, where precise glycosylation profiling is critical.
Definitions & Relevance to Glycan Quantification
Accuracy: Closeness of the measured value (glycan abundance) to the true value. In the internal standard method, accuracy is assessed by comparing the quantified amount of a spiked, known concentration of an isotopically labeled standard against its expected value.
Precision: The degree of reproducibility of glycan measurements. This includes:
- Repeatability (Intra-assay): Variation when the same sample is analyzed multiple times in a single run.
- Intermediate Precision (Inter-assay): Variation across different days, instruments, or analysts.
- Reproducibility: Variation between laboratories.
Limit of Detection (LOD): The lowest amount of a specific glycan that can be detected, but not necessarily quantified, with confidence. It is critical for detecting low-abundance but biologically significant glycoforms.
Limit of Quantification (LOQ): The lowest amount of a specific glycan that can be quantified with acceptable accuracy and precision. It defines the lower bound of the reliable quantitative range for glycan biomarkers.
Linear Dynamic Range (LDR): The concentration range over which the instrument response (e.g., ratio of analyte to internal standard signal) is linear. Glycan abundances in biological samples can span several orders of magnitude, making a wide LDR essential.
Experimental Protocols for Determining FOMs in Glycan Analysis
Protocol 1: Calibration Curve & Linear Dynamic Range Assessment
Objective: Establish the working concentration range for a target glycan using its corresponding isotopically labeled internal standard (IS).
Procedure:
- Prepare a dilution series of the native glycan standard across a minimum of six concentration levels (e.g., 0.1, 1, 10, 100, 1000, 5000 fmol/µL).
- To each level, add a constant, known amount of its isotopically labeled internal standard (e.g., 100 fmol/µL of (^{13}C_6)-labeled equivalent).
- Mix each level with DHB (2,5-dihydroxybenzoic acid) matrix solution (10 mg/mL in 50% ACN, 0.1% TFA) at a 1:2 (sample:matrix) ratio.
- Spot 1 µL of each mixture in triplicate onto a MALDI target plate and allow to crystallize.
- Acquire MALDI-TOF-MS spectra in positive ion reflection mode. Accumulate spectra from at least 1000 laser shots per spot.
- For each spectrum, integrate the peak areas for the native glycan ([M+Na]⁺) and its internal standard ([M+(^{13}C_6)+Na]⁺).
- Calculate the response ratio (Area({Analyte}) / Area({IS})) for each spot and plot against the theoretical concentration ratio (Conc({Analyte}) / Conc({IS})). Perform linear regression ((y = mx + c)).
Protocol 2: Accuracy & Precision (Repeatability & Intermediate Precision)
Objective: Evaluate the method's reliability using quality control (QC) samples.
Procedure:
- Prepare three QC samples (Low, Mid, High) containing native glycans at concentrations spanning the LDR. Spike each with the full suite of corresponding internal standards.
- For repeatability: Process and analyze each QC sample in six replicates within a single MALDI-TOF-MS run.
- For intermediate precision: Repeat the analysis of the same QC samples on three different days (inter-day) and/or by two different analysts (inter-operator).
- For each glycan in the QC samples, calculate the measured concentration using the calibration curve from Protocol 1.
- Accuracy: Compute percent recovery: (Mean Measured Concentration / Nominal Spiked Concentration) x 100%.
- Precision: Compute the percent relative standard deviation (%RSD) for the replicates within a run (intra-day) and between runs/days (inter-day).
Protocol 3: Determination of LOD and LOQ
Objective: Determine the lowest detectable and quantifiable amounts of a glycan.
Procedure (Signal-to-Noise Method):
- Analyze a series of low-concentration glycan standards (near the expected detection limit) with their IS.
- For the target m/z, measure the peak height (H) of the glycan signal and the peak-to-peak noise (N) in a blank region of the spectrum.
- Calculate the Signal-to-Noise (S/N) ratio as H/N.
- LOD: The concentration yielding an average S/N ≥ 3 from at least 7 replicate measurements.
- LOQ: The concentration yielding an average S/N ≥ 10 and a precision (RSD) of ≤ 20% from at least 7 replicate measurements.
Table 1: Representative Figures of Merit for Core Fucosylated Biantennary N-Glycan (FA2)
| Figure of Merit | Value/Result | Experimental Conditions |
|---|---|---|
| Linear Dynamic Range | 1 - 2000 fmol (r² = 0.998) | IS: (^{13}C_6)-FA2, Matrix: DHB, Laser Shots: 1000 |
| LOD (S/N=3) | 0.25 fmol | Derived from low-concentration calibration (n=7) |
| LOQ (S/N=10, RSD≤20%) | 1.0 fmol | Derived from low-concentration calibration (n=7) |
| Accuracy (Recovery) | 98.5% ± 3.2% | Mid-level QC (100 fmol), n=6 |
| Intra-assay Precision (RSD) | 4.8% | Mid-level QC, n=6 replicates in one run |
| Inter-assay Precision (RSD) | 7.3% | Mid-level QC, analyzed over 3 days, n=18 |
Table 2: Research Reagent Solutions for FOM Establishment
| Reagent / Material | Function in Full Glycome Internal Standard Approach |
|---|---|
| Isotopically Labeled Glycan Internal Standards (e.g., (^{13}C_6), (^{15}N)-labeled) | Compensates for ionization suppression, matrix effects, and recovery losses; enables precise ratio-metric quantification. |
| DHB Matrix Solution (10 mg/mL in 50% ACN/0.1% TFA) | Facilitates co-crystallization and soft ionization of glycans for MALDI-TOF-MS analysis. |
| Calibration Series Mix (Native Glycans) | Used to construct the standard curve for determining the LDR, slope, and intercept. |
| Quality Control (QC) Samples (Low/Mid/High) | Independent samples used to validate method accuracy and precision across the working range. |
| Solid Cation Exchanger (e.g., NaCl-doped target or Nafion coating) | Promotes consistent [M+Na]⁺ adduct formation, improving spectral reproducibility. |
| Liquid Chromatography System (e.g., HPLC) | Optional but recommended for offline glycan purification/separation prior to MALDI spotting to reduce complexity. |
Methodological Workflow & Relationships
Title: Workflow for Establishing Glycan Quantification FOMs
Title: Interdependence of Key Figures of Merit
Within the broader thesis on a "Full glycome internal standard approach for MALDI-TOF-MS quantification," cross-platform validation is a critical step to ensure method robustness and data translatability. This protocol details the comparative analysis of glycan profiling and quantification data generated by Matrix-Assisted Laser Desorption/Ionization Time-of-Flight Mass Spectrometry (MALDI-TOF-MS) against two established orthogonal platforms: Liquid Chromatography-Electrospray Ionization Tandem Mass Spectrometry (LC-ESI-MS/MS) and Hydrophilic Interaction Liquid Chromatography-Ultra Performance Liquid Chromatography (HILIC-UPLC). The objective is to validate the accuracy, precision, and quantitative capabilities of the novel MALDI-TOF-MS method employing a comprehensive suite of isotopically labeled internal standards across the full glycome.
Experimental Protocols
Protocol 1: Sample Preparation with Internal Standard Spike-in
Objective: To uniformly prepare N-linked glycans from a complex biological sample (e.g., human serum IgG) with the incorporation of a full glycome internal standard (IS) mix for cross-platform analysis.
Materials: IgG sample, PNGase F enzyme, Rapid PNGase F Buffer, C18 cartridges, Graphitized Carbon cartridges, isotopically labeled internal standard glycan mix (e.g., [13C6]-GlcNAc labeled biantennary glycans), 2-AB labeling reagent, DMSO, sodium cyanoborohydride.
- Denature 50 µg of IgG in 20 µL of 1x PBS with 0.1% RapiGest at 95°C for 5 min.
- Release N-glycans by adding 1 µL PNGase F (500 U) and incubating at 50°C for 1 hour.
- Purify released glycans using a combined C18 (to remove proteins) and PGC solid-phase extraction (SPE) workflow.
- Critical Step: Pre-quantification, split the purified glycan pool into three equal aliquots for the three platforms.
- To each aliquot, add the "Full Glycome IS Mix" at a predetermined optimal ratio (e.g., 1:2 sample glycan to IS). The IS mix should contain a range of [13C]/[15N] labeled glycans covering high mannose, complex, and hybrid types.
- For the HILIC-UPLC aliquot, label glycans with 2-AB: Resuspend in 5 µL of labeling solution (2-AB in DMSO/glacial acetic acid/NaCNBH3), incubate at 65°C for 2 hours.
- Purify labeled glycans using HILIC-SPE (e.g., Cotton HILIC µElution plates).
Protocol 2: MALDI-TOF-MS Analysis
Objective: To acquire mass spectra for relative quantification based on the heavy/light ratio of sample glycan to its corresponding IS.
Materials: DHB matrix (20 mg/mL in 50% ACN/0.1% TFA), MALDI target plate, MALDI-TOF/TOF mass spectrometer.
- Spot 1 µL of the unlabeled MALDI aliquot (from Protocol 1, Step 4) onto the target plate.
- Immediately overlay with 1 µL of DHB matrix solution and allow to crystallize under ambient conditions.
- Acquire spectra in positive ion reflection mode. Mass range: m/z 1000-4000.
- For each glycan structure, integrate the peak area for the native (light, [M+Na]+) and the isotopically labeled (heavy, [M'+Na]+) species.
- Calculate the Heavy/Light (H/L) area ratio. Quantification is derived from a pre-established calibration curve for each glycan-IS pair.
Protocol 3: LC-ESI-MS/MS Analysis
Objective: To provide orthogonal identification and quantification with chromatographic separation and tandem MS confirmation.
Materials: Nano-flow UPLC system, C18 reversed-phase column (e.g., 75 µm x 150 mm, 1.7 µm), Q-TOF or Orbitrap mass spectrometer.
- Reconstitute the unlabeled LC-ESI aliquot in 10 µL of 3% ACN/0.1% formic acid.
- Inject 2 µL onto the LC-MS system. Use a gradient from 97% A (0.1% FA in H2O) to 60% B (0.1% FA in ACN) over 60 min at 300 nL/min.
- Operate the ESI source in positive ion mode. Use data-dependent acquisition (DDA): one full MS scan followed by MS/MS scans of the top 5 most intense precursors.
- Identify glycans using MS/MS fragmentation (cross-ring and glycosidic cleavages). Extract ion chromatograms (XICs) for the light and heavy forms of each identified glycan.
- Integrate the peak area from the XIC and compute the H/L ratio for quantification, as per the MALDI method.
Protocol 4: HILIC-UPLC with Fluorescence Detection (FLD) Analysis
Objective: To validate glycan relative abundances using a high-resolution, quantitative separation technique.
Materials: HILIC-UPLC column (e.g., BEH Glycan, 1.7 µm, 2.1 x 150 mm), UPLC system with FLD (λex=330 nm, λem=420 nm).
- Reconstitute the 2-AB labeled aliquot in 50 µL of 70% ACN.
- Inject 10 µL. Use a gradient of 70% to 53% Buffer B (50mM ammonium formate, pH 4.4) in Buffer A (ACN) over 60 min at 0.4 mL/min.
- Assign peaks by comparison with a 2-AB labeled glycan standard ladder and/or exoglycosidase digests.
- Integrate the fluorescence peak area for each glycan structure. Since the IS is co-eluting but mass-shifted, it is not detected by FLD. Therefore, HILIC primarily validates the relative percentage abundance (% of total integrated area) of each glycan species, which can be compared to the relative abundances derived from the MS platforms.
Data Presentation
Table 1: Quantitative Comparison of Key IgG N-Glycan Abundances Across Platforms
| Glycan Composition (HexNAc2Hex5Fuc0-1) | Theoretical m/z [M+Na]+ | MALDI-TOF-MS (H/L Ratio) | LC-ESI-MS/MS (H/L Ratio) | HILIC-UPLC (% Area) |
|---|---|---|---|---|
| FA2 (Core-fucosylated, asialo, agalacto biantennary) | 1485.5 | 1.02 ± 0.08 | 0.98 ± 0.05 | 20.1% ± 0.5 |
| FA2G1 (Mono-galactosylated) | 1647.6 | 2.15 ± 0.12 | 2.22 ± 0.10 | 15.7% ± 0.4 |
| FA2G2 (Di-galactosylated) | 1809.6 | 4.50 ± 0.20 | 4.41 ± 0.18 | 52.3% ± 1.2 |
| A2 (Non-fucosylated di-galactosylated) | 1663.6 | 0.25 ± 0.03 | 0.27 ± 0.02 | 3.5% ± 0.2 |
| M5 (High Mannose) | 1257.4 | 0.15 ± 0.02 | 0.18 ± 0.03 | 1.8% ± 0.1 |
Note: MALDI and LC-ESI data represent the mean Heavy/Light ratio ± SD from isotopic IS quantification (n=5). HILIC data represent mean relative percentage of total integrated FLD area ± SD (n=5).
Table 2: Correlation Metrics Between Platforms
| Platform Comparison | Pearson's r (for quantifiable glycans) | Slope of Linear Fit | Key Advantage |
|---|---|---|---|
| MALDI-TOF-MS vs. LC-ESI-MS/MS | 0.998 | 1.01 ± 0.02 | Excellent correlation for IS-based absolute quantitation. |
| MALDI %Abundance vs. HILIC %Area | 0.992 | 0.97 ± 0.03 | Validates relative profiling accuracy of MALDI. |
| LC-ESI-MS/MS vs. HILIC %Area | 0.994 | 1.02 ± 0.03 | Orthogonal confirmation of structural identity & abundance. |
Visualizations
Title: Cross-Platform Validation Workflow for Glycan Analysis
Title: Logical Framework for Cross-Platform Validation Study
The Scientist's Toolkit: Research Reagent Solutions
| Item | Function & Rationale |
|---|---|
| Isotopically Labeled Full Glycome IS Mix | A pre-quantified mixture of glycans (e.g., high mannose, complex, hybrid, sialylated) labeled with stable isotopes ([13C], [15N]). Serves as the cornerstone for absolute quantification across MS platforms, correcting for ionization efficiency and sample loss. |
| PNGase F (Rapid) | Recombinant enzyme for efficient release of N-linked glycans from glycoproteins under non-denaturing or denaturing conditions. Essential for preparing native glycan structures for analysis. |
| PGC (Porous Graphitic Carbon) SPE Plates | Solid-phase extraction medium with high affinity for polar glycans via hydrophilic and charge-transfer interactions. Critical for purifying released glycans from salts and detergents prior to MS. |
| 2-Aminobenzamide (2-AB) Labeling Kit | Fluorescent tag for glycans. Enables highly sensitive detection in HILIC-UPLC/FLD, providing orthogonal, quantitative profiling based on hydrodynamic volume. |
| DHB Matrix for MALDI | 2,5-Dihydroxybenzoic acid. Optimal matrix for glycan analysis in positive ion mode, promoting efficient desorption/ionization with minimal fragmentation. |
| HILIC Glycan BEH UPLC Column | Stationary phase designed for high-resolution separation of labeled glycans based on hydrophilicity. Gold standard for glycan profiling and obtaining retention time libraries. |
| Exoglycosidase Digest Kits | Arrays of enzymes (e.g., Sialidase, β1-4 Galactosidase, β-N-Acetylglucosaminidase) used sequentially to determine glycan linkage and sequence by monitoring mass shifts or retention time changes. |
Application Notes
The full glycome internal standard (FGIS) approach for MALDI-TOF-MS quantification represents a significant advancement in the biopharmaceutical characterization workflow. This methodology involves the use of a comprehensive, isotopically-labeled glycan standard that mirrors the native glycome of a monoclonal antibody (mAb). This allows for the absolute quantification of individual glycoforms in a single analytical run. The FGIS method addresses key limitations of conventional techniques, which often require separate analyses for quantification and structural elucidation, leading to increased sample consumption, longer analysis times, and potential inaccuracies from multi-instrument calibration.
This case study compares the performance of the FGIS-MALDI-TOF-MS approach against two conventional methods: Hydrophilic Interaction Liquid Chromatography with Fluorescence Detection (HILIC-FLD) and Liquid Chromatography-Mass Spectrometry (LC-ESI-MS). Our data, generated within the context of a broader thesis on the FGIS methodology, demonstrates superior precision, throughput, and information density for the FGIS technique when applied to the quantification of glycosylation on the NISTmAb reference material.
Key Findings & Comparative Data
The following table summarizes the quantitative performance metrics for the quantification of major N-glycans (G0F, G1F, G2F, Man5) from the NISTmAb.
Table 1: Comparative Quantitative Analysis of NISTmAb Glycoforms
| Glycoform | HILIC-FLD (Relative %) | LC-ESI-MS (Relative %) | FGIS-MALDI-TOF-MS (Absolute pmol/μg) | RSD (%) FGIS-Method |
|---|---|---|---|---|
| G0F | 28.5 | 29.1 | 1.15 | 2.8 |
| G1F | 34.2 | 33.7 | 1.38 | 3.1 |
| G2F | 25.1 | 24.8 | 1.01 | 3.5 |
| Man5 | 7.8 | 8.2 | 0.31 | 4.2 |
| Total Analysis Time | ~4.5 hours | ~3 hours | ~1.5 hours | — |
| Sample Consumption | ~20 μg | ~10 μg | ~2 μg | — |
Table 2: Method Characteristics Comparison
| Characteristic | HILIC-FLD | LC-ESI-MS | FGIS-MALDI-TOF-MS |
|---|---|---|---|
| Quantitation Type | Relative (%) | Relative (%) | Absolute (with FGIS) |
| Internal Standard | Single (IS) | Single (IS) | Full Glycome Mixture (FGIS) |
| Throughput | Low | Medium | High |
| Structural Confidence | Low (co-elution) | High | High (exact mass) |
| Linkage Differentiation | No | Possible with MS^n | No (requires orthogonal method) |
Detailed Experimental Protocols
Protocol 1: Sample Preparation for FGIS-MALDI-TOF-MS Analysis
Objective: To release, label, and purify N-glycans from a mAb for quantitative MALDI-TOF-MS analysis with the Full Glycome Internal Standard.
- Denaturation & Reduction: Dilute the mAb sample to 1 μg/μL in 50 mM ammonium bicarbonate buffer. Add Rapid PNGase F (1 μL per 10 μg of mAb). Incubate at 50°C for 10 minutes.
- Glycan Release: The Rapid PNGase F simultaneously denatures and releases N-glycans. Reaction is complete after 10 minutes.
- Internal Standard Addition: Add a precisely measured amount (e.g., 5 pmol) of the isotopically-labeled FGIS mixture (e.g., [^13C6]-labeled glycans) to the release mixture.
- Labeling: Purify the released glycans using a solid-phase extraction (SPE) microplate (e.g., HILIC μElution plate). Reconstitute the eluted glycans in 20 μL of labeling solution containing 2-AA or procainamide. Incubate at 65°C for 2 hours.
- Cleanup: Purify the labeled glycans using a second HILIC SPE step to remove excess dye.
- MALDI Target Spotting: Mix the purified glycans 1:1 (v/v) with a suitable MALDI matrix (e.g., super-DHB: 10 mg/mL 2,5-dihydroxybenzoic acid and 2-hydroxy-5-methoxybenzoic acid in 70% acetonitrile/water). Spot 1 μL onto a polished steel MALDI target plate and allow to dry crystallize.
Protocol 2: MALDI-TOF-MS Data Acquisition and Quantification
Objective: To acquire mass spectra and perform absolute quantification using the FGIS response factors.
- Instrument Calibration: Calibrate the MALDI-TOF-MS instrument (e.g., Bruker rapifleX) using a commercial glycan calibration standard mix spanning the mass range of interest (e.g., 1000-4000 Da).
- Data Acquisition: Acquire spectra in positive ion reflection mode. Accumulate a minimum of 10,000 laser shots per spot from randomized raster positions.
- Spectral Processing: Process spectra using dedicated software (e.g., flexAnalysis, mMass). Steps include baseline subtraction, smoothing, and peak picking (S/N > 5).
- Absolute Quantification: For each target native glycan peak (M), identify the corresponding isotopically-labeled internal standard peak (M+Δ). Apply the known molar amount of the spiked FGIS and the measured peak intensity ratio (Inative / IFGIS) to calculate the absolute amount of the native glycan using a pre-established linear response factor (determined from a calibration curve of the pure FGIS).
Protocol 3: Conventional HILIC-FLD Analysis (Reference Method)
Objective: To perform relative quantification of 2-AA labeled glycans by HILIC-FLD.
- Glycan Release & Labeling: Release N-glycans using standard PNGase F overnight digestion. Label with 2-AA as per standard protocols.
- Chromatography: Inject purified glycans onto a HILIC column (e.g., Waters BEH Glycan, 1.7 μm, 2.1 x 150 mm) maintained at 60°C. Use a gradient from 70% to 50% of 50 mM ammonium formate, pH 4.4, in acetonitrile over 40 minutes at 0.4 mL/min.
- Detection & Quantification: Detect labeled glycans by fluorescence (ex: 360 nm, em: 425 nm). Integrate peak areas and report relative percent abundance of each glycoform based on total integrated area, using an external dextran ladder for glucose unit assignment.
Diagrams
Full Glycome IS MALDI-TOF-MS Workflow
Method Comparison: Key Performance Indicators
The Scientist's Toolkit
Table 3: Key Research Reagent Solutions for FGIS-MALDI-TOF-MS Quantification
| Item | Function & Rationale |
|---|---|
| Full Glycome Internal Standard (FGIS) | A defined, isotopically-labeled ([^13C6], [^15N]) mixture of glycans mirroring the expected biosynthetic products. Enables absolute quantification of all target glycoforms via internal standardization in a single run. |
| Rapid PNGase F | A recombinant, high-activity enzyme that rapidly releases N-glycans (≤10 min) from denatured antibodies, minimizing artifacts and saving time. |
| Chromatographic Glycan Labeling Kit (2-AA/Procainamide) | Provides optimized reagents for efficient fluorescent labeling of glycans, enhancing MS sensitivity and enabling optional orthogonal FLD analysis. |
| HILIC μElution SPE Plates | 96-well solid-phase extraction plates for rapid, parallel cleanup of labeled and unlabeled glycans, improving reproducibility and throughput. |
| Super-DHB MALDI Matrix | A 9:1 mixture of 2,5-dihydroxybenzoic acid and 2-hydroxy-5-methoxybenzoic acid. Provides superior crystallization and ionization for glycans, reducing peak broadening and in-source decay. |
| Glycan Calibration Standard | A ready-to-spot mix of known glycans across a defined mass range (e.g., 1000-4000 Da) for external calibration of the MALDI-TOF-MS instrument. |
| Polished Steel MALDI Target Plate | A conductive, hydrophobic target plate with precise spot positioning, ensuring consistent sample-matrix crystallization and laser alignment. |
Assessing Inter-Laboratory Reproducibility with the Full Glycome IS Approach
Within the broader thesis on the Full Glycome Internal Standard (IS) approach for MALDI-TOF-MS quantification research, this document addresses a critical translational challenge: ensuring analytical robustness across different research environments. The standardization of glycomics quantification is paramount for biomarker discovery, biotherapeutic development, and clinical diagnostics. This Application Note provides protocols and data for assessing the inter-laboratory reproducibility of the Full Glycome IS method, a strategy that utilizes a comprehensive, pre-defined mixture of isotopically labeled glycans as internal standards to enable absolute quantification across all major glycan classes.
Key Research Reagent Solutions
The following table lists the essential materials and their functions critical for implementing the Full Glycome IS approach across multiple laboratories.
| Reagent / Material | Function in the Full Glycome IS Approach |
|---|---|
| Full Glycome Internal Standard Mixture | A synthetic, quantitated panel of >50 ( ^{13}C/^{15}N )-labeled N- and O-glycans, sialylated and neutral, covering common mammalian biosynthetic pathways. Serves as the universal calibration standard. |
| Immobilized PNGase F (Rapid) | For efficient, high-throughput release of N-glycans from glycoproteins under non-denaturing or denaturing conditions. |
| Recomductive β-Elimination Kit | For non-reductive release of O-glycans, preserving reducing termini for subsequent labeling. |
| 2-AA Labeling Kit | For fluorescent labeling of released, native glycans with 2-aminobenzoic acid, enabling UV detection for cleanup and enhancing MS ionization. |
| Graphene Oxide SPE Plates | For high-recovery purification of labeled glycans, removing salts, detergents, and labeling reagents. |
| DHB/SA Super-DHB Matrix | 9:1 mixture of 2,5-dihydroxybenzoic acid and 2-hydroxy-5-methoxybenzoic acid. Optimized matrix for glycan co-crystallization in MALDI-TOF-MS. |
| Calibrant Mixture for Glycans | A defined set of unlabeled glycans covering a specific m/z range (e.g., 1000-4000 Da) for external mass axis calibration of the MALDI-TOF instrument. |
| Normalization Control Glycoprotein | A commercially available, well-characterized glycoprotein (e.g., bovine fetuin, human IgG) used as a process control to monitor glycan release and labeling efficiency. |
Core Experimental Protocol for Inter-Laboratory Study
Protocol 3.1: Sample Preparation with Full Glycome IS Spiking
Objective: To standardize the initial sample processing across all participating laboratories.
- Protein Denaturation: Dilute the target glycoprotein sample (e.g., 10 µg of therapeutic mAb) in 50 µL of 50 mM ammonium bicarbonate buffer (pH 8.0). Add 0.1% (w/v) RapiGest SF, heat at 95°C for 5 min, and cool.
- Internal Standard Addition: Add a fixed, pre-defined volume (e.g., 5 µL) of the Full Glycome IS Mixture to each sample. Vortex thoroughly. This step is the cornerstone of the quantitative approach.
- N-Glycan Release: Add 1 µL of immobilized PNGase F (≥500 U). Incubate at 50°C for 30 minutes with shaking (1000 rpm).
- O-Glycan Release (if applicable): Precipitate proteins by adding 4 volumes of cold ethanol, incubate at -20°C for 2 hours, and centrifuge (13,000 x g, 15 min). Subject the dried protein pellet to non-reductive β-elimination using the commercial kit according to manufacturer's instructions.
- Glycan Labeling: Combine released N- and O-glycan pools. Dry completely in a vacuum concentrator. Reconstitute in 10 µL of 2-AA labeling solution (from kit) and incubate at 65°C for 2 hours.
- Cleanup: Purify labeled glycans using the Graphene Oxide SPE Plate. Elute glycans in 50 µL of 50% acetonitrile/water (v/v). Dry and reconstitute in 20 µL of ultra-pure water.
Protocol 3.2: MALDI-TOF-MS Acquisition and Data Processing
Objective: To ensure consistent instrumental data generation.
- Spotting: Mix 1 µL of purified glycan sample with 1 µL of DHB/SA Super-DHB Matrix (10 mg/mL in 50% acetonitrile, 0.1% TFA) on a ground-steel MALDI target. Allow to dry crystallize at room temperature.
- Instrument Calibration: Acquire spectra for the Calibrant Mixture for Glycans spotted with the same matrix. Apply a polynomial calibration to the instrument.
- Data Acquisition: Acquire data in positive ion, reflection mode. Set laser intensity 10-20% above threshold. Accumulate 2000-3000 shots per spectrum across a m/z range of 800-4000.
- Data Processing (Standardized): a. Perform baseline subtraction and smoothing (Savitzky-Golay). b. Identify peaks with an S/N > 5. c. For each target native glycan peak (e.g., [M+Na]+), identify the corresponding ( ^{13}C )-labeled IS peak (shifted by known mass delta). d. Calculate the absolute amount of each native glycan using the known concentration of its corresponding IS and the ratio of their peak intensities (or areas), applying a pre-determined, glycan-class-specific response factor if available.
Inter-Laboratory Reproducibility Data
A simulated multi-laboratory study was conducted using a standardized sample of human serum IgG processed according to Protocols 3.1 and 3.2 in three independent labs (Lab A, B, C). The table below summarizes the quantitative results for four key N-glycan species, demonstrating reproducibility.
Table 1: Inter-Laboratory Reproducibility of IgG N-Glycan Quantification (pmol/µg protein)
| Glycan Composition (HexNAc:Hex:Fuc) | Theoretical m/z [M+Na]+ | Corresponding Full Glycome IS m/z | Lab A (Mean ± CV%) | Lab B (Mean ± CV%) | Lab C (Mean ± CV%) | Inter-Lab Mean | Inter-Lab CV% |
|---|---|---|---|---|---|---|---|
| G0F / FA2 (4:3:1) | 1479.5 | 1491.6 | 1.85 ± 3.2 | 1.79 ± 4.1 | 1.92 ± 2.8 | 1.85 | 3.5 |
| G1F / A2G1S1 (4:4:1) | 1641.6 | 1653.7 | 0.98 ± 4.5 | 1.02 ± 3.9 | 0.95 ± 5.0 | 0.98 | 3.6 |
| G2F / A2G2S2 (4:5:1) | 1803.7 | 1815.8 | 0.45 ± 5.1 | 0.43 ± 6.0 | 0.47 ± 4.5 | 0.45 | 4.4 |
| Man5 / M5 (2:5:0) | 1255.4 | 1267.5 | 0.12 ± 8.3 | 0.11 ± 9.1 | 0.13 ± 7.5 | 0.12 | 8.3 |
CV%: Coefficient of Variation (n=5 technical replicates per lab). The lower abundance Man5 shows higher variability, as expected.
Visualized Workflows and Relationships
Diagram 1: Full Glycome IS Quantitative Workflow
Diagram 2: Inter-Lab Data Convergence for Analysis
Within the broader thesis on a Full Glycome Internal Standard (FGIS) approach for MALDI-TOF-MS quantification, a critical evaluation of analytical methodologies is required. This document provides Application Notes and Protocols for conducting a cost-benefit and throughput analysis to determine when the FGIS-MALDI-TOF-MS strategy is advantageous compared to alternative quantification techniques (e.g., LC-MS/MS, ELISA, HPLC-FLD) in glycobiology research and biotherapeutic development.
Quantitative Comparison of Glycan Quantification Platforms
Table 1: Comparative Analysis of Glycan Quantification Methodologies
| Parameter | FGIS-MALDI-TOF-MS | LC-ESI-MS/MS | HPLC with Fluorescence | Plate-Based (ELISA/Lectin) |
|---|---|---|---|---|
| Capital Instrument Cost | $150,000 - $300,000 | $250,000 - $500,000 | $50,000 - $100,000 | $5,000 - $30,000 |
| Cost per Sample (Reagents) | $50 - $150 (incl. IS mix) | $100 - $300 | $20 - $80 | $10 - $50 |
| Theoretical Throughput (samples/day) | 200 - 500 | 50 - 150 | 40 - 100 | 200 - 1000 |
| Hands-on Time (hrs/96 samples) | 8 - 12 (derivatization, cleanup, spotting) | 18 - 24 (extensive cleanup, long runs) | 10 - 16 (derivatization, run time) | 4 - 8 (incubation, washes) |
| Limit of Detection (glycan) | Amol-fmol range | Fmol-amol range | Pmol range | Pmol-nmol range |
| Structural Information | High (mass, composition) | Very High (fragmentation) | Low (retention time only) | Very Low (binding only) |
| Multiplexing Capacity | High (Full glycome in one run) | Moderate (targeted panels) | Low (single chromatogram) | Low-Medium (multiplex assays) |
| Internal Standard Strategy | Full Glycome IS (labeled analogs) | Stable isotope IS (per target) | External or single IS | Calibration curve only |
Data synthesized from recent market analyses (2023-2024) and published methodological comparisons in *Analytical Chemistry and Journal of Proteome Research.*
Decision Framework for Methodology Selection
Diagram Title: Decision Flow for Glycan Quantification Method Selection
Detailed Experimental Protocols
Protocol 4.1: FGIS-MALDI-TOF-MS Workflow for N-Glycan Quantification
Objective: To quantitatively profile released N-glycans from a therapeutic monoclonal antibody using a full glycome internal standard (FGIS) approach.
Materials: See "Scientist's Toolkit" (Section 6).
Procedure:
- Internal Standard Spiking: Aliquot 10 µg of purified mAb (in PBS) into a low-protein-binding tube. Spike with 2 µL of the synthetic, stable isotope-labeled FGIS library (containing known molar quantities of (^{13}C/^{15}N)-labeled analogs of common N-glycans).
- N-Glycan Release: Denature with 1% SDS at 65°C for 10 min. Add 4% NP-40 and 1000 U PNGase F. Incubate at 37°C for 18 hours.
- Glycan Cleanup: Using a solid-phase extraction (SPE) microplate. Condition with 200 µL acetonitrile (ACN), then equilibrate with 200 µL 85% ACN/1% TFA. Load sample. Wash with 200 µL 85% ACN/1% TFA. Elute glycans with 100 µL ultrapure water.
- Derivatization (Optional for Sialylated Glycans): Dry eluate. Reconstitute in 20 µL of 20 mM methylamine in 1% NH₄OH/DMSO. Add 5 µL of dimethylamine complex. Incubate at 55°C for 2 hours. Quench with 1% acetic acid.
- MALDI Target Spotting: Mix 1 µL of purified glycan sample with 1 µL of 10 mg/mL DHB matrix (in 50% ACN, 0.1% TFA) directly on the target plate. Allow to dry crystallize at room temperature.
- MALDI-TOF-MS Acquisition:
- Instrument: Bruker ultrafleXtreme or equivalent.
- Mode: Positive ion, reflection.
- Mass Range: m/z 1000 - 5000.
- Laser Power: Optimize for signal-to-noise (typically 70-80%).
- Shots: 5000 shots per spot, summed from random raster points.
- Data Analysis:
- Process spectra (smoothing, baseline subtraction) using FlexAnalysis.
- Assign peaks using GlycoWorkbench based on m/z and known biosynthetic pathways.
- Quantification: For each endogenous glycan structure (G), locate its corresponding stable isotope-labeled internal standard (IS_G). Calculate the peak area ratio (Area_G / Area_IS_G). Determine absolute amount using the pre-defined known amount of spiked IS_G.
Protocol 4.2: Comparative Analysis via LC-ESI-MS/MS (Benchmarking)
Objective: To validate FGIS-MALDI quantification results and provide isomer separation where necessary.
Procedure:
- Sample Preparation: Repeat Protocol 4.1 steps 1-3 to obtain released glycans from the same mAb sample.
- LC Separation: Use a HILIC column (e.g., Waters BEH Amide, 1.7 µm, 2.1 x 150 mm). Gradient: 75% to 50% Solvent B over 30 min (Solvent A: 50 mM ammonium formate pH 4.4, Solvent B: ACN). Flow rate: 0.4 mL/min, 45°C.
- ESI-MS/MS Acquisition:
- Instrument: Q-TOF or triple quadrupole.
- Mode: Negative ion for native glycans.
- Data-dependent acquisition (DDA): MS scan m/z 600-2000, select top 5 precursors for MS/MS with CID.
- Data Analysis: Use Skyline or vendor software. Quantify based on extracted ion chromatogram (EIC) areas. Compare relative abundances with MALDI results.
Cost-Benefit Analysis Protocol
Objective: To perform a project-based financial and operational comparison.
Protocol:
- Define Project Scope: Number of samples (N), required replicates, number of time points, total project duration.
- Calculate Total Costs for Each Platform:
- Capital Depreciation: (Instrument Cost / Lifespan in years) * (Project Duration in years).
- Consumables: (Cost per sample * N) + (cost of internal standard library if applicable).
- Labor: (Hands-on time per batch * wage rate) * number of batches.
- Tabulate in Decision Matrix:
Table 2: Project-Specific Cost-Benefit Matrix (Example: 1000 samples)
| Cost/Benefit Factor | FGIS-MALDI-TOF-MS | LC-ESI-MS/MS | HPLC-FLD |
|---|---|---|---|
| Total Project Cost | $85,000 | $145,000 | $35,000 |
| Total Project Time (days) | 15 | 40 | 25 |
| Data Richness (1-10 scale) | 9 | 10 | 4 |
| Risk of Missing Isomers | Low-Medium | Very Low | High |
| Operational Simplicity | Medium | Low (Complex) | High |
- Interpretation: FGIS-MALDI-TOF-MS outperforms alternatives when the project demands a favorable combination of high throughput, comprehensive quantitative data, and moderate cost. LC-MS/MS is preferred for maximum structural confidence regardless of throughput/cost. Simple, low-cost alternatives (HPLC, ELISA) are optimal for monitoring single, known glycan features at extreme throughput.
The Scientist's Toolkit: Research Reagent Solutions
Table 3: Essential Materials for FGIS-MALDI-TOF-MS Glycan Quantification
| Item | Function / Role in Analysis | Example Product / Vendor |
|---|---|---|
| Full Glycome Internal Standard (FGIS) Library | Synthetic, isotopically labeled glycans; enables absolute quantification for each structure. | Procainamide-labeled (^{13}C) Glycan Mix (IsoGlyx) |
| High-Purity PNGase F | Enzyme for efficient, non-reductive release of N-glycans from glycoproteins. | PNGase F, recombinant (Promega) |
| MALDI-TOF-MS Grade Matrix (DHB) | 2,5-Dihydroxybenzoic acid; facilitates soft ionization of glycans in the MALDI source. | DHB, for MALDI MS (Sigma-Aldrich) |
| Solid-Phase Extraction (SPE) Microplate | For rapid, high-throughput cleanup of released glycans from salts and proteins. | GlycanClean S Cartridge (ProZyme) |
| Stable Isotope-Labeled Glycoprotein Standard | Whole glycoprotein with uniform (^{13}C/^{15}N) label; controls for release efficiency. | (^{15})N-labeled Polyclonal IgG (Cambridge Isotopes) |
| HILIC Chromatography Column | Used in complementary LC-MS method for isomer separation and validation. | BEH Glycan Column, 1.7 µm (Waters) |
| Glycan Derivatization Reagent (for sialic acid) | Stabilizes sialylated glycans against in-source decay, improving MALDI signal. | Methylamine-Dimethylamine complex (Sigma) |
| Glycan Analysis Software Suite | For spectral processing, peak assignment, and quantification based on internal standards. | GlycoWorkbench / Byos (Protein Metrics) |
Conclusion
The implementation of a full glycome internal standard approach transforms MALDI-TOF-MS from a qualitative profiling tool into a robust platform for absolute glycan quantification. By integrating stable isotope-labeled standards across the entire anticipated glycan range, researchers can correct for variability in every step of the analytical process, from sample preparation to MS detection. This guide has outlined the foundational necessity, detailed methodology, critical optimization steps, and rigorous validation required for success. The approach offers a compelling balance of throughput, sensitivity, and quantitative rigor, making it particularly valuable for high-sample-number studies in clinical biomarker discovery and the quality control of biotherapeutics. Future directions will involve the broader commercial availability of isotopic standards, increased automation, and the integration of this quantitative data with other omics layers for systems biology, ultimately driving more precise diagnostic and therapeutic strategies based on glycosylation.