A Robust HILIC-UPLC Protocol for IgG N-Glycan Analysis: From Fundamentals to Clinical and Biopharmaceutical Applications
This article provides a comprehensive guide to the analysis of Immunoglobulin G (IgG) N-glycosylation using Hydrophilic Interaction Liquid Chromatography with Ultra-Performance Liquid Chromatography (HILIC-UPLC).
A Robust HILIC-UPLC Protocol for IgG N-Glycan Analysis: From Fundamentals to Clinical and Biopharmaceutical Applications
Abstract
This article provides a comprehensive guide to the analysis of Immunoglobulin G (IgG) N-glycosylation using Hydrophilic Interaction Liquid Chromatography with Ultra-Performance Liquid Chromatography (HILIC-UPLC). IgG N-glycans are critical post-translational modifiers that influence antibody stability, half-life, and effector functions like antibody-dependent cellular cytotoxicity (ADCC), making their precise profiling essential in biopharmaceutical development and clinical biomarker discovery. We detail a validated, high-throughput protocol encompassing IgG isolation, glycan release, fluorescent 2-aminobenzamide (2-AB) labeling, HILIC-UPLC separation, and data analysis. The content further addresses common troubleshooting scenarios, method validation against alternative platforms, and explores the growing applications of this technique in monitoring therapeutic antibody critical quality attributes and identifying disease-associated glycosylation signatures in population studies.
Why IgG N-Glycosylation Matters: Linking Structure to Function in Health and Disease
The Critical Role of Fc Glycosylation in IgG Effector Functions
Immunoglobulin G (IgG) is the most abundant antibody in human blood and serves as a major effector molecule of the humoral immune system [1] [2]. The crystallizable fragment (Fc) region of IgG contains a highly conserved N-linked glycosylation site at asparagine 297 (Asn-297) within the CH2 domain [3] [2]. This Fc glycan is not merely a structural component but a central mechanism in the diversification of antibody function [3]. The composition of this complex biantennary glycan profoundly influences IgG structure and determines its capacity to engage various effector molecules and cells, thereby modulating immune responses [3] [1]. The critical importance of Fc glycosylation is evidenced by its role in both pro-inflammatory and anti-inflammatory pathways, making it a crucial factor in maintaining immune homeostasis and a growing target for therapeutic interventions [3].
Structural and Biological Foundations of Fc Glycosylation
Architecture of the Fc Glycan
The core Fc glycan is composed of a heptasaccharide structure containing four N-acetylglucosamine (GlcNAc) and three mannose (Man) residues [3] [4]. This core structure serves as a foundation for various modifications that generate remarkable diversity in IgG functionality. The mature Fc glycan can be modified by the addition of a core fucose (Fuc), bisecting GlcNAc, galactose (Gal) on one or both arms, and terminal sialic acid (N-acetylneuraminic acid or NeuAc) [3]. These modifications occur through a sophisticated biosynthetic pathway beginning in the endoplasmic reticulum with the transfer of a pre-assembled oligosaccharide to Asn-297, followed by sequential remodeling by glycosidases and glycosyltransferases in the Golgi apparatus [3].
Table 1: Core Fc Glycan Modifications in Human IgG1
| Glycan Feature | Modifying Enzyme | Functional Significance |
|---|---|---|
| Core Fucose | α-1,6-fucosyltransferase (FUT8) | Reduces binding to FcγRIIIa, decreasing ADCC |
| Bisecting GlcNAc | β-1,4-N-Acetylglucosaminyltransferase III (GNT-III) | May enhance FcγRIIIa-mediated activities; inhibits fucosylation |
| Galactose | β-1,4-galactosyltransferase 1 (B4GALT1) | Precursor for sialylation; may influence complement activation |
| Sialic Acid | α-2,6-sialyltransferase 1 (ST6GAL1) | Promotes anti-inflammatory activity through Type II FcγR engagement |
Impact of Glycan Composition on IgG Structure and Stability
The Fc glycan plays an essential structural role in maintaining the proper conformation of the CH2 domain [4]. Structural studies have demonstrated that deglycosylated IgGs exhibit an open CH2 domain conformation that significantly affects the neighboring hinge region [4]. Small-angle X-ray scattering experiments have revealed that deglycosylated Fc fragments have larger radii of gyration compared to their glycosylated counterparts, indicating a more open and flexible structure [4]. This structural disruption has functional consequences, as the proper Fc conformation is necessary for optimal binding to Fcγ receptors and complement components [1] [4].
Quantitative Impact of Specific Glycan Features on Effector Functions
Fucosylation and ADCC Enhancement
Core fucosylation represents one of the most impactful modifications on IgG effector function. Remarkably, just a 1% decrease in Fc fucosylation can lead to a more than 25% increase in antibody-dependent cell-mediated cytotoxicity (ADCC) [5]. This dramatic effect stems from the structural basis of afucosylated IgG binding to FcγRIIIa. When IgG lacks core fucose, a unique carbohydrate-carbohydrate interaction occurs between the N-glycan of IgG and the N-glycan of FcγRIIIa at position N162, substantially enhancing binding affinity [5]. Afucosylated antibodies can demonstrate up to a 50-fold increase in binding to FcγRIIIa and approximately 100-fold greater ADCC effect compared to their fucosylated counterparts [5]. This principle has been successfully applied to enhance the efficacy of therapeutic antibodies such as rituximab and trastuzumab [5].
Galactosylation and Complement Activation
Galactosylation status influences complement-dependent cytotoxicity (CDC), though its impact on ADCC is minimal in fucosylated antibodies [5]. Terminal galactose residues promote hexamerization of human IgG1, leading to enhanced classical complement activation by increasing binding affinity for C1q [5]. Structural analyses indicate that the G2 glycoform (with two galactose residues) forms more hydrogen bonds between sugar residues and amino acids compared to the G0 species (no galactose), thereby stabilizing the CH2 domain and facilitating complement activation [5]. Studies with alemtuzumab have confirmed that removal of galactose reduces CDC activity, highlighting the functional importance of this modification [5].
Sialylation and Anti-inflammatory Effects
Sialic acid, the only charged sugar species in the Fc glycan, has significant effects on the Fc domain structure and function [3] [5]. Fc sialylation has been demonstrated to reduce binding to Type I FcγRs while enabling engagement of Type II FcγRs, particularly DC-SIGN on regulatory macrophages [3]. This engagement triggers a cascade involving interleukin-33 (IL-33) and subsequent IL-4 production by basophils, resulting in increased expression of the inhibitory receptor FcγRIIb on effector myeloid cells [3]. This pathway explains the potent anti-inflammatory activity of intravenous immunoglobulin (IVIg) in treating autoimmune and inflammatory conditions, which is mediated by the sialylated IgG fraction within the preparation [3].
High-Mannose Glycans
Although high-mannose glycans (Man5-Man9) typically represent a small fraction of IgG glycans, they can significantly impact effector functions [5]. Antibodies with high-mannose content demonstrate higher binding affinity to FcγRIIIa and enhanced ADCC activity, primarily because these glycans lack core fucose [5]. However, high-mannose glycans also reduce binding to FcγRII and show substantial deficiency in C1q binding, thereby diminishing classical complement activity [5].
Table 2: Quantitative Impact of Fc Glycan Features on Effector Functions
| Glycan Feature | Structural Change | Functional Impact | Quantitative Effect |
|---|---|---|---|
| Afucosylation | Enables carbohydrate-carbohydrate interaction with FcγRIIIa | Enhanced ADCC | 1% decrease in fucose → >25% increase in ADCC [5] |
| Galactosylation | Stabilizes CH2 domain; promotes IgG hexamerization | Enhanced CDC | Alemtuzumab: galactose removal reduces CDC [5] |
| Sialylation | Closes binding site for activating FcγRs; enables DC-SIGN binding | Anti-inflammatory activity | IVIg: sialylated fraction (minor subset) mediates anti-inflammatory effects [3] |
| High Mannose | Lacks core fucose; different structural conformation | Enhanced ADCC; Reduced CDC | Up to 10% high mannose observed in some mAbs [5] |
HILIC-UPLC-FLR Protocol for IgG N-Glycan Analysis
IgG Purification and Isolation
For reliable analysis of IgG Fc glycosylation, proper antibody purification is essential. For plasma or serum samples, begin with 20-30 μL of plasma diluted in 4 mL of phosphate-buffered saline (PBS). For alternative biofluids such as saliva, which contains significantly lower IgG concentrations (~0.014 mg/mL versus ~12.5 mg/mL in plasma), start with 0.5-5 mL of sample [2]. Add 20 μL of Protein G Agarose Fast Flow beads to the diluted sample and incubate for 2 hours at 800 rpm on a plate shaker to facilitate IgG capture [2]. After incubation, wash the IgG-bound beads three times with 200 μL PBS and three times with 200 μL deionized water using a vacuum manifold. Elute IgGs from the beads by incubation in 100 mM formic acid for 15 minutes at room temperature, then collect the eluate in a plate containing 17 μL of 1 M ammonium bicarbonate for neutralization [2].
N-Glycan Release, Labeling, and Cleanup
Transfer 50 μL of purified IgG samples to a PCR plate and dry for 2 hours at 37°C in a vacuum centrifuge [2]. Denature the IgG samples with sodium dodecyl sulfate (SDS) and incubate at 65°C for 10 minutes. Enzymatically release N-glycans using PNGase F according to manufacturer specifications [6] [2]. For fluorescent labeling, utilize a two-step procainamide hydrochloride (ProA) labeling procedure: First, add 25 μL of procainamide mixture (4.32 mg ProA in glacial acetic acid/dimethyl sulfoxide, 30:70) to each sample and incubate at 65°C for 1 hour. Then, add 25 μL of reducing agent solution (4.48 mg 2-picoline borane in glacial acetic acid/dimethyl sulfoxide, 30:70) and incubate at 65°C for an additional 1.5 hours [2].
HILIC-UPLC Chromatographic Analysis
Separate fluorescently labeled N-glycans using hydrophilic interaction liquid chromatography (HILIC) on a UPLC system equipped with a fluorescence detector [7] [2]. Employ a Waters BEH Glycan chromatography column (100 × 2.1 mm i.d., 1.7 μm BEH particles) with the column temperature maintained at 60°C [7]. Use the following mobile phases: solvent A: 100 mM ammonium formate (pH 4.4) and solvent B: acetonitrile (ACN). Apply a linear gradient from 75% to 62% solvent B over 25 minutes at a constant flow rate of 0.4 mL/min [7]. Set the fluorescence detector to excitation at 330 nm and emission at 420 nm for optimal ProA-labeled glycan detection [7].
Data Processing and Analysis
Process obtained chromatograms to separate peaks corresponding to different glycan structures. Using appropriate software (e.g., Empower 3), manually integrate 24 distinct chromatographic peaks representing the major IgG glycoforms [7]. Perform relative quantification of glycan features by total area normalization, calculating the relative abundance of each glycan structure as a percentage of the total integrated area [7]. For accurate peak assignment, characterize each chromatographic peak using reference standards or prior structural characterization by mass spectrometry [7].
Impact of Fc Glycosylation on Effector Functions
The Scientist's Toolkit: Essential Research Reagents
Table 3: Essential Research Reagents for IgG Glycosylation Analysis
| Reagent/Equipment | Specific Example | Application Purpose |
|---|---|---|
| Protein G Agarose Beads | Protein G Agarose Fast Flow beads (Merck Millipore) | IgG purification from biological samples [2] |
| Glycan Release Enzyme | PNGase F (Promega) | Enzymatic release of N-glycans from IgG [2] |
| Fluorescent Label | Procainamide hydrochloride (Sigma-Aldrich) | Glycan labeling for detection [2] |
| HILIC-UPLC Column | Waters BEH Glycan column (100 × 2.1 mm, 1.7 μm) | Chromatographic separation of labeled glycans [7] |
| Mobile Phase A | 100 mM ammonium formate, pH 4.4 | Aqueous solvent for HILIC separation [7] |
| Mobile Phase B | Acetonitrile (ACN) | Organic solvent for HILIC separation [7] |
Applications in Therapeutic Antibody Development
The strategic manipulation of Fc glycosylation has become a powerful tool in optimizing therapeutic antibodies for enhanced efficacy and tailored functionality. Glycoengineering approaches are now being implemented to control specific glycan features that directly impact therapeutic activity [5]. For antibodies where enhanced target cell killing is desired, such as in oncology applications, producing afucosylated variants can dramatically increase ADCC potency, as demonstrated with anti-HER2 and anti-CD20 antibodies [5]. Conversely, for antibodies where effector functions may be detrimental or in anti-inflammatory applications, increasing sialylation levels can promote anti-inflammatory pathways [3]. The development of biosimilar products requires particular attention to glycosylation, as minor differences in glycan patterns can significantly impact clinical safety and efficacy profiles [5]. Implementing Quality by Design (QbD) principles with Fc glycans as potential critical quality attributes (CQAs) ensures consistent product quality throughout development and manufacturing [5].
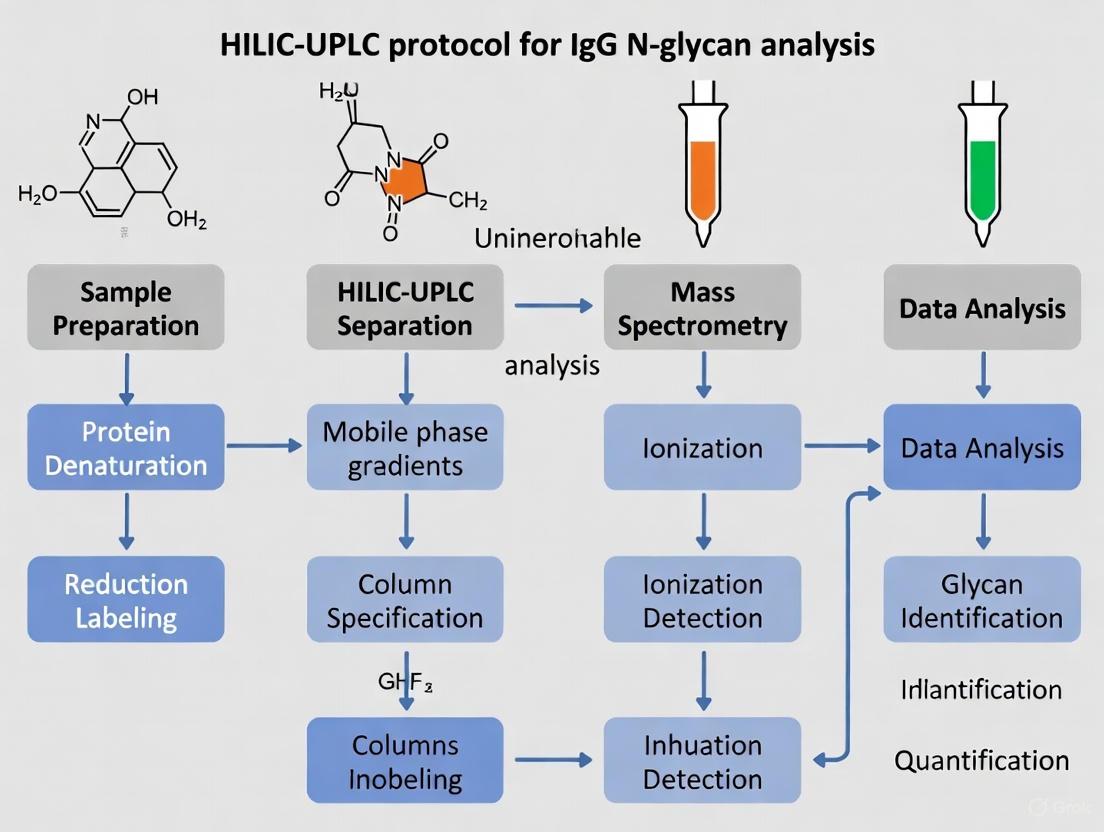
HILIC-UPLC IgG N-Glycan Analysis Workflow
Fc glycosylation represents a critical structural and functional determinant of IgG activity, serving as a natural mechanism for fine-tuning immune responses. The precise composition of the Fc glycan directly influences antibody effector functions by modulating interactions with Fcγ receptors and complement components. Through advanced analytical techniques such as HILIC-UPLC-FLR, researchers can quantitatively profile IgG glycosylation patterns with high sensitivity and reproducibility. This capability enables both basic research into immune function and applied applications in therapeutic antibody development and biomarker discovery. As our understanding of structure-function relationships deepens, and glycoengineering technologies advance, targeted manipulation of Fc glycosylation will continue to provide powerful strategies for optimizing antibody-based therapeutics and developing novel diagnostic approaches.
IgG Glycosylation as a Biomarker for Autoimmune Diseases and Cancer
Immunoglobulin G (IgG) is the most abundant antibody in human serum, accounting for approximately 10–20% of the total plasma proteome and acting as the cornerstone of adaptive immunity [8]. The biological and effector functions of IgG are critically modulated by N-linked glycosylation at the highly conserved Asn-297 residue in the Fc region [8] [9]. This post-translational modification consists of a core biantennary structure that can be further embellished with various monosaccharides, including fucose, galactose, sialic acid, and bisecting N-acetylglucosamine (GlcNAc) [8]. The specific composition and relative abundance of these glycan structures, often referred to as glycoforms, can dramatically alter the three-dimensional conformation of the IgG Fc region, thereby affecting its binding affinity to Fc gamma receptors (FcγRs) and complement component C1q [9] [10]. This, in turn, regulates critical immune effector mechanisms such as antibody-dependent cellular cytotoxicity (ADCC), complement-dependent cytotoxicity (CDC), and antibody-dependent cellular phagocytosis (ADCP) [9] [10].
In healthy individuals, the IgG N-glycome maintains a relatively stable composition, characterized by high core fucosylation (>90%), approximately 35% agalactosylation (G0), 35% monogalactosylation (G1), 15% digalactosylation (G2), and 10–15% sialylation [8] [9]. However, this profile is highly dynamic and sensitive to physiological and pathological changes. Aberrant IgG glycosylation patterns are now recognized as hallmarks of various disease states, including autoimmune disorders and cancer [8] [11] [10]. These disease-specific glycan signatures offer immense potential as novel biomarkers for early detection, differential diagnosis, patient stratification, and monitoring treatment responses [8] [9] [11]. The analysis of IgG glycosylation, particularly through advanced chromatographic techniques like HILIC-UPLC, provides a powerful tool for uncovering these biomarkers and understanding their functional implications in disease pathophysiology [7] [2].
IgG N-Glycan Analysis via HILIC-UPLC
The hydrophilic interaction liquid chromatography with ultra-performance liquid chromatography (HILIC-UPLC) platform provides a robust, high-resolution, and high-throughput method for the separation and relative quantification of fluorescently labelled IgG N-glycans [7] [2]. The entire workflow, from IgG isolation to data analysis, is designed to ensure reproducibility and sensitivity, making it suitable for large-scale clinical and biomarker studies.
Detailed Step-by-Step Protocol
IgG Purification and Preparation
- Sample Collection: Collect biological samples (e.g., plasma, serum, or saliva) under standardized conditions. For saliva, donors should rinse their mouths and abstain from eating for at least one hour prior to collection [2]. Blood samples should be centrifuged (e.g., 2700 g for 10 minutes) to obtain clear plasma or serum.
- IgG Capture: Use bead-based immunoprecipitation for high specificity.
- Add 20 μL of Protein G Agarose Fast Flow beads to 5 mL of saliva or 30 μL of plasma diluted in 4 mL of phosphate-buffered saline (PBS) [2].
- Incubate the mixture for 2 hours at 800 rpm on a plate shaker to facilitate IgG binding.
- Wash the IgG-bound beads three times with 200 μL PBS and three times with 200 μL deionized water using a vacuum manifold and a 96-well filter plate (10-μm pore size) [2].
- IgG Elution: Elute the purified IgG from the beads by incubating in 100 mM formic acid for 15 minutes at room temperature. Collect the eluate by centrifugation into a PCR plate containing 17 µL of 1 M ammonium bicarbonate for neutralization [2].
- Sample Drying: Transfer 50 µL of the eluted IgG sample to a new plate and dry for 2 hours at 37°C in a vacuum centrifuge [2].
N-Glycan Release, Labelling, and Clean-Up
- Denaturation and Release: Resuspend the dried IgG pellets in a denaturation buffer containing sodium dodecyl sulfate (SDS) and incubate at 65°C. Subsequently, release the N-glycans enzymatically by adding PNGase F and incubating at 37°C [2].
- Fluorescent Labelling: Label the released glycans using procainamide hydrochloride (ProA) via a reductive amination process [2].
- Add 25 µL of a procainamide mixture in glacial acetic acid/dimethyl sulfoxide (30:70 v/v) to each sample and incubate at 65°C for 1 hour.
- Then, add 25 µL of a reducing agent solution (2-picoline borane in the same acetic acid/DMSO solvent) and incubate at 65°C for an additional 1.5 hours [2].
- Clean-Up: Purify the ProA-labelled N-glycans using a solid-phase extraction method, such as a 96-well GHP filter plate, to remove excess labeling reagents and salts [2].
HILIC-UPLC Analysis
- Chromatography System: Use a Waters Acquity UPLC H-class instrument equipped with a fluorescence (FLR) detector (excitation: 330 nm, emission: 420 nm) [7].
- Chromatography Column: Perform the separation on a Waters bridged ethylene hybrid (BEH) Glycan column (100 × 2.1 mm i.d., 1.7 μm BEH particles) maintained at 60°C [7].
- Mobile Phase:
- Solvent A: 100 mM ammonium formate, pH 4.4.
- Solvent B: Acetonitrile (ACN) [7].
- Separation Gradient: Employ a linear gradient from 75% to 62% solvent B over 25 minutes at a constant flow rate of 0.4 mL/min [7].
- Data Integration: Process the obtained chromatograms using appropriate software (e.g., Empower 3). Manually integrate the peaks, which can typically be grouped into 24 primary glycan peaks [7]. The relative abundance of each glycan structure is calculated using the total area normalization method, where the area of each peak is expressed as a percentage of the total integrated chromatogram area [7].
The Scientist's Toolkit: Essential Research Reagents
Table 1: Key reagents and materials for HILIC-UPLC-based IgG N-glycan analysis.
| Item | Function / Application | Example / Specification |
|---|---|---|
| Protein G Agarose Beads | Affinity purification of IgG from biological samples. | Protein G Agarose Fast Flow [2]. |
| PNGase F | Enzyme that catalyzes the release of N-linked glycans from the IgG protein backbone. | Promega [2]. |
| Procainamide (ProA) | Fluorescent dye for labelling released glycans, enabling sensitive detection. | Procainamide Hydrochloride [2]. |
| HILIC-UPLC Column | Core chromatography column for high-resolution separation of glycans based on hydrophilicity. | Waters BEH Glycan Column, 1.7 μm, 2.1x100 mm [7]. |
| Mobile Phase Buffers | Solvents for creating the gradient elution during UPLC separation. | Solvent A: 100 mM Ammonium Formate, pH 4.4; Solvent B: Acetonitrile [7]. |
Diagram 1: HILIC-UPLC IgG N-glycan analysis workflow.
IgG Glycosylation as a Biomarker in Autoimmune Diseases
In autoimmune diseases, a shift towards pro-inflammatory IgG glycoforms is a common finding. These specific alterations are not merely epiphenomena but are functionally involved in the pathogenesis, influencing disease activity and severity [8] [10].
Disease-Specific Glycosylation Alterations
The IgG glycome undergoes characteristic changes in different autoimmune conditions, serving as a sensitive reflector of the underlying immunologic dysregulation.
Table 2: IgG N-glycan alterations in autoimmune diseases and cancer.
| Disease Category | Specific Condition | Reported Alterations in IgG Fc Glycans | Functional Consequence |
|---|---|---|---|
| Autoimmune | Rheumatoid Arthritis | ↓ Galactosylation, ↓ Sialylation [8] [10] | Increased pro-inflammatory activity [10] |
| Autoimmune | Systemic Lupus Erythematosus | ↓ Galactosylation, ↓ Sialylation [10] | Enhanced complement activation [10] |
| Autoimmune | Vasculitis (ANCA-associated) | ↓ Galactosylation (predicts relapse) [9] | More aggressive disease course [9] |
| Cancer | Multiple Cancers (e.g., Gastric, Liver, Ovarian) | ↑ Agalactosylation (G0), ↑ Core Fucosylation, ↑ Bisecting GlcNAc [11] | Modulated ADCC/CDC; biomarker for detection [11] |
| Cancer | Severe COVID-19 (for comparison) | ↑ Agalactosylation, ↑ Bisecting GlcNAc, ↓ Fucosylation, ↓ Sialylation [9] | Potential prognostic indicator [9] |
Functional Consequences of Altered Glycosylation in Autoimmunity
The specific glycosylation changes detailed in Table 2 have direct and profound effects on IgG effector functions. A hallmark finding across several autoimmune diseases, including rheumatoid arthritis (RA) and systemic lupus erythematosus (SLE), is a decrease in galactosylation and sialylation, leading to an increase in agalactosylated (G0) structures [8] [10]. Agalactosylated IgG has a higher binding affinity for mannose-binding lectin (MBL), activating the lectin complement pathway and exacerbating inflammation [10]. Furthermore, the reduction of terminal sialic acid residues on IgG Fc glycans biases the immune response towards a pro-inflammatory state by enhancing the binding to activating Fcγ receptors (e.g., FcγRIIIa) on immune effector cells like natural killer (NK) cells, thereby potentiating ADCC [10]. Conversely, the anti-inflammatory activity of intravenous immunoglobulins (IVIg) is critically dependent on the presence of sialic acid; enzymatic removal of sialic acid abrogates its therapeutic effect [10]. These findings underscore that IgG glycosylation acts as a critical molecular switch, modulating antibody function from anti-inflammatory to pro-inflammatory in autoimmune settings.
IgG Glycosylation as a Biomarker in Cancer
The neoplastic process induces systemic changes in humoral immunity, which are reflected in the serum IgG glycome. These changes represent a rich source of biomarkers for early cancer detection, prognosis, and monitoring [11].
Pan-Cancer Glycosylation Signatures
Studies across multiple cancer types have revealed consistent alterations in IgG glycosylation. A comprehensive review noted that changes in serum IgG glycosylation patterns correspond to similar alterations in 12 different types of cancer, including gastric, liver, ovarian, and lung cancer [11]. Common alterations observed in cancer patients include an increase in agalactosylated (G0) glycans, elevated levels of core fucosylation, and an increase in bisecting GlcNAc [11]. For instance, in hepatocellular carcinoma, elevated core-fucosylated IgG has been identified as a specific marker for the disease [11]. These glycan changes are believed to reflect the body's humoral immune status and pathological state, making them promising non-invasive biomarkers that could compensate for the limitations of previously identified glycobiomarkers [11].
Functional and Diagnostic Implications
The glycosylation changes in cancer are not just biomarkers but also have functional significance for antibody activity. For example, a lack of core fucose on IgG1 can increase its binding affinity to FcγRIIIa by up to 17-fold, dramatically enhancing ADCC, a key mechanism exploited by therapeutic monoclonal antibodies [11] [10]. However, the naturally occurring increase in core fucosylation observed in some cancers might conversely dampen this anti-tumor immune response. The diagnostic power of these signatures is significant. For example, IgG N-glycan models have shown the ability to discriminate patients with ovarian cancer from healthy controls with high sensitivity and specificity, potentially aiding in the early detection of this malignancy which often presents at a late stage [11]. The analysis of IgG glycosylation, therefore, provides a powerful platform for developing novel diagnostic and prognostic assays in oncology.
Diagram 2: Functional roles of specific IgG Fc glycan features.
Immunoglobulin G (IgG) antibodies are glycoproteins, with the majority of glycosylation occurring at a conserved asparagine 297 (Asn-297) site in the Fc region of each heavy chain [12]. The glycans attached to this site are predominantly complex-type biantennary N-glycans, and their composition exhibits significant microheterogeneity, meaning a variety of different glycan structures can occupy the same site [12]. This glycosylation is not merely a structural adornment; it is a critical functional determinant that profoundly modulates IgG's effector functions, including its interactions with Fcγ receptors (FcγRs) and the C1q component of the complement system, thereby influencing antibody-dependent cell-mediated cytotoxicity (ADCC) and complement-dependent cytotoxicity (CDC) [12] [5]. The analysis of these glycan traits is therefore essential in both biomedical research and biotherapeutic development. The HILIC-UPLC (Hydrophilic Interaction Liquid Chromatography-Ultra Performance Liquid Chromatography) protocol provides a robust, high-resolution platform for the quantitative profiling of IgG N-glycans, enabling researchers to correlate specific glycan features with biological activity and disease states [7] [13]. This document details the functional impact of three key glycan traits—afucosylation, galactosylation, and sialylation—within the context of this analytical framework.
Quantitative Functional Impact of Key Glycan Traits
The composition of the Fc glycan is a pivotal critical quality attribute (CQA) for therapeutic antibodies, as subtle changes can lead to dramatic functional consequences. The table below summarizes the quantitative impact of specific glycan traits on IgG effector functions, based on empirical studies.
Table 1: Quantitative Impact of Fc Glycan Traits on IgG Effector Functions
| Glycan Trait | Key Functional Impact | Quantitative Effect | Relevant Assays |
|---|---|---|---|
| Afucosylation | Increased binding to FcγRIIIa | ≈50-fold increase in binding affinity; >25% increase in ADCC with just 1% decrease in fucosylation [5] | FcγRIIIa binding assays, ADCC bioassays |
| Increased binding to FcγRIIIb | Significantly enhances human neutrophil phagocytosis [5] | FcγRIIIb binding, phagocytosis assays | |
| Galactosylation | Modulates Complement-Dependent Cytotoxicity (CDC) | Promotes IgG1 hexamerization, enhancing C1q binding and CDC activity; removal reduces CDC [5] | C1q binding assays, CDC bioassays |
| Impact on ADCC | Enhances ADCC in afucosylated mAbs; minimal contribution to fucosylated species [5] | ADCC bioassays | |
| Sialylation | Effect on ADCC & FcγR Binding | Inconsistent reports: either negatively affects or shows no impact on ADCC and FcγRIIIa binding [5] | FcγR binding panels, ADCC bioassays |
| Effect on Complement | Contradictory findings: both increases and no impact on C1q binding reported [5] | C1q binding assays, CDC bioassays | |
| High Mannose | Increased ADCC | Higher binding to FcγRIIIa and increased ADCC (due to absence of fucose) [5] | FcγRIIIa binding, ADCC bioassays |
| Reduced CDC | Substantial deficiency in C1q binding and classical complement activity [5] | C1q binding assays, CDC bioassays |
Detailed HILIC-UPLC Protocol for IgG N-Glycan Analysis
The following section provides a detailed methodology for the profiling of IgG N-glycans using HILIC-UPLC, a core technique for generating the quantitative data on glycan traits like those discussed above.
Sample Preparation and Glycan Release
- IgG Isolation: Isolate IgG from serum or other biological fluids using a protein G monolithic plate. Elute the bound IgG using formic acid and promptly neutralize the eluate with ammonium bicarbonate [13].
- N-Glycan Release: Add the PNGase F enzyme to the purified IgG samples and incubate to enzymatically release the N-glycans from the protein backbone [13].
- Fluorescent Labeling: Label the released glycans by adding a solution containing 2-aminobenzamide (2-AB). Fluorescent labeling is essential for sensitive detection with a fluorescence (FLR) detector in the subsequent UPLC analysis [13]. Alternative tags, such as RapiFluor-MS (RFMS) or novel imidazolium-based tags (e.g., 4'GITag), can be used to enhance sensitivity, particularly when coupling with mass spectrometry (MS) [14] [15].
HILIC-UPLC Instrumentation and Separation
- Chromatography System: Utilize a Waters Acquity UPLC H-class instrument or equivalent, equipped with a fluorescence detector (FLR) [7].
- Detection Parameters: Set the FLR to an excitation wavelength of 330 nm and an emission wavelength of 420 nm for 2-AB labeled glycans [7].
- Chromatography Column: Perform the separation on a Waters bridged ethylene hybrid (BEH) Glycan chromatography column (100 × 2.1 mm i.d., packed with 1.7 µm BEH particles) [7].
- Mobile Phase: Use the following mobile phases:
- Separation Gradient: Employ a linear gradient from 75% to 62% solvent B (v/v) over a 25-minute analytical run at a constant flow rate of 0.4 mL/min [7].
- Column Temperature: Maintain the column at a temperature of 60°C throughout the analysis [7].
Data Integration and Analysis
- Peak Integration: Process the obtained chromatograms using appropriate software (e.g., Empower 3). Manually integrate the chromatogram to separate it into 24 distinct peaks (GP1-GP24) to ensure analytical consistency across samples [7] [13].
- Relative Quantification: Calculate the relative abundance of each of the 24 directly measured glycan peaks using the total area normalization method. The relative abundance of a peak is its percentage of the total integrated glycan peak area [7] [13].
- Derived Glycan Traits: From the initial 24 peaks, calculate the proportions of four major glycosylation features: fucosylation, galactosylation (mono- and digalactosylation), sialylation, and bisecting N-acetylglucosamine (GlcNAc). These are composite traits derived from the summed relative abundances of relevant individual peaks [13].
Biological Pathways and Functional Consequences
The specific glycan structures attached to Asn-297 directly influence the three-dimensional conformation of the Fc region, thereby modulating its intermolecular interactions. The following diagram and sections detail the biological pathways and functional consequences of afucosylation, galactosylation, and sialylation.
Impact of Afucosylation
Afucosylation refers to the absence of a fucose residue on the core GlcNAc of the Fc glycan. This trait has the most pronounced effect on enhancing FcγRIIIa (CD16a) binding [5]. The absence of core fucose allows for a unique carbohydrate-carbohydrate interaction between the glycan of IgG and the N-glycan of FcγRIIIa at position N162. This interaction drastically increases the binding affinity, leading to a ≈50-fold stronger binding and a profound enhancement of ADCC, a key mechanism for eliminating target cells by natural killer (NK) cells [5]. Even a 1% decrease in Fc fucosylation can lead to a more than 25% increase in ADCC activity, highlighting its critical importance in biotherapeutic efficacy for antibodies designed to kill target cells, such as rituximab and trastuzumab [5]. Furthermore, afucosylated antibodies also show enhanced binding to FcγRIIIb on neutrophils, significantly boosting phagocytic activity [5].
Impact of Galactosylation
Galactosylation describes the addition of galactose residues to the terminal GlcNAc on the antennae of the glycan structure. Glycans can be agalactosylated (G0), monogalactosylated (G1), or digalactosylated (G2). This trait plays a more limited role in ADCC compared to fucosylation, but it is a significant modulator of complement-dependent cytotoxicity (CDC) [5]. Fc galactosylation promotes the hexamerization of human IgG1 upon binding to a cell surface, which is a critical step for the efficient recruitment and activation of the C1q complex [5]. Studies have shown that removing galactose residues reduces CDC activity, while its presence enhances it [5]. The effect on ADCC is context-dependent; terminal galactosylation can enhance ADCC in afucosylated mAbs but contributes minimally to fucosylated species [5]. From a clinical perspective, decreases in IgG galactosylation have been significantly associated with an increased long-term risk of ischemic stroke, potentially mediated by the upregulation of chronic inflammatory processes [13].
Impact of Sialylation
Sialylation involves the terminal addition of sialic acid (N-acetylneuraminic acid) to the galactose residues. This is the only charged sugar species in the glycan and was proposed to have significant effects on the Fc domain's structure [5]. However, the functional impact of sialylation remains the most controversial and least consistent among the key glycan traits. Some studies suggest that sialylation closes the binding site for activating FcγRs, thereby negatively affecting ADCC, while others report no significant impact on ADCC or FcγRIIIa binding [5]. Similarly, findings regarding its effect on C1q binding and CDC are contradictory, with some studies indicating an increase and others showing no effect [5]. These inconsistencies highlight the need for further research to fully elucidate the role of IgG Fc sialylation.
The Scientist's Toolkit: Essential Research Reagents and Materials
Table 2: Essential Reagents and Materials for HILIC-UPLC based IgG N-Glycan Analysis
| Item | Function / Application | Example / Specification |
|---|---|---|
| Protein G Plate | Affinity purification of IgG from complex biological samples like serum. | Protein G monolithic plate [13] |
| PNGase F Enzyme | Enzymatic release of N-linked glycans from the IgG protein backbone. | Recombinant PNGase F [13] |
| Fluorescent Label | Derivatization of released glycans for sensitive fluorescence detection. | 2-aminobenzamide (2-AB) [13]; RapiFluor-MS (RFMS) for MS-coupled workflows [14] |
| HILIC-UPLC Column | High-resolution separation of fluorescently labelled glycans based on hydrophilicity. | Waters BEH Glycan Column (100 x 2.1 mm, 1.7 µm) [7] |
| Mobile Phase A | Aqueous buffer for HILIC separation. | 100 mM Ammonium Formate, pH 4.4 [7] |
| Mobile Phase B | Organic solvent for HILIC separation. | Acetonitrile (ACN) [7] |
| FcγR Binding Assay Kits | In vitro assessment of glycan-impacted binding to Fc gamma receptors. | ELISA, Surface Plasmon Resonance (SPR), or Bio-Layer Interferometry (BLI) based kits [5] |
| ADCC Reporter Bioassay | Cell-based functional assay to measure antibody-dependent cellular cytotoxicity. | Engineered cell lines with FcγRIIIa and NFAT-response element driving luciferase expression [5] |
| C1q Binding Assay | In vitro assessment of complement component C1q binding. | ELISA-based or BLI-based formats [5] |
N-Glycan Heterogeneity as a Critical Quality Attribute for Therapeutic Antibodies
N-Glycan Heterogeneity as a Critical Quality Attribute for Therapeutic Antibodies represents a fundamental challenge and consideration in biopharmaceutical development. The glycosylation profile of monoclonal antibodies (mAbs) is now unequivocally recognized as a Critical Quality Attribute (CQA) with direct implications for drug safety, efficacy, and stability [16] [17]. This heterogeneity stems from the complex biosynthetic pathway of N-glycosylation, which occurs at the conserved asparagine 297 (Asn297) residue in the Fc region of IgG antibodies [18] [16].
The core pentasaccharide structure (Man3GlcNAc2) can be extended with various monosaccharides including fucose, galactose, N-acetylglucosamine, and sialic acid, creating a diverse repertoire of glycoforms [16]. This heterogeneity is not merely structural; it profoundly modulates critical effector functions such as Antibody-Dependent Cell-mediated Cytotoxicity (ADCC), Complement-Dependent Cytotoxicity (CDC), and pharmacokinetic profile [18] [19] [16]. Consequently, regulatory authorities mandate thorough characterization and control of N-glycosylation profiles throughout therapeutic antibody development and manufacturing [20] [16].
Impact of Specific N-Glycan Features on Antibody Function
Functional Consequences of Glycan Modifications
The structural heterogeneity of N-glycans translates directly into functional consequences that determine therapeutic efficacy. Table 1 summarizes the key structure-function relationships that establish glycosylation as a CQA.
Table 1: Functional Impact of Specific N-Glycan Features on Therapeutic Antibodies
| Glycan Feature | Structural Element | Functional Impact | Therapeutic Significance |
|---|---|---|---|
| Core Fucosylation | α-1,6 fucose attached to core GlcNAc | Decreases ADCC by reducing binding affinity to FcγRIIIa on immune cells [18] [19] | Afucosylated variants show enhanced effector function; engineered antibodies with low fucose are approved for enhanced potency [18] |
| Galactosylation | Terminal galactose on antennae | Modulates CDC and inflammatory potential; required for C1q binding [18] [19] | Agalactosylated forms have increased inflammatory potential; levels change with age and disease state [19] |
| Sialylation | Terminal sialic acid residues | Enhances anti-inflammatory activity; may reduce affinity for activating FcγRs [19] | Contributes to the anti-inflammatory activity of IVIg; potential impact on serum half-life [19] [21] |
| Bisecting GlcNAc | GlcNAc residue linked to core mannose | Increases ADCC by enhancing binding to activating Fcγ receptors [19] | Glyco-engineered antibodies with bisecting GlcNAc show enhanced effector functions [19] |
| High Mannose | Unprocessed mannose residues on core | Alters serum half-life through increased clearance via mannose receptor [16] | Can negatively impact pharmacokinetics; typically minimized in therapeutic products [16] |
Regulatory and Manufacturing Significance
The functional significance outlined in Table 1 underpins the regulatory requirement for rigorous glycan analysis. As Higel et al. note, "glycosylation is one of the PTMs with important functional implications in mAb therapeutics" [16]. Even minor changes in bioreactor conditions—including pH, temperature, dissolved oxygen, and cell culture media—can significantly alter the glycan profile of the final product, potentially impacting clinical performance [20]. This sensitivity necessitates robust analytical methods capable of monitoring glycosylation throughout development and manufacturing to ensure batch-to-batch consistency, particularly for biosimilar development where matching the innovator's glycan profile is essential for demonstration of comparability [17].
HILIC-UPLC Protocol for IgG N-Glycan Analysis
Sample Preparation and Derivatization
The following protocol, adapted from multiple sources, details a robust method for profiling N-glycans released from therapeutic antibodies using HILIC-UPLC with fluorescence detection [7] [2].
- IgG Purification: Capture IgG from the sample matrix using Protein G Agarose Fast Flow beads. Incubate sample with beads for 2 hours with continuous shaking (800 rpm). Wash beads with PBS and deionized water to remove contaminants [2].
- N-Glycan Release: Denature purified IgG with SDS and heat (65°C). Release N-glycans enzymatically using PNGase F incubation (18 hours at 37°C) [17].
- Fluorescent Labeling: Label released glycans with procainamide hydrochloride (ProA) or 2-aminobenzamide (2-AB) via reductive amination. For ProA labeling: incubate with procainamide mixture (65°C for 1 hour) followed by reducing agent (2-picoline borane, 65°C for 1.5 hours) [2].
- Cleanup: Purify labeled glycans using HILIC-based solid-phase extraction (e.g., µElution plates). Remove excess dye through washing steps before eluting purified glycans for analysis [2] [17].
HILIC-UPLC Chromatographic Conditions
- Column: Waters UPLC BEH Glycan, 100 × 2.1 mm i.d., 1.7 µm BEH particles [7] [20]
- Mobile Phase: Solvent A: 100 mM ammonium formate, pH 4.4; Solvent B: Acetonitrile (ACN) [7]
- Gradient: Linear gradient from 75% to 62% solvent B over 25 minutes at 0.4 mL/min flow rate [7]
- Temperature: Column temperature maintained at 60°C [7]
- Detection: Fluorescence detection with excitation at 330 nm and emission at 420 nm [7]
- System Suitability: Analyze system suitability standards and positive controls to verify performance before client samples [22]
Data Analysis and Interpretation
- Peak Integration: Manually integrate chromatograms into distinct peaks (e.g., 24 peaks for IgG) using chromatography software (e.g., Empower 3) [7] [19]
- Relative Quantitation: Calculate relative abundances of glycan peaks using total area normalization method [7]
- Structural Assignment: Convert retention times to Glucose Units (GU) and compare with reference databases (e.g., GlycoBase) for preliminary structural identification [20] [22]. Confirm identities through exoglycosidase sequencing or mass spectrometry [20]
Diagram 1: Comprehensive workflow for HILIC-UPLC analysis of therapeutic antibody N-glycans, covering sample preparation, chromatographic separation, and data interpretation stages.
Quantitative N-Glycan Profiling in Therapeutic Antibodies
Population Variability and Analytical Considerations
The analytical protocol described above enables quantification of glycan heterogeneity across different therapeutic products. Table 2 presents quantitative data from published studies illustrating the variability in N-glycan features across different antibody types and populations, highlighting the importance of robust analytical methods.
Table 2: Quantitative Ranges of Key IgG N-Glycan Traits in Different Contexts
| Glycan Trait | Typical Range in Human IgG | Therapeutic mAb Range | Factors Influencing Variability |
|---|---|---|---|
| Agalactosylation (G0) | 20-36% of total glycans [19] | Varies by manufacturing process | Increases with age [19]; higher in developing countries [19]; affects CDC [18] |
| Monogalactosylation (G1) | Variable, sex-specific changes with age [19] | Controlled through cell engineering | Shows population-specific patterns [19] |
| Digalactosylation (G2) | Decreases with chronological age [19] | Targeted for optimal effector function | Correlates with country development level [19]; affects CDC [18] |
| Core Fucosylation | High levels (>90%) in serum IgG [19] | 80-99% (lower in ADCC-enhanced mAbs) | 1% decrease can enhance ADCC 50-fold [18]; critical for biosimilarity [17] |
| Sialylation | Decreases with age [19] | Typically <10% in therapeutic mAbs | Impacts anti-inflammatory activity [19]; sensitive to culture conditions [20] |
| Bisecting GlcNAc | Increases with age [19] | Enhanced in glyco-engineered mAbs | Increases ADCC [19]; manufacturing CQA [17] |
Advanced Analytical Approaches
While the standard HILIC-UPLC-FLR method provides robust quantification, advanced approaches offer additional capabilities:
- Middle-up HILIC-MS: Combining IdeS or IgdE enzymatic digestion with HILIC-MS analysis enables quantitative profiling at the subunit level, providing site-specific information while maintaining throughput [23] [17]. This approach has demonstrated accurate quantitation comparable to traditional released glycan methods while offering additional structural information [17].
- Multi-attribute Monitoring: HILIC-MS at the subunit level can be implemented as part of a MAM workflow to simultaneously monitor multiple CQAs including glycan distribution, oxidation, and other post-translational modifications [17].
Signaling Pathways Linking Glycan Heterogeneity to Effector Functions
The mechanistic connection between specific glycan features and antibody function is mediated through defined receptor interactions. Diagram 2 illustrates the key signaling pathways through which N-glycan structures modulate therapeutic antibody effector functions.
Diagram 2: Signaling pathways linking specific N-glycan structural features to immune receptor binding and subsequent effector functions of therapeutic antibodies.
Essential Research Reagent Solutions
Successful implementation of N-glycan analysis requires specific reagents and tools. Table 3 catalogues key research reagent solutions essential for conducting HILIC-UPLC based glycan profiling of therapeutic antibodies.
Table 3: Essential Research Reagents for N-Glycan Analysis of Therapeutic Antibodies
| Reagent Category | Specific Examples | Function & Application |
|---|---|---|
| Chromatography Systems | Waters Acquity UPLC H-class with FLD [7] | High-resolution separation of fluorescently labeled glycans with sensitive detection |
| HILIC Columns | Waters BEH Glycan, 100 × 2.1 mm, 1.7 µm [7] [20] | Specialized stationary phase for glycan separation based on hydrophilicity |
| Release Enzymes | PNGase F [22] [17] | Enzymatic release of N-glycans from glycoprotein backbone |
| Proteases for Middle-up | IdeS (FabRICATOR), IgdE (FabALACTICA), Kgp (GingiKhan) [23] | Specific cleavage of antibodies for subunit analysis with retained glycan information |
| Fluorescent Labels | 2-AB (2-aminobenzamide), ProA (procainamide), RapiFluor-MS [2] [17] | Derivatization for fluorescence detection and improved MS sensitivity |
| Glycan Databases | GlycoBase [20] | Reference database of GU values for ~600 N-glycan structures |
| Software Platforms | Empower 3 [7] | Chromatography data system for peak integration and quantification |
The comprehensive analysis of N-glycan heterogeneity through HILIC-UPLC represents an essential component of therapeutic antibody development and quality control. As demonstrated, specific glycan features including core fucosylation, galactosylation, and sialylation directly modulate critical effector functions through defined biological pathways. The standardized protocols and analytical frameworks presented herein provide researchers with robust methodologies for quantifying this molecular heterogeneity, enabling the development of safer and more effective biotherapeutic products. As the field advances toward increasingly sophisticated glyco-engineering and biosimilar development, the precise characterization and control of N-glycosylation will remain indispensable for meeting both scientific and regulatory standards in biopharmaceutical development.
A Step-by-Step HILIC-UPLC Protocol for High-Throughput IgG N-Glycan Profiling
High-Throughput IgG Isolation from Plasma, Serum, and Saliva Using Protein G
Immunoglobulin G (IgG) is the most abundant antibody in human serum and plays a central role in adaptive immunity. All IgG molecules carry N-glycans at the conserved asparagine 297 residue in their Fc region, which profoundly modulates their biological activity [24]. Changes in IgG N-glycosylation patterns have been associated with various diseases, including autoimmune disorders, cancers, and infectious diseases, and significantly affect the efficacy of therapeutic antibodies [24] [13]. The emerging field of IgG glycomics requires robust, high-throughput methods for IgG isolation and subsequent glycan analysis to enable large-scale population studies and biomarker discovery.
This application note provides detailed protocols for high-throughput IgG isolation from plasma, serum, and saliva using Protein G monolithic plates, framed within the context of a broader research thesis on HILIC-UPLC protocols for IgG N-glycan analysis. The methods described here facilitate rapid processing of hundreds to thousands of samples, enabling comprehensive studies of IgG glycosylation variability and its relationship to health and disease states.
Materials and Reagents
Research Reagent Solutions
The following table details essential materials and reagents required for high-throughput IgG isolation and glycosylation analysis:
Table 1: Essential Research Reagents for High-Throughput IgG Isolation and Glycan Analysis
| Item | Function/Application | Examples/Specifications |
|---|---|---|
| Protein G Monolithic Plate | High-throughput IgG affinity purification from multiple biological fluids | 96-well polymethacrylate plates with covalently coupled Protein G [24] |
| Binding Buffer | Optimal conditions for IgG binding to Protein G | 0.02 M sodium phosphate, pH 7.0 or 1× phosphate-buffered saline (PBS), pH 7.4 [25] [26] |
| Elution Buffer | Release of captured IgG from Protein G | 0.1 M glycine-HCl, pH 2.7 or 0.1 M formic acid [25] [26] |
| Neutralization Buffer | Stabilization of eluted IgG | 1 M Tris-HCl, pH 9.0 or 1 M ammonium bicarbonate [25] [26] |
| PNGase F Enzyme | Release of N-linked glycans from purified IgG | Peptide-N-glycosidase F for enzymatic glycan release [24] [26] |
| Fluorescent Label (2-AB) | Tagging released glycans for detection | 2-aminobenzamide for fluorescence-based detection in HILIC-UPLC [24] [7] [26] |
| HILIC-UPLC System | High-resolution separation and analysis of labeled glycans | Waters Acquity UPLC H-class with BEH Glycan column (100 × 2.1 mm, 1.7 µm) [7] |
Equipment
- Centrifuge capable of handling 96-well plates
- 96-well plate shaker or mixer
- Vacuum manifold or positive pressure system for plate processing
- Ultra-performance liquid chromatography system with fluorescence detector (HILIC-UPLC)
- Analytical balance and pH meter
- Micropipettes and multichannel pipettes
- -70°C or -80°C freezer for sample storage
Experimental Protocols
High-Throughput IgG Isolation Using Protein G Monolithic Plates
The following protocol describes IgG isolation from plasma, serum, or saliva using 96-well Protein G monolithic plates, adapted from large-scale population studies [24] [26].
Sample Preparation
- Plasma/Serum: Dilute samples 10-fold with binding buffer (1× PBS, pH 7.4) [26]. For 50 µL of plasma, add 450 µL of binding buffer.
- Saliva: Centrifuge saliva samples at 10,000 × g for 10 minutes to remove debris and mucins. Dilute clarified supernatant 5-fold with binding buffer.
- Clarification: Centrifuge all diluted samples at 10,000 × g for 10 minutes or filter through 0.45 µm filters to remove particulate matter [25]. Never apply turbid solutions to the monolithic plate.
IgG Isolation Procedure
- Plate Preparation: Remove snap-off ends from the monolithic plate outlets. Wash each well with 3–5 column volumes of distilled water to remove storage solution [25].
- Equilibration: Equilibrate the monolithic plate with at least 5 column volumes of binding buffer [25].
- Sample Application: Apply the pretreated samples to the monolithic plate wells. For optimal results, use a flow rate of 0.2–1 mL/min during sample application [25].
- Washing: Wash each well with 5–10 column volumes of binding buffer to remove unbound proteins and contaminants [25].
- Elution: Elute bound IgG with 1 mL of 0.1 M formic acid per well [26]. Alternatively, 0.1 M glycine-HCl, pH 2.7 can be used [25].
- Neutralization: Immediately neutralize eluted IgG fractions by adding 1 M ammonium bicarbonate [26] or collecting directly into tubes containing 60–200 µL of 1 M Tris-HCl, pH 9.0 per milliliter of fraction [25].
Regeneration and Storage
- Regeneration: After elution, wash the monolithic plate with 3–5 column volumes of binding buffer. The plate is now ready for reuse with the same antibody type [25].
- Storage: For long-term storage, wash the plate with 5 column volumes of 20% ethanol and store at 2–8°C to prevent microbial growth [25].
IgG N-glycan Release and Labeling
This protocol describes the release and fluorescent labeling of N-glycans from purified IgG, adapted from established glycomics methods [24] [26].
- Glycan Release: Add PNGase F enzyme to purified IgG samples and incubate at 37°C for 18 hours to release N-glycans [26].
- Labeling Reaction: Prepare a labeling mixture containing 2-aminobenzamide (2-AB), dimethylsulfoxide, glacial acetic acid, and 2-picoline borane [26]. Add this mixture to the released glycans and incubate at 65°C for 2 hours.
- Cleanup: Purify labeled glycans using hydrophilic interaction chromatography solid-phase extraction or other appropriate cleanup methods to remove excess dye and salts.
- Storage: Store labeled glycans at -20°C until HILIC-UPLC analysis.
HILIC-UPLC Analysis of IgG N-glycans
The following protocol describes the separation and analysis of fluorescently labeled IgG N-glycans using HILIC-UPLC [7].
- Column Equilibration: Equilibrate a Waters BEH Glycan column (100 × 2.1 mm, 1.7 µm) with 75% solvent B (acetonitrile) and 25% solvent A (100 mM ammonium formate, pH 4.4) at a flow rate of 0.4 mL/min [7].
- Sample Injection: Dissolve labeled glycans in 100 µL of 75% acetonitrile and inject 10–20 µL onto the column.
- Chromatographic Separation: Employ a linear gradient from 75% to 62% solvent B over 25 minutes at a flow rate of 0.4 mL/min. Maintain the column temperature at 60°C [7].
- Detection: Set fluorescence detector wavelengths to 330 nm for excitation and 420 nm for emission [7].
- Data Analysis: Process chromatograms using appropriate software (e.g., Empower 3). Manually integrate chromatograms into 24 peaks (GP1-GP24) and express the amount of glycans in each peak as a percentage of the total integrated area [13] [26].
Integration with HILIC-UPLC Glycan Analysis
Workflow Integration
The high-throughput IgG isolation method described herein is specifically designed to interface seamlessly with HILIC-UPLC-based glycan analysis protocols. The Protein G monolithic plate approach enables rapid processing of large sample sets (2000+ samples) required for comprehensive glycomics studies [24]. This integrated workflow supports the investigation of population-level variability in IgG glycosylation and its implications for disease risk and therapeutic monitoring.
The following diagram illustrates the complete integrated workflow from sample collection to data analysis:
Data Analysis and Glycan Traits
After HILIC-UPLC analysis, chromatograms are typically separated into 24 glycan peaks (GP1-GP24), with the relative abundance of each peak expressed as a percentage of the total integrated area [13] [26]. From these directly measured peaks, 54 derived glycan traits can be calculated, focusing on four major structural features with significant biological relevance:
Table 2: Key IgG N-glycan Structural Features and Their Biological Significance
| Structural Feature | Biological Significance | Association with Disease |
|---|---|---|
| Core Fucosylation | Modulates ADCC; lack of fucose enhances FcγRIIIa binding [24] | Decreased fucosylation associated with increased IS risk [13] |
| Galactosylation | Affects complement activation and inflammatory response [24] | Decreased galactosylation in rheumatoid arthritis; associated with IS risk [24] [13] |
| Sialylation | Converts IgG from pro-inflammatory to anti-inflammatory [24] | Higher than previously reported; nearly 80% in specific glycan types [24] |
| Bisecting GlcNAc | May affect antibody-dependent cellular cytotoxicity | Increases with age; associated with autoimmune conditions [24] |
Key Research Findings
Population Variability and Heritability
Large-scale studies utilizing this integrated approach have revealed substantial individual variability in IgG glycosylation, approximately three times higher than in the total plasma glycome [24]. For example, neutral IgG glycans without core fucose vary between 1.3% and 19% across populations, a difference that significantly affects antibody effector functions [24]. Heritability analysis of IgG glycans indicates that 30–50% of the variability has genetic origins [24] [27].
Clinical Applications and Predictive Value
Recent nested case-control studies with nine years of follow-up have demonstrated that specific IgG N-glycosylation patterns can predict disease risk. Decreases in fucosylation and galactosylation of IgG are significantly associated with the development of ischemic stroke (IS) [13]. Glycosylation-based prediction models show promising capability for predicting IS risk with an area under the curve (AUC) of 0.756 [13].
Age-Related Changes
The individual's age is associated with a significant decrease in galactose and an increase of bisecting GlcNAc, whereas other functional elements of IgG glycosylation do not change substantially with age [24]. Gender has not been identified as an important predictor for any IgG glycan trait [24].
Troubleshooting and Technical Notes
- Low IgG Yield: Ensure proper sample preparation and clarification. Verify pH of binding buffer (optimal pH 7.0–7.4) and avoid excessive washing which might decrease yield for antibodies with weak Protein G interactions [25].
- Poor Glycan Recovery: Check PNGase F activity and ensure complete denaturation of IgG before enzymatic digestion. Include positive controls.
- Chromatographic Issues: Freshly prepare ammonium formate buffer for HILIC-UPLC and ensure proper column equilibration. Check for column contamination if peak shape deteriorates.
- High Background: Increase wash volumes and verify binding buffer composition. Consider additional wash steps with moderate salt concentrations (e.g., 0.1–0.15 M NaCl).
- Plate Storage: Always store monolithic plates in 20% ethanol at 2–8°C when not in use to maintain performance and prevent microbial growth [25].
The integrated methodology described in this application note—combining high-throughput IgG isolation using Protein G monolithic plates with HILIC-UPLC glycan analysis—provides a robust platform for large-scale glycosylation studies. This approach enables researchers to process thousands of samples efficiently while generating comprehensive glycosylation profiles with biological and clinical relevance. The ability to identify glycosylation signatures associated with disease states offers promising opportunities for biomarker discovery and personalized medicine approaches.
Optimized Denaturation and Enzymatic Release of N-Glycans with PNGase F
Within the framework of research employing HILIC-UPLC protocols for IgG N-glycan analysis, the optimized release of N-glycans is a critical first step. This process is fundamental for subsequent chromatographic profiling that investigates glycosylation's role in health and disease. The enzyme Peptide-N-Glycosidase F (PNGase F) is the most effective tool for this purpose, cleaving nearly all N-linked oligosaccharides from glycoproteins between the innermost GlcNAc and asparagine residues [28]. The efficiency of this enzymatic release is highly dependent on the initial denaturation of the glycoprotein substrate, which makes the glycan accessible to the enzyme [29]. This application note provides detailed, optimized protocols for the denaturation and enzymatic release of N-glycans, specifically tailored for integration with HILIC-UPLC analysis of IgG, a key biomarker in inflammatory and ageing research [13] [30].
Denaturation and Enzymatic Release Protocols
Denaturing Conditions for Optimal PNGase F Activity
For glycoproteins with complex structures or tightly folded domains, denaturing conditions are recommended to ensure complete glycan release. The following protocol is adapted from established methods [29].
Materials:
- Glycoprotein sample (1–20 µg)
- Glycoprotein Denaturing Buffer (10X)
- GlycoBuffer 2 (10X)
- NP-40 (10%)
- PNGase F (e.g., NEB #P0704 or P0708)
- Nuclease-free water
Procedure:
- Combine 1–20 µg of glycoprotein, 1 µL of 10X Glycoprotein Denaturing Buffer, and add nuclease-free water to a final volume of 10 µL.
- Denature the glycoprotein by heating the reaction mixture at 100°C for 10 minutes.
- Immediately chill the denatured glycoprotein on ice and centrifuge briefly (10 seconds) to collect condensation.
- To the denatured sample, add the following to achieve a 20 µL total reaction volume:
- 2 µL of 10X GlycoBuffer 2
- 2 µL of 10% NP-40
- 6 µL of nuclease-free water
- 1 µL of PNGase F enzyme
- Mix the reaction gently and incubate at 37°C for 1 hour.
- The released N-glycans are now ready for purification and labeling prior to HILIC-UPLC analysis.
Key Reagent Functions and Specifications
Table 1: Essential Reagents for N-glycan Release with PNGase F.
| Reagent | Function | Key Specifications |
|---|---|---|
| PNGase F | An amidase that cleaves between the innermost GlcNAc and asparagine residues of high mannose, hybrid, and complex oligosaccharides [28]. | Source: Flavobacterium meningosepticum. Supplied in 50% glycerol. Purity: ≥95% (SDS-PAGE, ESI-MS). Free from proteases and Endo F activities [28]. |
| Glycoprotein Denaturing Buffer | Disrupts non-covalent interactions within the glycoprotein, unfolding its structure to expose the N-linked glycan for enzymatic access. | Typically contains SDS. |
| GlycoBuffer 2 (10X) | Provides the optimal pH and chemical environment (e.g., sodium phosphate) for PNGase F enzymatic activity. | |
| NP-40 (Nonidet P-40) | A non-ionic detergent that neutralizes the denaturing effect of SDS, which can inhibit PNGase F, without compromising the unfolded state of the protein. |
Unit Conversion and Vendor Comparison
When substituting PNGase F from different suppliers, it is crucial to account for differences in unit definition to ensure equivalent enzymatic activity.
Table 2: PNGase F Unit Conversion Chart across Different Suppliers (adapted from [29]).
| Enzyme | Company | Selling Conc. (U/ml) | NEB Assay (U/ml) | µl Conversion (1 NEB µl = x Company µls) |
|---|---|---|---|---|
| PNGase F | New England Biolabs (NEB #P0704) | 500,000 | 500,000 | 1 |
| Prozyme (GKE-5006A) | 2.5 | 150,000 | 3.3 | |
| QA Bio (E-PNG01) | 5 | 200,000 | 2.5 | |
| Sigma (P7367) | 500 | 90,000 | 5.5 |
Integration with HILIC-UPLC Workflow for IgG N-glycan Analysis
The release of N-glycans via the optimized PNGase F protocol is the foundational step in a comprehensive workflow for IgG N-glycome analysis. This workflow has been successfully applied in clinical and biomarker studies to reveal associations between IgG glycosylation and conditions like ischemic stroke and obesity [13] [30].
The following diagram illustrates the complete experimental workflow, from sample preparation to data analysis.
Post-Release Processing for HILIC-UPLC
Following enzymatic release with PNGase F, the glycans must be prepared for HILIC-UPLC analysis:
- Fluorescent Labeling: Released N-glycans are labeled with a fluorophore such as 2-aminobenzamide (2-AB) [13]. This step is critical for sensitive fluorescence detection (FLD) following UPLC separation.
- Purification: Excess labeling reagents are removed from the labeled glycans using solid-phase extraction or other purification methods to ensure a clean chromatogram [31].
- HILIC-UPLC Analysis: The purified, labeled glycans are separated by hydrophilic interaction liquid chromatography (HILIC) on an ultra-performance liquid chromatography (UPLC) system. This technique separates glycans based on their hydrophilicity, effectively resolving isomeric structures [13] [32].
- Data Processing: The resulting chromatograms are segmented into peaks (e.g., GP1 to GP24), each representing a specific glycan or group of glycans. The relative abundance of each peak is calculated, and derived glycan traits (e.g., galactosylation, fucosylation, sialylation, bisecting GlcNAc) are computed from these initial abundances [13].
Research Reagent Solutions
A selection of essential materials for implementing this protocol is provided below.
Table 3: Key Research Reagent Solutions for N-glycan Release and Analysis.
| Item | Function/Benefit | Example Source / Catalog # |
|---|---|---|
| PNGase F (native) | Gold-standard enzyme for comprehensive release of N-linked glycans for analysis. | New England Biolabs (P0704) [28] |
| Protein G Monolithic Plates | High-throughput, robust affinity chromatography for specific IgG isolation from biological fluids. | BIA Separations [13] [30] |
| 2-Aminobenzamide (2-AB) | Fluorescent dye for labeling released glycans, enabling highly sensitive FLD detection in UPLC. | [13] |
| HILIC-UPLC Columns | Stationary phases (e.g., Waters BEH Glycan) designed for high-resolution separation of labeled glycans. | Walters Corporation [13] |
| Glycan Standards (SIL) | Stable isotope-labeled internal standards for absolute quantification of glycans by MS. | CarboQuant [31] |
Concluding Remarks
The meticulous optimization of the denaturation and PNGase F-mediated release of N-glycans is a non-negotiable prerequisite for obtaining high-quality, reproducible data in IgG N-glycan analysis via HILIC-UPLC. The protocols detailed herein, which include specific denaturation conditions and guidance on enzyme unit conversion, provide researchers with a reliable methodology. When integrated with the subsequent steps of fluorescent labeling and HILIC-UPLC, this approach forms a powerful pipeline for discovering glycosylation-based biomarkers in human disease and therapeutic development.
Efficient Fluorescent Labeling of Glycans with 2-Aminobenzamide (2-AB)
Within the framework of advanced glycosylation analysis for biopharmaceutical characterization, the profiling of immunoglobulin G (IgG) N-glycans represents a critical procedure. Glycosylation at the conserved Asn-297 residue of the IgG Fc region is a key determinant of antibody effector functions, influencing stability, immunogenicity, and mechanism of action [2]. The analysis of these structures often employs Hydrophilic Interaction Liquid Chromatography coupled with Ultra Performance Liquid Chromatography (HILIC-UPLC), a technique that provides high-resolution separation of glycans based on their size and hydrophilicity [7]. For sensitive detection, glycans must be derivatized with a fluorescent tag prior to analysis. Among the available tags, 2-Aminobenzamide (2-AB) remains a widely used and reliable label for high-throughput N-glycan analysis [33]. This application note details a robust protocol for the efficient fluorescent labeling of glycans with 2-AB, contextualized within a broader HILIC-UPLC workflow for IgG N-glycan analysis, providing researchers and drug development professionals with a definitive methodological guide.
Performance Comparison of Fluorescent Labels
The choice of fluorescent labeling agent significantly impacts the sensitivity and data quality of HILIC-UPLC glycan profiling. The table below provides a quantitative comparison of 2-AB with two other common labels, Procainamide (ProA) and RapiFluor-MS (RF-MS), based on data obtained from the analysis of IgG glycans [33].
Table 1: Performance comparison of 2-AB, Procainamide, and RapiFluor-MS for N-glycan analysis.
| Parameter | 2-Aminobenzamide (2-AB) | Procainamide (ProA) | RapiFluor-MS (RF-MS) |
|---|---|---|---|
| Relative FLR Sensitivity | 1x (Baseline) | 15x higher than 2-AB | 4x higher than 2-AB |
| Relative MS Sensitivity | 1x (Baseline) | 34x higher than 2-AB | 68x higher than 2-AB |
| Limit of Quantification (LOQ) | Highest (Least Sensitive) | Comparable to RF-MS | Comparable to ProA |
| Labeling Efficiency | Very Good | Very Good | Very Good |
| Repeatability | Good | Good | Good |
| Primary Strengths | Established, reliable method | Highest fluorescence sensitivity | Highest MS sensitivity, speed |
As the data indicates, while 2-AB exhibits lower sensitivity in both fluorescence (FLR) and mass spectrometry (MS) detection compared to ProA and RF-MS, it remains a robust and well-characterized choice for applications where extreme sensitivity is not the primary requirement [33] [34]. All three labels demonstrate excellent repeatability and comparable labeling efficiency, making them all viable for high-throughput analysis.
Detailed Experimental Protocol for 2-AB Labeling of IgG N-Glycans
This protocol outlines the complete workflow for the analysis of IgG N-glycans, from protein isolation to HILIC-UPLC analysis, with a specific focus on the 2-AB labeling procedure.
IgG Purification and Preparation
- IgG Capture: Isolate IgG from your sample matrix. For plasma or serum samples, dilute 30 µL of plasma in 4 mL of phosphate-buffered saline (PBS). For complex matrices like saliva, use bead-based immunoprecipitation (e.g., Protein G Agarose Fast Flow beads) to capture IgG from a larger sample volume (e.g., 5 mL) [2].
- Denaturation: Transfer the purified IgG to a reaction vial and dry completely using a vacuum concentrator. Resuspend the protein pellet in a solution of sodium dodecyl sulfate (SDS) to denature the glycoprotein. A typical protocol involves adding SDS to a final concentration of 1.3% (w/v) and incubating at 65°C for 10 minutes [2] [35].
Enzymatic Release of N-Glycans
- To the denatured IgG sample, add the enzyme Peptide-N-Glycosidase F (PNGase F) to enzymatically cleave N-glycans from the protein backbone [22].
- Incubate the reaction mixture. While incubation at 37°C overnight is standard [35], some protocols employ a two-day incubation to ensure complete release [36].
Fluorescent Labeling with 2-AB
- Preparation of Labeling Solution: The 2-AB labeling solution typically consists of the 2-aminobenzamide dye in a solvent mixture of glacial acetic acid and dimethyl sulfoxide (DMSO) [2].
- Labeling Reaction: Add the prepared 2-AB labeling solution to the tube containing the released N-glycans. Mix thoroughly by pipetting.
- Incubation: Incubate the reaction mixture for 2 hours at 65°C [35]. This step stoichiometrically attaches a single 2-AB fluorescent tag to the reducing terminus of each glycan.
Cleanup of Labeled N-Glycans
- Preparation of HILIC Filter Plate: Use a hydrophilic filter plate, such as an AcroPrep GHP membrane 96-well plate. Condition the plate by sequentially passing 200 µL of 70% ethanol, ultrapure water, and cold 96% acetonitrile (ACN) through it, applying a vacuum after each step [35].
- Sample Loading: After the labeling reaction, add a large volume of cold 100% ACN (e.g., 800 µL) to the sample to create a high-ACN environment favorable for HILIC binding. Transfer this entire mixture to the conditioned filter plate and incubate for 2 minutes to allow the labeled glycans to bind to the hydrophilic membrane. Apply a vacuum to remove the liquid [35].
- Washing: Wash the membrane several times with 200 µL of cold 96% ACN to remove unincorporated dye and other contaminants.
- Elution: Elute the purified 2-AB-labeled glycans by adding 90 µL of ultrapure water to each well. After a 15-minute incubation with gentle shaking, collect the eluate by centrifugation (e.g., 5 minutes at 165 × g). A second elution step is recommended to maximize recovery [35]. The eluate is now ready for HILIC-UPLC analysis.
HILIC-UPLC Analysis
- Chromatography Conditions:
- Column: Waters BEH Glycan, 100 × 2.1 mm i.d., 1.7 µm particles.
- Mobile Phase: Solvent A: 100 mM ammonium formate, pH 4.4; Solvent B: Acetonitrile (ACN).
- Gradient: Linear gradient from 75% to 62% solvent B over 25 minutes.
- Flow Rate: 0.4 mL/min.
- Column Temperature: 60°C [7].
- Detection: Use a fluorescence (FLR) detector with excitation at 330 nm and emission at 420 nm [7].
- Data Analysis: The resulting chromatograms are processed to identify peaks, which are often reported in Glucose Unit (GU) values by comparison to a dextran ladder standard. Relative quantitation is achieved by peak area normalization [22].
The following workflow diagram summarizes the entire experimental procedure:
The Scientist's Toolkit: Essential Research Reagents
The following table lists the key materials and reagents required to perform the 2-AB labeling and HILIC-UPLC analysis of IgG N-glycans.
Table 2: Essential reagents and materials for 2-AB labeling and HILIC-UPLC analysis.
| Item | Function/Application |
|---|---|
| 2-Aminobenzamide (2-AB) | Fluorescent dye that labels the reducing end of glycans for sensitive detection. |
| PNGase F Enzyme | Enzyme that specifically cleaves N-linked glycans from glycoproteins. |
| Protein G Agarose Beads | For affinity purification of IgG from complex biological samples. |
| Hydrophilic Filter Plates | Used for solid-phase extraction (SPE) cleanup of labeled glycans via HILIC principle. |
| HILIC-UPLC Column | Chromatographic column for high-resolution separation of labeled glycans. |
| Ammonium Formate | Salt for preparing mobile phase solvent A, crucial for HILIC separation. |
| Acetonitrile (ACN) | Organic solvent used in mobile phase and sample cleanup. |
The 2-AB labeling protocol detailed herein provides a robust, well-established method for the fluorescence-based profiling of IgG N-glycans via HILIC-UPLC. While newer tags like Procainamide and RapiFluor-MS offer enhanced sensitivity, 2-AB remains a dependable choice for a wide range of applications, including quality control, batch-to-batch consistency monitoring, and comparability studies of biopharmaceuticals [33] [22]. Its proven reliability and the wealth of existing comparative data make it an essential technique in the glycosylation analysis toolkit, providing critical insights into the quality and function of therapeutic antibodies and other glycoprotein biologics.
The analysis of immunoglobulin G (IgG) N-glycosylation is a critical component in biopharmaceutical development and basic biomedical research. As a Critical Quality Attribute (CQA), the N-glycan profile of therapeutic monoclonal antibodies (mAbs) directly influences drug efficacy, safety, and stability, impacting mechanisms such as antibody-dependent cellular cytotoxicity (ADCC) and serum half-life [37]. Hydrophilic Interaction Liquid Chromatography coupled with Ultra Performance Liquid Chromatography (HILIC-UPLC) has emerged as a powerful analytical technique for separating and characterizing released, labeled N-glycans due to its high resolution, reproducibility, and compatibility with fluorescence and mass spectrometric detection.
This application note provides a detailed protocol for HILIC-UPLC separation tailored specifically for IgG N-glycan analysis. The content is framed within a broader research thesis on advancing glycomics protocols for biotherapeutic characterization, addressing the needs of researchers, scientists, and drug development professionals who require robust, reproducible methods for heightened characterization of glycosylation. We detail the critical parameters of column chemistry, mobile phase composition, and gradient optimization, supported by experimental data and workflow visualizations to ensure method robustness and transferability.
Principles of HILIC for N-glycan Separation
Hydrophilic-interaction chromatography (HILIC) separates polar solutes through a complex mechanism involving partitioning of analytes between a water-rich layer immobilized on the surface of a polar stationary phase and a hydrophobic bulk mobile phase, typically rich in acetonitrile [38]. Retention increases with solute polarity, operating in a mode broadly opposite to reversed-phase chromatography. For N-glycans, which are highly polar, HILIC provides superior retention and separation of structural isomers compared to other techniques.
Additional mechanisms, including ionic interactions and adsorption, can be superimposed on the primary partitioning process. The stationary phase chemistry significantly influences selectivity; for instance, bare silica columns exhibit ionic interactions with charged silanols, while amide-based columns with neutral polymer layers can shield these effects, providing different selectivity [38]. The organic solvent concentration is a crucial factor, with retention typically increasing exponentially at high acetonitrile levels (80–95%). The water concentration in the mobile phase acts as the strong solvent, reducing retention as its percentage increases.
Critical Method Parameters
Column Chemistry
The selection of stationary phase chemistry is fundamental to achieving optimal separation. The BEH (bridged ethyl hybrid) Amide column is a widely adopted and robust choice for N-glycan analysis.
- Stationary Phase: BEH Technology with amide-bonded ligands provides high stability at elevated temperatures and across a wide pH range.
- Particle Size: 1.7 µm for UPLC applications, enabling high efficiency and resolution.
- Column Dimensions: 2.1 mm x 150 mm is standard for analytical-scale separations.
- Pore Size: 130 Å, suitable for macromolecular separations.
The amide-functionalized stationary phase offers excellent reproducibility and is the basis for platform methods and validated glucose unit (GU) libraries used in glycan identification [39]. The neutral amide ligand minimizes unwanted ionic interactions with sialylated (acidic) glycans, providing separation primarily based on size, composition, and branching.
Mobile Phase Composition
Mobile phase selection directly impacts retention, selectivity, and detection compatibility. The following components are standard.
- Mobile Phase A: 50–200 mM Ammonium formate in water. The concentration can be optimized to fine-tune separation; higher concentrations can increase the retention of neutral compounds but may suppress MS signal [38] [39].
- Mobile Phase B: High-purity acetonitrile.
Buffer Selection and pH Considerations: Ammonium formate and ammonium acetate are preferred due to their volatility and compatibility with mass spectrometry. The pH of the mobile phase, typically measured in the aqueous component before mixing (ww pH), is a powerful tool for adjusting selectivity. For amide columns, a ww pH of 4.4 is commonly used, providing a balance for separating neutral, acidic, and basic glycan motifs [38]. While trifluoroacetic acid (TFA) has been used as a modifier to improve peak shape and provide orthogonal selectivity for sialylated glycans [40], its ion-pairing properties can suppress ionization in MS detection.
Gradient Elution
A carefully optimized gradient is essential for resolving complex IgG N-glycan mixtures. The following table summarizes a standard and an optimized gradient for high-mannose separation, both using a 2.1 mm x 150 mm, 1.7 µm BEH Amide Column.
Table 1: HILIC-UPLC Gradient Elution Conditions for IgG N-glycan Analysis
| Time (min) | % Mobile Phase A (50 mM Ammonium Formate) | % Mobile Phase B (Acetonitrile) | Flow Rate (mL/min) | Notes |
|---|---|---|---|---|
| Universal N-Glycan Method [39] | 0.4 | Column Temp: 60°C | ||
| 0.0 | 25 | 75 | ||
| 28.0 | 44 | 56 | ||
| 28.5 | 100 | 0 | ||
| 31.5 | 100 | 0 | Wash | |
| 32.0 | 25 | 75 | ||
| 38.0 | 25 | 75 | Re-equilibration | |
| Targeted Man-5 Method [39] | 0.4 | Column Temp: 30°C | ||
| 0.0 | 30 | 70 | ||
| 20.0 | 47 | 53 | ||
| 20.1 | 100 | 0 | ||
| 23.0 | 100 | 0 | Wash | |
| 23.1 | 30 | 70 | ||
| 30.0 | 30 | 70 | Re-equilibration |
The universal method provides a broad separation of the major IgG N-glycans (e.g., G0F, G1F, G2F). However, specific minor glycans, such as Man-5, may co-elute with other species [39]. Applying Analytical Quality by Design (AQbD) principles, including Design of Experiments (DoE), allows for the systematic optimization of Critical Method Parameters (CMPs) like buffer concentration, column temperature, and gradient slope to create a targeted assay. As shown in Table 1, lowering the column temperature to 30°C and adjusting the initial and final %B can successfully resolve Man-5 from co-eluting glycans like FA1G1 and A2G1 [39].
Experimental Protocol for HILIC-UPLC Analysis of IgG N-glycans
Sample Preparation Workflow
The following diagram illustrates the end-to-end workflow for sample preparation and analysis of IgG N-glycans.
Figure 1: IgG N-glycan Analysis Workflow. This diagram outlines the key steps from glycan release to data analysis.
N-Glycan Release
- Desalt: Transfer 40 µg of purified IgG into a 0.5 mL microcentrifuge tube. If in a formulation buffer, use a centrifugal filter unit (10kDa MWCO) to buffer-exchange into 100 mM ammonium bicarbonate, pH 7.5. Concentrate to ~50 µL.
- Denaturation: Add 1.5 µL of 5% SDS and 1.5 µL of 1M DTT. Incubate at 60°C for 10 minutes.
- Enzymatic Release: Add 10% Igepal CA-630 (4 µL) and 2 µL of PNGase F (500 U/mL). Mix gently and incubate at 50°C for 1 hour.
Fluorescent Labeling and Purification
This protocol uses the common 2-aminobenzamide (2-AB) label. Commercial kits like the Agilent AdvanceBio Gly-X or Waters RapiFluor-MS offer rapid, optimized protocols.
- Labeling: To the released glycan sample, add 25 µL of 2-AB labeling solution and 25 µL of sodium cyanoborohydride solution.
- Incubate: Mix and incubate at 65°C for 2 hours.
- Purify: Purify the labeled glycans using HILIC solid-phase extraction (SPE). Commercial kits provide pre-packed microplates or columns. The general steps are:
- Condition the SPE medium with acetonitrile and water.
- Load the labeling mixture diluted with a high percentage of acetonitrile (>85%).
- Wash with 95% acetonitrile to remove unincorporated dye and contaminants.
- Elute glycans with 50-100 µL of HPLC-grade water.
- Store: The purified 2-AB labeled glycans can be stored at -20°C until analysis.
Instrumental Setup and Data Acquisition
- LC System: ACQUITY UPLC H-Class or equivalent.
- Detection: Fluorescence Detector (λex=265 nm / λem=425 nm for RapiFluor-MS; λex=330 nm / λem=420 nm for 2-AB).
- Column: ACQUITY UPLC BEH Amide, 1.7 µm, 2.1 x 150 mm (or equivalent).
- Column Temperature: 60°C (Universal Method) or optimized temperature (e.g., 30°C for Man-5).
- Sample Temperature: 10°C.
- Injection Volume: 1–5 µL.
- Mobile Phases: As described in Section 3.2.
- Gradient: Apply the chosen gradient from Table 1.
- Data Analysis: Identify glycans by comparing retention times to a 2-AB labeled dextran ladder to calculate Glucose Unit (GU) values. Compare experimental GU values to reference libraries (e.g., GlycoBase) for structural assignment.
The Scientist's Toolkit
Table 2: Essential Research Reagent Solutions for HILIC-UPLC N-glycan Analysis
| Item | Function | Example Product/Catalog Number |
|---|---|---|
| BEH Amide UPLC Column | High-resolution separation of labeled N-glycans based on hydrophilicity. | ACQUITY UPLC BEH Amide, 1.7 µm, 2.1 x 150 mm [39] |
| Ammonium Formate Solution | Volatile buffer salt for mobile phase; ensures consistent retention and MS compatibility. | Waters Ammonium Formate Solution–Glycan Analysis [39] |
| Fluorescent Labeling Kit | Streamlined kit for rapid glycan release, fluorescent labeling, and cleanup. | Agilent AdvanceBio Gly-X N-Glycan Prep Kit [37] / Waters RapiFluor-MS [39] |
| Glycan Performance Standard | System suitability test standard to verify chromatographic performance and GU calibration. | RapiFluor-MS Glycan Performance Test Standard [41] |
| Dextran Ladder Standard | Hydrolyzed dextran for creating a GU calibration curve for glycan identification. | 2-AB Labeled Dextran Ladder |
Troubleshooting and Method Optimization
- Peak Tailing: Can result from insufficient buffer ionic strength, especially for charged glycans. Consider increasing ammonium formate concentration to 100-200 mM, or using TFA (with MS signal suppression awareness) [38] [40].
- Inadequate Resolution: Adjust the gradient slope. A shallower slope between 0.14–0.72% B/min can improve resolution of critical pairs [39]. Lowering column temperature can also enhance resolution for specific glycans like Man-5.
- Poor Recovery of Acidic Glycans: Use columns and hardware with High Performance Surface (HPS) Technology or equivalent to minimize metal-ion binding and absorption, which is crucial for sialylated glycans [41].
- Retention Time Drift: Ensure mobile phases are prepared fresh every 1-3 days to prevent bacterial growth or evaporation-induced concentration changes, particularly in the aqueous mobile phase A [41].
Fluorescence Detection Parameters and Peak Assignment Using Glucose Unit (GU) Values
This application note provides a detailed protocol for the analysis of N-linked glycans from IgG antibodies using Hydrophilic Interaction Liquid Chromatography-Ultra Performance Liquid Chromatography (HILIC-UPLC) with fluorescence detection. The document outlines standardized methodologies for peak assignment using Glucose Unit (GU) values and offers comprehensive guidance on fluorescence parameter optimization to ensure reproducible, high-sensitivity glycan profiling. Designed to support biopharmaceutical development and quality control, this protocol enables researchers to monitor glycosylation microheterogeneity—a critical quality attribute affecting drug safety and efficacy.
Glycosylation significantly influences the safety, efficacy, and stability of therapeutic monoclonal antibodies (mAbs) [42]. Even minor variations in glycosylation patterns can impact biological activity, making rigorous monitoring essential throughout biomanufacturing [42]. The HILIC-UPLC platform has become a gold standard for released N-glycan analysis due to its superior resolution, speed, and sensitivity compared to traditional HPLC methods.
This document details a robust framework for IgG N-glycan analysis, specifically addressing two fundamental components: optimizing fluorescence detection for maximum sensitivity and implementing GU values for reliable peak identification. GU values, derived from a dextran ladder standard, create a normalized retention time framework that enables consistent glycan identification across laboratories and instrumentation platforms.
Materials and Methods
Research Reagent Solutions
The following table lists essential materials and reagents required for the HILIC-UPLC glycan analysis workflow.
Table 1: Essential Research Reagents and Materials for HILIC-UPLC Glycan Analysis
| Item Name | Function/Application | Specifics/Alternatives |
|---|---|---|
| Rapid PNGase F | Enzyme for releasing N-glycans from glycoproteins. | Ensures complete release of glycans for accurate profiling. |
| 2-Aminobenzamide (2-AB) | Fluorescent label for glycan detection. | Common label for HILIC; provides chromophore for fluorescence detection [43]. |
| 2-Anthranilic Acid (2-AA) | Fluorescent label for glycan detection. | Used in RPC methods; offers an alternative labeling chemistry [43]. |
| Dextran Ladder Standard | Hydrolyzed glucose polymer used to create a GU calibration curve. | Critical for assigning GU values to unknown glycan peaks. |
| Acetonitrile (HILIC-grade) | Organic solvent for mobile phase and sample preparation. | Essential for HILIC chromatography. |
| Strata SI-1 SPE Plates | Solid-phase extraction for purifying labeled glycans. | Removes excess dye and reaction by-products [43]. |
Experimental Workflow for IgG N-Glycan Profiling
The following diagram illustrates the comprehensive workflow for N-glycan analysis, from sample preparation to data interpretation.
Diagram 1: HILIC-UPLC N-Glycan Analysis Workflow.
Detailed Protocol: N-Glycan Release, Labeling, and Purification
2.3.1. Denaturation and Enzymatic Release
- Prepare 50–150 µg of IgG sample in a 96-well plate. For low-concentration samples (< 5 mg/mL), use filter plates for concentration.
- Denature the glycoprotein by heating at 95°C for 5 minutes [43].
- Cool the sample to room temperature and add PBS buffer containing Rapid PNGase F (1.5 µL enzyme per 10 µL sample) [43].
- Incubate at 50°C for 30 minutes to release N-glycans [43].
2.3.2. Fluorescent Labeling via Reductive Amination
- To the released N-glycans, add 40 µL of labeling solution (e.g., 0.73 M 2-AB and 0.75 M 2-methylpyridine borane complex in an 85:15 ethanol:acetic acid mixture) without prior purification [43].
- Incubate the reaction at 65°C for 2 hours [43].
- After labeling, evaporate the reaction mixture to dryness using a vacuum concentrator.
2.3.3. Purification of Labeled N-Glycans
- Reconstitute the dried sample in 40 µL of ultrapure water.
- Dilute 35 µL of this solution with 400 µL of acetonitrile.
- Condition a 96-well Strata SI-1 SPE plate with water and acetonitrile.
- Load the diluted sample onto the SPE plate and pass it through by centrifugation.
- Wash the plate three times with 1 mL of 96% (v/v) acetonitrile containing 2% (v/v) formic acid to remove excess label.
- Elute the purified, labeled N-glycans with 2 x 150 µL of ultrapure water [43].
HILIC-UPLC Analysis and Fluorescence Detection
2.4.1. Instrument Parameters
- Chromatographic System: UHPLC system (e.g., Agilent 1290 Infinity II) optimized for ultra-low dispersion [43].
- Column: BEH Amide, 1.7 µm, 150 x 2.1 mm (or equivalent) [43].
- Mobile Phase: A: 50 mM ammonium formate, pH 4.5; B: Acetonitrile.
- Gradient: Use a linear gradient optimized for IgG glycan separation (e.g., starting at 75% B and decreasing to 50% B over a defined runtime).
- Flow Rate: 0.250 - 0.400 mL/min.
- Column Temperature: 40 - 60°C.
2.4.2. Fluorescence Detection Parameters The choice of fluorescent tag dictates the optimal detection parameters. The following table summarizes the settings for common tags.
Table 2: Fluorescence Detection Parameters for Common Glycan Labels
| Fluorophore | Excitation Wavelength (λex, nm) | Emission Wavelength (λem, nm) | Key Characteristics |
|---|---|---|---|
| 2-Aminobenzamide (2-AB) | 250 | 425 | Standard label for HILIC; requires compatible mobile phases [43]. |
| 2-Anthranilic Acid (2-AA) | 350 | 440 | Used in RPC methods; different spectral properties [43]. |
| Imidazolium Tags (e.g., 4'GITag) | Appropriate wavelength to be confirmed from vendor specifications | Newer tags offering improved ionization efficiency and sensitivity for MS [15]. |
Data Analysis: Peak Assignment with Glucose Unit (GU) Values
Generating the GU Calibration Curve
- Run Dextran Ladder: Separately inject a hydrolyzed dextran ladder standard using the same HILIC-UPLC method as the samples.
- Plot Log(GU) vs. Retention Time: The dextran ladder consists of glucose polymers assigned GU values (e.g., GU1 for glucose, GU2 for maltose, etc.). Plot the logarithm of the GU value of each polymer against its retention time.
- Establish Calibration Curve: Fit the data points using a linear or polynomial regression to create the calibration curve.
Calculating GU Values for Sample Peaks
For each glycan peak in the sample chromatogram, use the calibration curve to convert its measured retention time into a GU value.
Peak Identification and Validation
- Compare the calculated GU values of sample peaks against a reference database of known glycan structures and their GU values.
- Confirm tentative identifications based on GU values using orthogonal techniques, such as mass spectrometry (MS) or exoglycosidase digestion [42]. The improved resolving power of UHPLC allows for the identification of even minor glycan components, providing a more comprehensive characterization of the product's micro-heterogeneity [42].
The relationship between data generation and interpretation in the peak assignment process is summarized below.
Diagram 2: Peak Assignment Workflow using GU Values.
Concluding Remarks
This application note establishes a robust HILIC-UPLC protocol for the fluorescence-based analysis of IgG N-glycans. By standardizing the fluorescence detection parameters and implementing a rigorous GU-based peak assignment strategy, laboratories can achieve high levels of reproducibility, sensitivity, and confidence in glycan identification. This methodology provides a powerful tool for biopharmaceutical manufacturers to monitor and control the critical quality attribute of glycosylation, thereby ensuring the consistent production of safe and efficacious biologic drugs.
Immunoglobulin G (IgG) N-glycosylation is a critical post-translational modification that significantly influences antibody effector functions, including modulation of inflammatory responses [13] [44]. The fragment crystallizable (Fc) region of each IgG heavy chain contains a conserved N-linked glycosylation site at asparagine 297 (Asn-297), whose glycan structures directly affect binding affinity to Fcγ receptors and subsequent immune activation [13] [45]. Aberrant IgG glycosylation patterns have been associated with various diseases, including ischemic stroke, moyamoya disease, autoimmune disorders, and cancer, highlighting the importance of precise glycan analysis for both clinical diagnostics and biopharmaceutical development [13] [44] [45].
Hydrophilic interaction liquid chromatography with ultra-performance liquid chromatography (HILIC-UPLC) has emerged as a powerful analytical platform for profiling IgG N-glycans due to its high resolution, reproducibility, and capability to separate structurally similar glycan isomers [7] [45]. This application note details a comprehensive protocol for processing raw chromatographic data to derive biologically meaningful relative abundance values of glycan traits, framed within the context of IgG N-glycan analysis research.
Materials and Methods
Research Reagent Solutions
Table 1: Essential reagents and materials for HILIC-UPLC based IgG N-glycan analysis
| Item | Function/Application |
|---|---|
| Protein G monolithic plate (BIA Separations) | Affinity purification of IgG from serum/plasma samples [13] |
| PNGase F enzyme | Enzymatic release of N-glycans from IgG Fc region [13] |
| 2-aminobenzamide (2-AB) | Fluorescent labeling of released glycans for detection [13] [45] |
| Waters Acquity UPLC H-class instrument with FLR detector | Chromatography system for HILIC separation and fluorescence detection [7] |
| Waters BEH Glycan chromatography column (100 × 2.1 mm i.d., 1.7 µm BEH particles) | Stationary phase for HILIC separation of labeled glycans [7] |
| 100 mM ammonium formate (pH 4.4) | Mobile phase component (solvent A) [7] |
| Acetonitrile (ACN) | Mobile phase component (solvent B) [7] |
| Empower 3 software | Chromatogram processing and peak integration [7] |
IgG Purification and N-glycan Release
The IgG purification and glycan processing workflow follows established methodologies with specific modifications for high-throughput analysis [13]. Initially, IgG is isolated from serum or plasma using protein G affinity plates, ensuring high purity by eluting with formic acid followed by immediate neutralization with ammonium bicarbonate. The purified IgG then undergoes enzymatic cleavage of N-glycans through incubation with PNGase F, which specifically liberates glycans from the Asn-297 glycosylation site. The released glycans are subsequently labeled with 2-AB via reductive amination to enable fluorescent detection. Excess label is removed through various cleanup techniques, and the labeled glycans are resuspended in an appropriate solvent for HILIC-UPLC analysis [13] [7].
HILIC-UPLC Separation Parameters
Table 2: Optimized HILIC-UPLC parameters for separation of fluorescently labeled N-glycans
| Parameter | Specification |
|---|---|
| Column | Waters BEH Glycan, 100 × 2.1 mm i.d., 1.7 µm [7] |
| Column Temperature | 60°C [7] |
| Mobile Phase A | 100 mM ammonium formate, pH 4.4 [7] |
| Mobile Phase B | Acetonitrile [7] |
| Flow Rate | 0.4 mL/min [7] |
| Gradient | 75% to 62% B over 25 minutes [7] |
| Injection Volume | Typically 1-10 µL |
| Detection | Fluorescence (λ~ex~ = 330 nm, λ~em~ = 420 nm) [7] |
| Analytical Run Time | 25 minutes [7] |
Data Processing Workflow
Figure 1: Workflow for processing chromatographic data to relative abundance of glycan traits. The process begins with raw chromatogram acquisition and proceeds through sequential computational steps to derive biologically meaningful glycosylation traits.
Chromatogram Processing and Peak Integration
Following HILIC-UPLC separation, the obtained chromatograms are processed using specialized software such as Empower 3 [7]. The integration process typically involves manual adjustment of individual chromatograms to ensure analytical consistency and correct peak identification. Each chromatogram is systematically segmented into 24 distinct peaks (GP1-GP24), representing the most abundant glycan structures present in the IgG glycome [13] [7]. The quantitative analysis is performed by calculating the area under each peak relative to the total integrated glycan peak area, yielding relative abundance values for each glycan structure.
Calculation of Derived Glycosylation Traits
Beyond the initial 24 glycan peaks, derived glycosylation traits provide more comprehensive biological insights by grouping structurally and functionally related glycans. These calculated traits aggregate multiple individual peaks into four major glycosylation features that have demonstrated clinical relevance [13]:
- Galactosylation: Sum of mono- and digalactosylated glycans
- Fucosylation: Proportion of fucosylated structures
- Sialylation: Sum of monosialylated and disialylated glycans
- Bisecting GlcNAc: Presence of bisecting N-acetylglucosamine
The mathematical formulas for calculating these traits from the initial 24 peaks are well-established in the literature [13] and can be implemented programmatically for high-throughput data processing.
Advanced Data Processing Tools
Automated Data Curation Platforms
For large-scale clinical studies, manual data processing becomes impractical. Specialized software tools have been developed to streamline this process. GlycoDash, an R Shiny-based interactive web application, addresses this need by providing automated, visually assisted curation of large glycoproteomics datasets [46]. The platform incorporates multiple quality control metrics, including measurement and metadata linking, spectral and analyte curation, normalization options, and repeatability assessment, significantly reducing processing time while maintaining data integrity [46].
Glycan Identification and Quantification Tools
GlycoGenius represents another advanced bioinformatics solution that automates the identification and quantification of glycans from LC-MS data [47]. This open-source program features a comprehensive workflow that constructs search spaces, identifies and scores glycans, quantifies results, and annotates fragment spectra [47]. Its capacity to process complex datasets while distinguishing isobaric compounds addresses a critical challenge in glycomics data analysis, making it particularly valuable for research requiring high-throughput processing of clinical samples [47].
Applications in Clinical Research
Disease Association Studies
The processed glycan data has demonstrated significant clinical utility in predicting disease risk. A nine-year prospective cohort study utilizing this HILIC-UPLC protocol revealed that specific IgG N-glycosylation patterns could predict long-term risk of ischemic stroke [13]. The study found that decreased levels of fucosylation and galactosylation were significantly associated with increased stroke risk, potentially mediated by upregulation of chronic inflammatory processes [13]. A glycosylation-based prediction model developed from this data showed promising capability to predict ischemic stroke risk with an area under the curve (AUC) of 0.756 [13].
Similarly, research on moyamoya disease established a diagnostic model combining initial glycans with inflammatory factors that achieved exceptional discrimination between patients and healthy controls (AUC: 0.963) [44]. This study also observed decreased sialylation, galactosylation, and fucosylation, along with increased bisecting GlcNAc in MMD patients, suggesting these glycan features may contribute to disease pathogenesis through inflammatory regulation [44].
Quality Control in Biopharmaceutical Development
In biopharmaceutical applications, the HILIC-UPLC methodology provides critical quality attribute monitoring for therapeutic antibody development [45]. The protocol enables precise quantification of Fc-glycosylation patterns that affect antibody effector functions, including antibody-dependent cellular cytotoxicity (influenced by afucosylation) and complement-dependent cytotoxicity (influenced by galactosylation) [45]. Method validation studies have demonstrated that HILIC-UPLC exhibits excellent precision and accuracy, particularly for detecting minor glycan species such as sialylated glycans that may impact therapeutic antibody safety and efficacy [45].
The processing of chromatographic data to derive relative abundance values of glycan traits represents a critical transformation step in IgG N-glycosylation research. The structured protocol outlined in this application note, from initial peak integration through derived trait calculation, enables researchers to convert raw analytical data into biologically and clinically meaningful metrics. The standardized workflow ensures reproducibility across studies while allowing sufficient flexibility for project-specific adaptations. As research continues to establish connections between IgG glycosylation patterns and disease states, robust data processing methodologies will remain fundamental to advancing both clinical diagnostics and biopharmaceutical development.
Troubleshooting Your HILIC-UPLC Run: Ensuring Precision and Reproducibility
Sialic acids are crucial terminal monosaccharides on immunoglobulin G (IgG) N-glycans, modulating its anti-inflammatory activity. However, their labile nature presents a significant challenge during hydrophilic interaction liquid chromatography (HILIC) analysis, as losses can compromise data integrity and lead to erroneous biological conclusions. This application note provides a detailed protocol for HILIC-UPLC analysis of procainamide (ProA)-labeled IgG N-glycans, focusing on the critical control of elution pH and separation speed to prevent sialic acid loss. We present optimized methodologies and key reagent solutions to ensure reproducible and accurate characterization of sialylated glycoforms for drug development and biomedical research.
The glycosylation of IgG, particularly the presence of terminal sialic acids, is a critical quality attribute for therapeutic antibodies, influencing stability, half-life, and immunogenicity [2]. Sialic acids are prone to loss during sample preparation and chromatographic analysis due to their chemical instability, which can be exacerbated by suboptimal pH conditions and excessive analysis times [48] [49]. Hydrophilic interaction liquid chromatography (HILIC) with fluorescence detection is a powerful tool for separating released and labeled N-glycans. This document details a robust HILIC-UPLC protocol that safeguards sialic acid integrity through precise control of elution conditions, enabling reliable profiling for biopharmaceutical development.
Experimental Protocols
IgG Purification and N-Glycan Release
This section describes the isolation of IgG from biofluids and the subsequent release of N-glycans.
Materials:
- Protein G Agarose Fast Flow beads
- Phosphate-buffered saline (PBS)
- Deionized water
- 100 mM Formic Acid
- 1 M Ammonium Bicarbonate (NH₄HCO₃)
- Sodium dodecyl sulfate (SDS)
- Peptide-N-Glycosidase F (PNGase F)
Procedure:
- IgG Capture: Add 20 µL of Protein G Agarose bead suspension to 0.5 - 5 mL of saliva or diluted plasma. Incubate for 2 hours at room temperature with constant shaking at 800 rpm [2].
- Washing: Centrifuge the sample, discard the supernatant, and wash the beads three times with 200 µL of PBS, followed by three washes with 200 µL of deionized water using a vacuum manifold or centrifugation.
- Elution: Elute the captured IgG from the beads by incubating with 100 mM formic acid for 15 minutes at room temperature. Collect the eluate by centrifugation into a plate containing 17 µL of 1 M ammonium bicarbonate for neutralization.
- Drying: Transfer 50 µL of the neutralized eluate to a new vial and dry for 2 hours at 37°C in a vacuum centrifuge [2].
- N-Glycan Release: Denature the dried IgG sample with SDS and incubate at 65°C. Subsequently, release N-glycans by incubation with PNGase F according to the manufacturer's instructions [2].
Procainamide Labeling and Clean-up of N-Glycans
Fluorescent labeling enhances detection sensitivity.
Materials:
- Procainamide hydrochloride
- Glacial Acetic Acid
- Dimethyl Sulfoxide (DMSO)
- 2-Picoline Borane
Procedure:
- Labeling Reaction: To the released N-glycans, add 25 µL of a procainamide mixture (4.32 mg procainamide hydrochloride in glacial acetic acid/DMSO, 30:70 v/v). Incubate at 65°C for 1 hour [2].
- Reduction: Add 25 µL of a reducing agent solution (4.48 mg of 2-picoline borane in glacial acetic acid/DMSO, 30:70 v/v) and incubate at 65°C for an additional 1.5 hours [2].
- Clean-up: Purify the ProA-labeled N-glycans using solid-phase extraction (e.g., with hydrophilic-lipophilic balance cartridges) to remove excess labeling reagents.
HILIC-UPLC Analysis with Optimized pH and Speed
The core protocol for separating sialylated N-glycans with minimal loss.
Materials:
Chromatographic Procedure:
- Column Temperature: Maintain at 60°C [7].
- Detection: Set fluorescence detector to 330 nm excitation and 420 nm emission [7].
- Flow Rate: 0.4 mL/min [7].
- Injection Volume: 1-5 µL [50].
- Elution Gradient: Employ a linear gradient as specified in the table below.
- System Re-equilibration: Ensure re-equilibration with initial conditions for at least 3-5 column volumes before subsequent injections.
The Scientist's Toolkit: Essential Research Reagents
The following table lists key reagents and their critical functions in the IgG N-glycan analysis workflow.
Table 1: Key Research Reagent Solutions for IgG N-Glycan Analysis
| Reagent/Material | Function/Explanation |
|---|---|
| Protein G Agarose Beads | Affinity resin for specific capture and purification of IgG from complex biological matrices like plasma and saliva [2]. |
| PNGase F Enzyme | Enzyme that catalyzes the cleavage of N-linked glycans from the IgG backbone, essential for downstream analysis [2]. |
| Procainamide (ProA) | A fluorescent label that tags the reducing end of released N-glycans, enabling highly sensitive fluorescence detection and improving ionization for MS [2] [48]. |
| Ammonium Formate (pH 4.4) | The salt buffer in the aqueous mobile phase (Solvent A). Its controlled acidic pH is critical for stabilizing sialic acids and preventing their loss during chromatography [7]. |
| Waters BEH Glycan Column | A dedicated HILIC column with 1.7 µm particles designed for high-resolution separation of labeled glycans [7]. |
Optimized Chromatographic Parameters
Optimal control of elution parameters is non-negotiable for preserving sialic acids. The following table summarizes the quantitative conditions that form the core of this optimized protocol.
Table 2: Optimized HILIC-UPLC Parameters for Sialylated N-Glycan Analysis
| Parameter | Optimal Setting | Rationale & Impact |
|---|---|---|
| Elution pH | 4.4 (Ammonium Formate) | Stabilizes sialic acids, minimizing hydrolysis and desialylation during the analysis [7]. |
| Analytical Run Time | 25 minutes | Provides a balance between high-resolution separation and practical throughput, minimizing on-column degradation [7]. |
| Gradient Profile | 75% to 62% ACN in 25 min | This shallow linear gradient effectively resolves sialylated glycan isomers from neutral structures [7]. |
| Column Temperature | 60 °C | Enhances peak resolution and efficiency without promoting significant sialic acid degradation under the controlled pH [7]. |
| Flow Rate | 0.4 mL/min | Standard for 2.1 mm i.d. columns, providing optimal kinetics and resolution for the particle size used [7]. |
Data Interpretation and Troubleshooting
- Peak Identification: Identify glycan peaks based on their retention times relative to external glucose homopolymer standards or known internal standards. Sialylated glycans typically elute after neutral glycans in HILIC.
- Linkage Isomer Differentiation: Be aware that α2,6-linked sialic acids generally have a stronger affinity for the HILIC stationary phase and elute later than their α2,3-linked isomers [48].
- Common Issues:
- Loss of Sialylated Peaks: Check the pH of Solvent A and ensure it is precisely 4.4. Avoid using old buffers. Also, inspect the sample preparation workflow for acidic conditions.
- Poor Resolution: Verify that the column is adequately equilibrated and the gradient is delivered accurately. Consider the performance of the UPLC column itself.
Logical Workflow and Pathway Visualization
The following diagram illustrates the complete experimental workflow for IgG N-glycan analysis, highlighting the critical steps for preserving sialic acids.
The precise control of elution pH at 4.4 and the use of an optimized 25-minute gradient are paramount for the reliable HILIC-UPLC analysis of sialylated IgG N-glycans. The protocols and parameters detailed in this application note provide a robust framework for researchers to obtain accurate and reproducible glycan profiles, essential for advancing biopharmaceutical development and glycoscience research.
Optimizing PNGase F Activity for Complete Glycan Release
Within the field of glycomics, the analysis of immunoglobulin G (IgG) N-glycosylation has gained significant prominence due to its profound influence on antibody structure and effector functions. Changes in IgG N-glycosylation are implicated in various physiological and pathological conditions, including aging, autoimmune diseases, and cancer, making it a critical focus for biomarker discovery and therapeutic development [2] [51]. The reliability of this analysis fundamentally depends on the complete and efficient release of N-linked glycans from glycoproteins, a process primarily facilitated by the enzyme Peptide-N-Glycosidase F (PNGase F) [52]. This application note details optimized protocols for PNGase F-mediated glycan release, specifically framed within a robust HILIC-UPLC workflow for IgG N-glycan analysis, providing researchers with methodologies to ensure maximal glycan recovery and reproducible results.
PNGase F Fundamentals and Mechanism
PNGase F is an amidase that cleaves the bond between the innermost N-acetylglucosamine (GlcNAc) and asparagine residues of high mannose, hybrid, and complex oligosaccharides on N-linked glycoproteins [52]. Unlike endoglycosidases, which cleave glycosidic bonds within the glycan structure, PNGase F releases the entire intact glycan, making it ideal for subsequent structural analysis [53]. Its ability to release nearly all N-linked glycan types, with the exception of those containing a 1,3-core fucose (typically found in plants), makes it the most versatile enzyme for N-glycan release [52] [53].
The enzymatic reaction can be summarized as follows:
- Input: Glycoprotein (with N-linked glycan attached to Asn)
- Enzyme: PNGase F
- Action: Hydrolysis of the GlcNAc-Asn amide bond
- Output: Fully released oligosaccharide (with a free reducing end) and a deglycosylated protein (where Asn is converted to Asp) [54]
Critical Parameters for Optimizing PNGase F Activity
Denaturation Conditions
Effective protein denaturation is a prerequisite for complete glycan release, as it exposes the glycosylation sites to the enzyme. Different denaturation strategies can be employed, each with specific considerations.
Table 1: Comparison of Denaturation Methods
| Denaturation Method | Recommended Conditions | Impact on Glycan Release | Considerations |
|---|---|---|---|
| SDS/Heat Denaturation | 2% SDS, 1 M β-mercaptoethanol, 95°C for 5 min [55] | High efficiency; essential for complex glycoproteins | Must be followed by non-ionic detergent (e.g., NP-40) addition to neutralize SDS for enzyme compatibility [55] |
| Alternative Denaturation | Incubation with SDS at 65°C [2] | Effective for standard IgG analysis | Simpler workflow, directly compatible with subsequent enzymatic steps |
Enzyme Incubation Parameters
The efficiency of glycan release is highly dependent on incubation time, temperature, and the enzyme-to-substrate ratio.
Table 2: Incubation Parameters for Optimal Activity
| Parameter | Standard Conditions | Optimized/Alternative Conditions | Application Context |
|---|---|---|---|
| Time | 12-18 hours (overnight) [53] [55] | As little as 5 minutes with microwave irradiation [55] | Overnight: High yield, convenient. Microwave: Ultra high-throughput. |
| Temperature | 37°C [2] [53] | -- | Standard for enzyme stability and activity. |
| Detergent Use | With NP-40 detergent [55] | Without NP-40 detergent [55] | NP-40 can be crucial for activity after SDS denaturation; however, one study found omission led to greater glycan abundance [55]. |
Quantitative Assessment of Release Efficiency
When compared to chemical release methods like sodium hypochlorite (NaOCl), PNGase F demonstrates significantly superior absolute recovery of N-linked glycans, despite the latter being faster and cheaper [53]. The relative glycan composition is similar between the two methods, but for applications requiring maximum sensitivity and completeness, PNGase F remains the gold standard [53].
Integrated Protocol for IgG N-Glycan Analysis via HILIC-UPLC
This section provides a detailed workflow for the analysis of IgG N-glycans, from sample preparation to chromatographic separation, incorporating optimized PNGase F usage.
IgG Purification and Denaturation
- IgG Capture: Isolate IgG from plasma or saliva using Protein G Agarose Fast Flow beads. For 100 µL of plasma, dilute 1:7 with phosphate-buffered saline (PBS). Incubate with beads for 2 hours with shaking (e.g., 800 rpm) [2].
- Washing: Wash the bead-bound IgG complex thoroughly with PBS and deionized water using a vacuum manifold or positive pressure unit to remove contaminants [2] [51].
- Elution: Elute the purified IgG from the beads using 100 mM formic acid, and immediately neutralize the eluate with ammonium bicarbonate (e.g., 17 µL of 1 M ammonium bicarbonate per 100 µL eluate) [2].
- Denaturation: Transfer the eluted IgG to a PCR plate and dry in a vacuum centrifuge. Denature the dried IgG by resuspending in a solution containing sodium dodecyl sulfate (SDS) and heating at 65°C [2] [51].
Enzymatic Glycan Release with PNGase F
- To the denatured IgG sample, add PNGase F (e.g., 500 units from New England Biolabs) in the appropriate reaction buffer [2] [53].
- Incubate for a minimum of 12 hours (overnight) at 37°C to ensure complete release of N-glycans [2] [55].
- Following incubation, the released glycans are in the supernatant and are ready for fluorescent labeling.
Fluorescent Labeling and Cleanup
- Labeling: Label the released glycans with a fluorescent tag such as procainamide (ProA). Add the procainamide labeling mixture to the sample and incubate at 65°C for 1 hour. Then, add a reducing agent solution (e.g., 2-picoline borane) and incubate for a further 1.5 hours at 65°C [2].
- Cleanup: Purify the labeled glycans using solid-phase extraction (e.g., G10 desalting columns) to remove excess label and salts [2] [53]. The purified glycans can be dried and reconstituted in an appropriate solvent for analysis.
HILIC-UPLC Analysis
- Column: Use a Waters BEH Glycan column (100 × 2.1 mm, 1.7 µm) maintained at 60°C [7].
- Mobile Phase: Solvent A: 100 mM ammonium formate, pH 4.4; Solvent B: Acetonitrile (ACN) [7].
- Gradient: Employ a linear gradient from 75% to 62% solvent B over 25 minutes at a flow rate of 0.4 mL/min [7].
- Detection: Use a fluorescence detector with excitation at 330 nm and emission at 420 nm [7].
- Data Analysis: Integrate the resulting chromatogram into distinct glycan peaks (e.g., 24 peaks). Relative abundances are calculated based on total area normalization [7].
Figure 1: Experimental workflow for IgG N-glycan analysis, from sample preparation to data analysis.
The Scientist's Toolkit: Essential Research Reagents
Table 3: Key Reagents for IgG N-Glycan Sample Preparation
| Item | Function/Description | Example Source/Note |
|---|---|---|
| PNGase F | Amidase that releases intact N-linked glycans. | Non-recombinant, protease-free, ≥95% purity (NEB) [52]. |
| Protein G Beads | Affinity purification of IgG from complex biofluids. | Fast Flow beads for efficient capture [2]. |
| Denaturing Agents | Unfolds glycoprotein to expose glycosylation sites. | SDS and β-mercaptoethanol [55]. |
| Detergent Solution | Neutralizes SDS to allow PNGase F activity. | Non-ionic detergents like NP-40 [55]. |
| Fluorescent Label (ProA) | Tags released glycans for sensitive detection. | Procainamide enables fluorescence detection (FLR) [2]. |
| HILIC-UPLC Column | Separates labeled glycans by hydrophilicity. | Waters BEH Glycan column, 1.7 µm particles [7]. |
| Automation Platform | High-throughput sample preparation. | Tecan Freedom Evo 200 with positive pressure unit [51]. |
Troubleshooting and Advanced Applications
Common Optimization Challenges
- Incomplete Deglycosylation: This can result from insufficient denaturation or the presence of enzyme inhibitors. Ensure proper denaturation conditions are met and that the enzyme is active. For challenging samples, increasing the incubation time or enzyme amount may be necessary.
- Introduction of Artifacts: The use of microwave irradiation to accelerate the PNGase F reaction, while effective for increasing throughput, requires careful optimization of power and temperature to prevent glycan degradation [55].
- Automation Considerations: While automation significantly improves throughput and reproducibility, challenges such as "dead" volumes, sample evaporation, and the need for specialized software knowledge must be addressed during method development [51].
Application in Salivary IgG Glycomics
Saliva presents a non-invasive alternative to plasma for IgG analysis. However, its much lower IgG concentration (~0.014 mg/mL in saliva vs. ~12.5 mg/mL in plasma) demands a highly sensitive workflow [2]. The optimized protocol described herein, utilizing bead-based immunoprecipitation and ProA labeling for HILIC-UPLC-FLR, has been successfully applied for the ultrasensitive analysis of salivary IgG N-glycome, opening avenues for non-invasive biomarker discovery [2].
The complete and efficient release of N-glycans by PNGase F is the cornerstone of reliable IgG glycomic profiling. Optimization of denaturation conditions, incubation parameters, and the integration into a robust HILIC-UPLC workflow are critical for success. The protocols detailed in this application note, supported by quantitative data and troubleshooting guidance, provide a clear pathway for researchers to achieve high-quality, reproducible results in both fundamental research and biopharmaceutical development.
Managing Sample Throughput and Batch Effects with Robust Experimental Design
Large-scale glycomics studies, particularly those investigating Immunoglobulin G (IgG) N-glycans using HILIC-UPLC, are essential for identifying glycosylation biomarkers in human disease [13] [56]. However, these studies face significant challenges in maintaining data quality across thousands of samples processed over extended periods. Robust experimental design is critical for managing sample throughput and mitigating batch effects to ensure that identified biological variations reflect true physiological states rather than technical artifacts [56]. This protocol outlines a comprehensive framework for implementing robust experimental designs in high-throughput glycomics, specifically addressing the sources of variation that can compromise data integrity in large studies.
Core Principles of Robust Experimental Design
In high-throughput glycomics, multiple factors introduce variability into experimental results. These can be categorized as:
- Controllable factors: Variables that can be set during both experimental and production phases (e.g., buffer composition, incubation time) [57]
- Noise factors: Variables controllable during experiments but not during production (e.g., reagent lot variations, analyst performance) [57]
- Uncontrollable factors: Variables not controllable during either phase (e.g., ambient temperature fluctuations, instrumental drift) [57]
Design Strategies for Different Uncertainties
Robust experimental designs employ specific strategies to address different types of uncertainty:
Table: Robust Design Strategies for Experimental Uncertainties
| Type of Uncertainty | Design Approach | Key Application |
|---|---|---|
| Model Uncertainty | Minimax/Maximin Efficiency Designs | Protects against worst-case scenarios when model structure is uncertain |
| Parameter Uncertainty | Bayesian Optimal Designs | Incorporates prior knowledge about parameter distributions |
| Multiple Criteria | Compound Optimal Designs | Balances performance across different objectives or models |
| General Robustness | Augmented Designs | Adds strategic support points to enhance design stability [58] |
Experimental Protocol: IgG N-Glycan Analysis with Batch Effect Mitigation
Materials and Reagents
Table: Essential Research Reagent Solutions for HILIC-UPLC IgG N-Glycan Analysis
| Reagent/Equipment | Specification | Function in Protocol |
|---|---|---|
| CIM Protein G 96-well plate | BIA Separations | High-throughput IgG isolation from plasma/serum [56] |
| Waters BEH Glycan Column | 100 × 2.1 mm i.d., 1.7 µm BEH particles | HILIC separation of 2-AB-labeled N-glycans [56] |
| AcroPrep GHP membrane 96-well filter plate | - | Cleanup of labeled N-glycans in high-throughput format [35] |
| 2-aminobenzamide (2-AB) | - | Fluorescent labeling of released N-glycans [13] [56] |
| PNGase F enzyme | - | Release of N-glycans from IgG proteins [13] [35] |
| Ammonium bicarbonate | - | Neutralization after IgG elution with formic acid [13] |
| HILIC (U)HPLC columns | Amide-functionalized | Retention and separation of polar glycans [59] |
IgG Isolation Protocol
Buffer Preparation: Freshly prepare IgG isolation buffers using distilled water each week. Filter through 0.2-μm PES filters and store at 4°C (except 10× PBS) to minimize contamination [56].
High-Throughput Isolation:
- Utilize CIM Protein G 96-well plates with a vacuum manifold for parallel processing [56].
- Apply plasma/serum samples to the pre-equilibrated Protein G plates.
- Wash with appropriate buffers to remove non-specifically bound proteins.
- Elute IgG using formic acid and immediately neutralize with ammonium bicarbonate [13].
Quality Assessment: Verify IgG concentration and purity using spectrophotometric methods before proceeding to glycan release.
N-Glycan Release, Labeling, and Cleanup
Protein Denaturation: Resuspend dried protein pellets in PBS with 1.3% SDS and 0.5% βME. Incubate at 95°C for 10 minutes to denature proteins and eliminate disulfide bonds [35].
Enzymatic Release:
- Add PNGase F enzyme (5 U) to the denatured protein solution.
- Incubate overnight at 37°C to release N-glycans [35].
- Repeat enzyme addition and incubation for complete release.
Glycan Cleanup:
- Utilize Amicon Ultra 2 mL Centrifugal Filter Devices to separate released glycans from proteins.
- Concentrate glycan-containing flow-through using vacuum concentration [35].
Fluorescent Labeling:
Cleanup of Labeled Glycans:
- Use AcroPrep GHP membrane 96-well filter plates with 96% ACN for HILIC-based cleanup.
- Elute purified labeled glycans with ultrapure water for HILIC-UPLC analysis [35].
HILIC-UPLC Analysis
Chromatographic Conditions:
Separation Protocol:
- Employ gradient elution optimized for IgG N-glycans
- Maintain consistent injection volumes and column equilibration times between runs
- Include quality control samples at regular intervals to monitor system performance
Diagram Title: HILIC-UPLC IgG N-Glycan Analysis Workflow
Implementing Robustness in Experimental Design
Randomization and Blocking Strategies
Proper experimental design is the foundation for managing batch effects in high-throughput glycomics:
Plate Layout Randomization:
Batch Design:
- Process complete biological groups within the same batch when possible.
- Include pooled quality control samples in each batch to monitor technical variability.
Analyst Rotation:
- Rotate analysts across different batches to prevent operator-specific biases from affecting particular sample groups [56].
Quality Control Measures
Quality Control Samples:
- Create a pooled plasma/serum sample from multiple donors as a quality control reference.
- Include QC samples at the beginning, end, and at regular intervals within each batch (recommended frequency: 5-10% of total samples) [56].
System Suitability Testing:
- Perform daily system suitability tests using standard glycan mixtures.
- Monitor retention time stability, peak shape, and resolution to detect chromatographic drift.
Data Quality Thresholds:
- Establish acceptance criteria for chromatographic performance before processing study samples.
- Define thresholds for peak width, symmetry, and retention time stability.
Diagram Title: Quality Assurance Framework for Robust Glycomics
Method Validation and Robustness Testing
Comprehensive Validation Protocol
For high-throughput glycomics methods to be considered robust, they must demonstrate stability over extended periods (several months) to reliably detect small biological variations [56]. Implement a tiered validation approach:
Repeatability Assessment:
- Process 6-8 replicate samples within a single day
- Calculate coefficients of variation (CV) for all measured glycan peaks
- Acceptable performance: CV < 15% for major glycan species [60]
Intermediate Precision:
- Analyze replicates over 3-5 different days with different analysts
- Monitor between-day and between-analyst variation
- Target CV < 20% for long-term stability [56]
Between-Batch Variation:
- Process quality control samples in multiple batches over time
- Track peak area and retention time stability
- Implement statistical process control charts for ongoing monitoring
Robustness Testing Using Experimental Designs
Plackett-Burman Screening Design:
- Employ screening designs to identify critical factors affecting glycan analysis [56]
- Test variations in factors including incubation times, temperature, reagent volumes, and buffer pH
- Identify factors with significant impact on data quality for tighter control
Variance Component Analysis:
- Quantify contributions of different protocol steps to total variance
- Focus optimization efforts on steps contributing most to overall variability
Table: Validation Metrics for Robust HILIC-UPLC Glycan Analysis
| Validation Parameter | Acceptance Criterion | Assessment Method |
|---|---|---|
| Repeatability (intra-day) | CV < 15% for major peaks | 6-8 replicates in one day [60] |
| Intermediate precision | CV < 20% for major peaks | Replicates over 3-5 days [56] |
| Linear range | R² > 0.99 | 75-fold concentration gradient [60] |
| Retention time stability | CV < 2% | Quality control samples across batches |
| Process efficiency | >85% sample recovery | Spiked standard quantification |
Data Processing and Normalization
Advanced Normalization Strategies
Normalization is critical for removing technical variation while preserving biological signals:
Probabilistic Quotient Normalization:
Quality Control-Based Normalization:
- Use quality control samples to correct for batch effects
- Implement robust linear regression or LOESS normalization based on QC trends
Batch Effect Correction:
- Apply statistical methods such as ComBat or Remove Unwanted Variation (RUV)
- Validate correction efficiency by demonstrating reduced association between technical factors and glycan measurements
Data Quality Assessment
Automated Quality Control:
- Implement automated algorithms to assess chromatographic quality
- Flag samples with poor peak shape, excessive noise, or abnormal retention times
Multivariate Quality Control:
- Use principal component analysis to identify outliers in quality control samples
- Establish control limits based on historical QC data
Implementing robust experimental designs for HILIC-UPLC-based IgG N-glycan analysis requires integrated strategies addressing both pre-analytical and analytical variability. Through careful experimental planning, appropriate randomization, comprehensive validation, and advanced data normalization, researchers can effectively manage sample throughput while minimizing batch effects. The protocol outlined here provides a framework for generating high-quality glycomics data capable of detecting biologically relevant changes in glycosylation patterns, essential for both clinical research and biopharmaceutical development. As glycomics continues to evolve toward larger-scale applications, these robust design principles will become increasingly critical for ensuring data reliability and reproducibility.
In the analysis of Immunoglobulin G (IgG) N-glycans using Hydrophilic Interaction Liquid Chromatography with Ultra-Performance Liquid Chromatography (HILIC-UPLC), researchers frequently encounter technical challenges that can compromise data quality. Peak broadening and poor resolution represent two particularly prevalent issues that directly impact the reliability of glycan profiling data, potentially obscuring biologically relevant findings. Within the context of IgG N-glycosylation research—where subtle glycan variations can modulate inflammatory processes and disease risk—maintaining optimal chromatographic performance is paramount [62]. This application note details the primary causes of these chromatography issues and provides validated protocols to achieve robust, high-resolution separation of complex IgG N-glycan profiles.
Understanding the Mechanisms and Impact
Fundamental HILIC Principles
HILIC operates as a partition-based chromatographic mode where separation occurs through analyte partitioning between a water-enriched layer immobilized on a hydrophilic stationary phase and a hydrophobic mobile phase typically rich in acetonitrile [63]. This mechanism effectively retains and separates polar analytes like released N-glycans. The technique is considered orthogonal to reversed-phase chromatography, offering distinct selectivity for glycosylation analysis [63].
Consequences in IgG N-glycan Research
Chromatographic imperfections directly impact data interpretation in significant ways:
- Reduced Peak Capacity: Broadened peaks decrease the number of discernible glycan species within a single analysis, potentially causing co-elution of structurally distinct glycans [64].
- Quantification Inaccuracy: Impaired resolution compromises peak integration precision, affecting the relative quantification of critical glycan features such as galactosylation and fucosylation—parameters with demonstrated clinical relevance in disease risk assessment [62].
- Compromised Reproducibility: Inconsistent peak shapes and retention times hinder analytical precision across multiple samples and batches, undermining longitudinal study validity [60].
Troubleshooting Chromatographic Performance
The following table summarizes the primary causes and corresponding solutions for addressing peak broadening and poor resolution in HILIC-UPLC IgG N-glycan profiling.
Table 1: Troubleshooting Guide for HILIC-UPLC IgG N-Glycan Analysis
| Issue Category | Specific Cause | Impact on Chromatography | Recommended Solution |
|---|---|---|---|
| Sample Preparation | Incomplete removal of salts or buffers | Peak broadening and tailing | Implement thorough clean-up using protein G monolithic plates or Sepharose HILIC SPE [24] [60] |
| Inefficient glycan labeling | Variable detector response | Standardize 2-aminobenzamide (2-AB) labeling protocol; verify labeling efficiency [62] [24] | |
| Column Considerations | Inappropriate stationary phase | Poor selectivity for glycan isomers | Use validated BEH amide columns (e.g., Waters ACQUITY) [65] |
| Column contamination | Increased backpressure; peak shape degradation | Implement regular column cleaning; use in-line filters; passivate new columns [65] | |
| Stationary phase deterioration | Retention time shifting | Monitor system suitability standards; replace column when resolution degrades | |
| Mobile Phase & Parameters | Inadequate water content | Poor resolution of polar glycans | Optimize gradient starting conditions (typically 70-80% organic) [63] |
| Unbuffered mobile phases | Peak broadening due to ionic interactions | Add volatile buffers (e.g., 50mM ammonium formate) to control ionic effects [63] | |
| Suboptimal flow rate or temperature | Reduced separation efficiency | Increase temperature (up to 60-70°C) and optimize flow rate for maximum efficiency [65] |
Experimental Protocols for Optimal Performance
IgG Isolation and Glycan Release
This protocol adapts methodologies from large-scale glycosylation studies [24] and recent stroke risk research [62].
Materials:
- Protein G monolithic 96-well plates (BIA Separations) [24]
- Phosphate Buffered Saline (PBS), pH 7.4
- Elution buffer: 100mM formic acid
- Neutralization buffer: 1M ammonium bicarbonate
- PNGase F enzyme (Roche)
- SpeedVac concentrator
Procedure:
- Condition Protein G monolithic plate with PBS.
- Load 10-20 µL of serum or plasma sample per well.
- Wash with PBS to remove unbound proteins.
- Elute IgG with 100mM formic acid.
- Immediately neutralize eluate with 1M ammonium bicarbonate.
- Denature IgG by heating at 65°C for 10 minutes.
- Add PNGase F enzyme and incubate at 37°C for 3-18 hours to release N-glycans.
- Store released glycans at -80°C or proceed to labeling.
Fluorescent Labeling and Cleanup
Based on established HILIC-UPLC glycomics protocols [62] [24].
Materials:
- 2-aminobenzamide (2-AB) labeling solution
- Sodium cyanoborohydride
- Dimethyl sulfoxide (DMSO)
- Acetonitrile (≥99.9%)
- Sepharose CL-4B HILIC SPE microplates [60]
Procedure:
- Prepare labeling solution: 2-AB in DMSO with sodium cyanoborohydride.
- Mix released glycans with labeling solution.
- Incubate at 65°C for 2 hours.
- Pre-equilibrate Sepharose CL-4B HILIC SPE plate with acetonitrile.
- Load labeled glycans diluted in acetonitrile.
- Wash with acetonitrile to remove unincorporated dye.
- Elute glycans with ultra-pure water.
- Dry samples in SpeedVac concentrator and reconstitute in acetonitrile for HILIC-UPLC analysis.
HILIC-UPLC Analysis
Optimized method for high-resolution IgG N-glycan separation [62] [65].
Equipment and Materials:
- HILIC-UPLC system (e.g., Waters ACQUITY UPLC)
- HILIC BEH amide column (1.7 µm, 2.1 × 150 mm; Waters)
- Solvent A: 50 mM ammonium formate, pH 4.4
- Solvent B: 100% acetonitrile
Chromatographic Conditions:
- Column temperature: 60°C
- Sample temperature: 10°C
- Injection volume: 5-10 µL
- Flow rate: 0.4 mL/min
- Detection: Fluorescence (Ex: 330 nm, Em: 420 nm)
Gradient Program:
*Time (min) %B Curve* 0 80 Initial 2 80 Isocratic 50 55 Linear 51 0 Linear 53 0 Isocratic 54 80 Linear 60 80 Isocratic - Equilibrate column with starting conditions (80% B) for 5-10 injections.
- Inject glycan samples using partial loop mode.
- Run gradient program.
- Include system suitability standards to monitor performance.
The Scientist's Toolkit
Table 2: Essential Research Reagents and Materials for HILIC-UPLC IgG N-Glycan Analysis
| Item | Function/Application | Examples/Specifications |
|---|---|---|
| Protein G Monolithic Plates | High-throughput IgG isolation from biological fluids | 96-well format; enables parallel processing of multiple samples [24] |
| BEH Amide HILIC Column | High-resolution separation of glycan isomers | 1.7 µm particle size; provides excellent peak shape for complex glycan mixtures [65] |
| PNGase F Enzyme | Enzymatic release of N-glycans from IgG | Recombinant form preferred for high activity and purity [24] |
| 2-Aminobenzamide (2-AB) | Fluorescent labeling of released glycans | Enables highly sensitive fluorescence detection; minimal structural interference [62] |
| Volatile Buffers | Mobile phase additives for pH control | Ammonium formate or acetate; MS-compatible [63] |
| Hydrophilic SPE Phases | Post-labeling cleanup | Sepharose CL-4B or similar; removes excess dye [60] |
Advanced Workflow and Method Integration
The following diagram illustrates the comprehensive workflow for IgG N-glycan analysis, highlighting critical control points where attention to protocol details prevents chromatographic issues.
Figure 1: Comprehensive Workflow for IgG N-Glycan Analysis with Critical Control Points
Emerging Alternatives and Complementary Techniques
While HILIC-UPLC remains the gold standard for released glycan analysis, several emerging technologies offer complementary approaches:
- Salt-Free HILIC-MS/MS: Recent advancements enable glycopeptide-based analysis without salts that impair MS sensitivity and robustness, providing simultaneous site-specificity and structural information [65].
- MALDI-TOF-MS with Internal Standards: High-throughput methods using matrix-assisted laser desorption/ionization time-of-flight mass spectrometry with full glycome internal standards enable rapid screening with quantification precision (CV ~10%) [60].
- Two-Dimensional Separations: Coupling HILIC with capillary gel electrophoresis (CGE) provides enhanced resolution for identifying minor glycan species through orthogonal separation mechanisms [64].
- Novel Fluorescent Tags: Imidazolium-based tags (e.g., 4'GITag) significantly improve detection sensitivity compared to traditional 2-AB labeling, enabling sub-femtomole level detection [15].
Effective management of peak broadening and resolution issues in HILIC-UPLC analysis of IgG N-glycans requires systematic attention to sample preparation, column selection, and mobile phase optimization. The protocols and troubleshooting guidelines presented here, validated in recent large-scale clinical studies [62], provide a robust framework for obtaining high-quality glycan profiling data. As the field advances toward increasingly complex analyses—including site-specific glycosylation and rare glycan variants—maintaining optimal chromatographic performance remains fundamental to elucidating the biological and clinical significance of IgG glycosylation.
Strategies for Analyzing Low-Abundance Glycan Species like Sialylated Structures
Within the framework of IgG N-glycan analysis research, the precise characterization of low-abundance glycan species, particularly sialylated structures, is paramount. These minor species significantly modulate the effector functions of therapeutic antibodies, including their anti-inflammatory activity and serum half-life [24] [45]. However, their analysis is complicated by low natural abundance, structural heterogeneity, and the lability of sialic acid residues [66]. This application note details integrated strategies, with a core HILIC-UPLC protocol, designed to overcome these challenges, enabling robust profiling and quantification of these critical glycoforms for biopharmaceutical development.
Analytical Platform Comparison for Glycan Analysis
Selecting the appropriate analytical platform depends on the required throughput, sensitivity, and level of structural detail. The table below summarizes key techniques applicable to the analysis of low-abundance sialylated glycans.
Table 1: Comparison of analytical platforms for the characterization of low-abundance and sialylated N-glycans.
| Analytical Platform | Key Strengths | Throughput | Quantitative Precision (CV) | Ideal Use Case |
|---|---|---|---|---|
| HILIC-UPLC (2-AB) [45] [67] | High-resolution separation of isomeric glycans; excellent reproducibility | Medium | ~10% (with internal standards) [60] | Routine, high-resolution profiling and comparability studies |
| HILIC-IM-MS [68] | Distinguishes sialic acid linkage isomers (α2,3 vs. α2,6) via IMS; provides compositional data | Medium | N/A | In-depth structural characterization and isomer differentiation |
| MALDI-TOF-MS (Full Glycome Internal Standard) [60] | Ultra-rapid analysis; high-throughput (192+ samples/run) | Very High | 6.44% - 12.73% [60] | Rapid clone screening and high-throughput batch monitoring |
| 2D-LC (WAX-HILIC) [69] | Comprehensive characterization; separates by charge and size; identifies low-level modifications | Low | N/A | Discovery-phase in-depth mapping of complex glycomes |
| Mixed-Mode Chromatography [70] | Enhanced recovery of acidic/phosphorylated glycans; high sensitivity | Medium | Features detectable <0.1% abundance [70] | Analysis of highly acidic glycan species (e.g., from lysosomal enzymes) |
Core HILIC-UPLC Protocol for IgG N-Glycan Profiling
This standardized protocol provides a foundation for high-resolution separation of IgG N-glycans, including low-abundance sialylated species [24] [67].
Materials and Reagents
- Protein G Monolithic Plate (BIA Separations) or equivalent protein A/G resin for high-throughput IgG purification [24].
- PNGase F (New England Biolabs) for enzymatic release of N-glycans.
- 2-Aminobenzamide (2-AB) fluorescent dye (Sigma-Aldrich) for glycan labeling [45].
- ACQUITY UPLC BEH Glycan Column, 1.7 µm, 2.1 × 150 mm (Waters Corporation) [67].
- Eluent A: 100 mM ammonium formate, pH 4.5 [67].
- Eluent B: Acetonitrile (LC-MS grade) [67].
Experimental Workflow
The following diagram outlines the complete workflow for IgG N-glycan analysis, from isolation to data analysis:
Detailed Procedural Steps
- IgG Isolation: Apply diluted plasma or cell culture supernatant to a 96-well protein G monolithic plate. Wash with phosphate-buffered saline (PBS) and elute IgG using a low-pH elution buffer (e.g., 100 mM formic acid), followed by immediate neutralization [24].
- N-Glycan Release: Denature purified IgG at 95°C for 10 minutes. Incubate with PNGase F (e.g., 1 µL per 10 µg IgG) in a compatible buffer (e.g., Rapid PNGase F Buffer) at 50°C for 1 hour to release N-glycans [68].
- Fluorescent Labeling: Label released glycans with 2-AB via reductive amination. Purify labeled glycans using solid-phase extraction (e.g., with graphitized carbon cartridges or Sepharose CL-4B HILIC plates for 96-well format) to remove excess dye [66] [60].
- HILIC-UPLC Analysis:
- Column: ACQUITY UPLC BEH Glycan, 1.7 µm, 2.1 × 150 mm.
- Temperature: 60°C.
- Gradient: From 75% to 50% Eluent B over 46.5 minutes at a flow rate of 0.4 mL/min.
- Detection: Fluorescence (FLR) with Ex. λ 330 nm and Em. λ 420 nm [67].
- Data Analysis: Identify glycan peaks by comparison with known glucose unit (GU) values from standard libraries. Quantify peaks based on relative fluorescence intensity.
Advanced Strategies for Sialylated Glycan Characterization
For detailed investigation of sialylation, the core HILIC protocol can be augmented with advanced techniques.
Linkage-Specific Sialic Acid Analysis via LC-Ion Mobility-MS (LC-IM-MS)
This method leverages ion mobility spectrometry to separate and identify sialic acid linkage isomers (α2,3 vs. α2,6) that are challenging to resolve by HILIC alone [68].
Workflow Enhancements:
- Procainamide (ProA) Labeling: Use ProA instead of 2-AB for enhanced fluorescence and ionization sensitivity, which improves MS detection of low-abundance species [66].
- LC-IM-MS Parameters:
- HILIC Column: Glycan BEH Amide column (150 mm × 2.1 mm, 1.7 µm).
- Ion Mobility: Utilize a Travelling Wave (TW) IM-MS instrument (e.g., Synapt G2-S). Sialic acid linkage isomers are distinguished based on characteristic fragmentation patterns and drift times in the ion mobility cell [68].
The strategic integration of ion mobility adds a powerful dimension for characterizing complex sialylation patterns.
Two-Dimensional Liquid Chromatography (2D-LC) for Comprehensive Profiling
For the most in-depth analysis, a 2D-LC approach provides unparalleled separation power. An offline 2D-LC method can be employed:
- 1st Dimension (Weak Anion Exchange, WAX): Separates released glycans based on their charge, which corresponds to the number of sialic acids [69].
- 2nd Dimension (HILIC): Further separates collected WAX fractions by size and overall hydrophilicity [69]. This workflow allows for the identification of over 200 N-glycan structures, including those with modifications like O-acetylation or sulfation [69].
Research Reagent Solutions
Table 2: Key reagents and materials for advanced glycan analysis.
| Reagent/Material | Function | Application Note |
|---|---|---|
| Protein G Monolithic Plate [24] | High-throughput, convective mass transport-based affinity purification of IgG from complex samples. | Enables rapid processing of hundreds of plasma samples with high recovery. |
| Procainamide (ProA) [66] | Fluorescent label offering 10-50x higher sensitivity than 2-AB for fluorescence and MS detection. | Critical for enhancing the signal of low-abundance sialylated glycans in UPLC and LC-MS workflows. |
| Full Glycome Internal Standard [60] | Isotope-labeled internal standard library covering the entire expected glycome for precise quantification. | Corrects for ionization suppression in MS, enabling absolute quantification and improving CV to <13%. |
| Sepharose CL-4B HILIC SPE [60] | Solid-phase extraction medium compatible with 96-well plates for high-throughput purification of labeled glycans. | Facilitates automated, high-throughput sample preparation for quality control environments. |
| Anion Exchange-HILIC (AXH) Column [66] | Combines separation by negative charge (sialylation) and hydrophilicity in a single dimension. | Efficient for identifying and quantifying sialylated and core-fucosylated N-glycans. |
The strategic combination of a robust HILIC-UPLC foundation with advanced mass spectrometry and ion mobility techniques provides a powerful toolkit for illuminating the complex world of low-abundance sialylated glycans. By implementing the detailed protocols and reagent strategies outlined herein, researchers can achieve the precise and reproducible analysis required to understand and control this critical quality attribute in therapeutic antibody development.
Benchmarking HILIC-UPLC: Validation, Comparison with CE and MS, and Real-World Applications
Within the biopharmaceutical industry, the glycosylation profile of therapeutic immunoglobulin G (IgG) is a critical quality attribute, influencing mechanisms of action such as antibody-dependent cellular cytotoxicity and complement-dependent cytotoxicity [45]. High-throughput, robust analytical methods are essential for monitoring these attributes during process development and manufacturing. Hydrophilic Interaction Liquid Chromatography coupled with Ultra-Performance Liquid Chromatography (HILIC-UPLC) has emerged as a leading platform for IgG N-glycan analysis due to its excellent precision, reproducibility, and high relative quantitative accuracy [71]. This application note details the experimental protocols and validation data for assessing the precision, accuracy, and linearity of a HILIC-UPLC method for IgG N-glycan profiling, providing a validated framework for researchers and drug development professionals.
Experimental Protocol
IgG Isolation from Plasma/Serum
The following protocol for IgG isolation using a protein G monolithic plate is adapted from established methodologies [71].
- Buffers and Solutions: Prepare fresh weekly using distilled water and filter through 0.2 µm PES filters.
- Binding Buffer: 1x Phosphate Buffered Saline (PBS), pH 7.4.
- Neutralizing Buffer: 10x PBS, pH 6.6-6.8.
- Elution Buffer: 0.1 M formic acid, pH 2.5.
- Neutralizing Solution for Eluent: 1 M ammonium bicarbonate.
- Storage Buffer: 20% ethanol, 20 mM Tris, 0.1 M NaCl, pH 7.4.
- Sample Preparation: Thaw frozen plasma or serum samples and centrifuge at 80 x g for 10 minutes. Transfer 100 µL of sample into a 2 mL collection plate. Dilute the sample with 1x PBS at a 1:7 (v/v) ratio.
- Filtration: Filter the diluted samples through a 0.45 µm hydrophilic polypropylene (GHP) filter plate into a clean collection plate using a vacuum pump (maintain pressure at 266.6-399.9 Pa).
- Protein G Plate Preparation: Condition the protein G monolithic plate by washing sequentially with 2 mL ultra-pure water, 2 mL 1x PBS, 1 mL 0.1 M formic acid, 2 mL 10x PBS, and 2 mL 1x PBS, using a vacuum pump to remove flowing liquid.
- IgG Binding and Washing: Apply the filtered samples to the conditioned protein G plate. Wash the plate with 2 mL of 1x PBS, repeating twice to remove unbound proteins.
- IgG Elution: Elute the captured IgG by adding 1 mL of 0.1 M formic acid to the plate and immediately collecting the eluate into a collection plate containing 170 µL of 1 M ammonium bicarbonate to neutralize the pH. Note: Rapid neutralization is critical to preserve the integrity of sialic acids on the glycans [71].
- Concentration Measurement: Determine the IgG concentration using an absorption spectrophotometer at 280 nm. The concentration (C) in µg/mL is calculated as: C_IgG = Absorbance × 13.7 × 1000.
- Drying and Storage: Transfer a volume of the extracted IgG (300-600 µL, adjusted based on concentration) to a drying oven at 60°C until dry. The dried IgG can be stored at -80°C.
N-Glycan Release, Labeling, and Purification
This section describes the enzymatic release of N-glycans and their fluorescent labeling with 2-aminobenzamide (2-AB) [71].
- Reagents:
- Denaturation Solution: 1.33% Sodium Dodecyl Sulfate (SDS).
- Non-Ionic Detergent: 4% Igepal CA-630 (store protected from light).
- Reaction Buffer: 5x PBS.
- Enzyme: Peptide-N-Glycosidase F (PNGase F). Reconstitute 250 U of enzyme with 250 µL of ultra-pure water.
- Labeling Solution: Prepare a fresh 2-AB labeling reagent for each sample by combining 0.70 mg 2-AB, 10.50 µL acetic acid, 6 mg sodium cyanoborohydride (NaBH₃CN), and 24.50 µL dimethyl sulfoxide (DMSO).
- IgG Denaturation: Resuspend the dried IgG pellet in 30 µL of 1.33% SDS. Vortex to mix and incubate at 65°C for 10 minutes. Allow the sample to cool at room temperature for 15 minutes. Add 10 µL of 4% Igepal and incubate on a shaking incubator for 5 minutes.
- Enzymatic Glycan Release: Add 20 µL of 5x PBS to the denatured IgG. Adjust the pH to approximately 8.0 using 30-35 µL of 0.1 M NaOH. Add 4 µL of the prepared PNGase F enzyme solution, vortex to mix, and incubate in a 37°C water bath for 18-20 hours.
- Glycan Drying: After incubation, dry the released glycans in an oven at 60°C for 2.5 to 3.0 hours.
- Fluorescent Labeling: Add 20 µL of the 2-AB labeling solution to the dried glycans. Vortex thoroughly and incubate at 65°C for 2 hours.
- Purification of Labeled Glycans: Purify the 2-AB-labeled glycans using HILIC solid-phase extraction. Load the labeling reaction mixture onto a 0.2 µm GHP filter plate. Wash with 1.5 mL of acetonitrile to remove excess unbound label. Elute the purified glycans with 500 µL of ultra-pure water into a 1.1 mL collection plate. The purified glycans are now ready for HILIC-UPLC analysis.
HILIC-UPLC Analysis of 2-AB-labeled N-Glycans
- Chromatography System: Acquity H-class UPLC system (Waters) consisting of a quaternary solvent manager, sample manager, and FLR fluorescence detector.
- Column: Waters BEH Glycan column (100 mm × 2.1 mm i.d., 1.7 µm BEH particles).
- Mobile Phase:
- Solvent A: 50 mM ammonium formate, pH 4.4.
- Solvent B: Acetonitrile.
- Gradient Program:
Time (min) Flow Rate (mL/min) % Solvent A % Solvent B Curve Initial 0.4 25 75 - 29.0 0.4 46 54 6 29.5 0.4 100 0 6 31.5 0.4 100 0 6 32.0 0.4 25 75 6 38.0 0.4 25 75 6 - Detection: Fluorescence detection with excitation and emission wavelengths of 330 nm and 420 nm, respectively.
- Sample Injection: Inject 5-10 µL of the purified glycan sample.
- System Suitability: The UPLC system should be calibrated with an external standard of hydrolyzed and 2-AB-labeled glucose oligomers to ensure proper performance [56].
The following workflow diagram summarizes the complete experimental procedure:
Validation Data
Precision and Accuracy
A comprehensive method comparison study analyzing a therapeutic antibody reference material demonstrated the high precision and accuracy of HILIC-UPLC and related separation techniques for Fc-glycosylation profiling [45]. The results are summarized below.
Table 1: Method Performance Data for Glycan Analysis (n=6 per method, over 2 days)
| Analytical Method | Key Performance Finding | Notes |
|---|---|---|
| HILIC-UPLC (2-AB) | Excellent precision and accuracy observed. | Used as the reference method in the study. |
| CE-LIF (APTS-HR1) | Excellent precision and accuracy observed. | - |
| DSA-FACE (APTS) | Excellent precision and accuracy observed. | High-throughput screening capability. |
| CE-LIF (APTS-HR2) | Excellent precision and accuracy observed. | Utilizes rapid (1-hour) labeling. |
| CCGE (ANTS) | Excellent precision and accuracy observed. | Designed for screening applications. |
| HPAEC-PAD | Excellent precision and accuracy observed. | Uses electrochemical detection of native glycans. |
For high-throughput methods, validation should assess long-term robustness. The between-day variation (a critical precision metric) can be evaluated by repeatedly analyzing a quality control sample over an extended period (e.g., 15-20 days) [56]. The between-analyst variation should also be tested to ensure method ruggedness. A well-optimized HILIC-UPLC method for IgG N-glycans demonstrates a coefficient of variation (CV) of less than 5% for major glycan peaks, which is essential for detecting biologically relevant changes [51] [56].
Linearity
Linearity is typically established by preparing and analyzing a series of samples with known, varying concentrations of the analyte. For glycan analysis, this can involve analyzing different amounts of a standardized IgG sample or labeled glycans.
- Acceptance Criteria: While acceptance criteria are laboratory-defined, a common approach for non-bioanalytical assays is to require back-calculated concentrations from the regression line to be within 100% ± 5% of the theoretical value at each calibration level, and within 100% ± 10% at the lower limit of quantitation (LLOQ) [72].
- Data Analysis: The linearity of a method can be inferred once precision, linearity, and specificity have been established, particularly for assay methods of drug substances as per ICH guidelines [72].
Table 2: Summary of Key Validation Parameters and Recommendations
| Parameter | Protocol Summary | Recommended Acceptance Criteria |
|---|---|---|
| Precision (Repeatability) | Analyze 6 replicates of a homogeneous sample on the same day. | CV < 5% for major glycan peaks [51]. |
| Intermediate Precision (Between-Day) | Analyze a quality control sample over 15-20 different days [56]. | CV < 5% for major glycan peaks. |
| Accuracy | Compare results with a well-characterized reference material or independent method [45] [72]. | No significant difference from reference value. |
| Linearity | Analyze a dilution series of IgG or purified glycans (min. 5 points). | R² > 0.99; Back-calculated values within 100% ± 5% [72]. |
The Scientist's Toolkit
Table 3: Essential Research Reagent Solutions for HILIC-UPLC IgG N-Glycan Analysis
| Item | Function | Critical Notes |
|---|---|---|
| Protein G Monolithic Plate | Affinity purification of IgG from plasma/serum. | Enables high-throughput, parallel processing of samples in a 96-well format [71]. |
| PNGase F Enzyme | Enzymatically releases N-linked glycans from the IgG backbone. | Critical for complete release; different recombinant sources should be evaluated for optimal activity [73]. |
| 2-Aminobenzamide (2-AB) | Fluorescent label for released glycans. | Enables sensitive fluorescence detection after HILIC separation. Labeling is performed via reductive amination [45] [71]. |
| HILIC (BEH Glycan) Column | Stationary phase for UPLC separation of labeled glycans. | Provides high-resolution separation of glycan structures based on their hydrophilicity [71]. |
| Ammonium Formate Buffer (pH 4.4) | Mobile phase additive for HILIC separation. | The acidic pH is crucial for achieving optimal chromatographic separation and peak shape [71]. |
Data Analysis and Quality Control
Robust data analysis and quality control are fundamental for high-throughput glycomics. The following practices are recommended:
- Quality Control: A quality control sample should be included in every analysis batch to monitor system performance and for between-batch normalization [56].
- Data Normalization: Glycan data are typically expressed as relative percentages (% of total integrated area). The total area normalization method improves comparability across samples [71].
- Automation and Error Reduction: Automated sample preparation using liquid-handling robotic workstations can significantly streamline the workflow, enhance throughput, and reduce human error, with studies showing high comparability to manual methods [51].
The relationship between key validation parameters and the stages of the analytical process is illustrated below:
Comparative Analysis with Capillary Electrophoresis and Mass Spectrometry Platforms
In the field of glycobiology, the analysis of immunoglobulin G (IgG) N-glycosylation is crucial for both biomedical research and the development of biopharmaceuticals. The glycosylation profile of IgG influences its effector functions, including antibody-dependent cellular cytotoxicity (ADCC) and complement-dependent cytotoxicity (CDC), and is associated with various disease states [13] [45]. While hydrophilic interaction liquid chromatography with ultra-performance liquid chromatography (HILIC-UPLC) has become a established method for IgG N-glycan profiling, capillary electrophoresis (CE) and mass spectrometry (MS) platforms offer complementary advantages in resolution, sensitivity, and throughput. This application note provides a detailed comparative analysis of these orthogonal analytical platforms, framing them within the context of a broader HILIC-UPLC protocol for IgG N-glycan analysis research, to guide researchers and drug development professionals in selecting appropriate methodologies for their specific needs.
Comparative Platform Performance
The following table summarizes the key performance metrics of major separation and detection platforms used in IgG N-glycan analysis:
Table 1: Performance Comparison of IgG N-glycan Analysis Platforms
| Analytical Platform | Detection Limit | Analysis Time | Key Advantages | Primary Applications |
|---|---|---|---|---|
| HILIC-UPLC | Not specified | ~25 min [7] | High robustness, excellent precision | High-throughput clinical profiling [13] [26] |
| HILIC/CGE 2D System | 12 pM (60 amol) [64] | Not specified | Exceptional resolution, sialic acid linkage differentiation | Discovery research for minor glycan species [64] |
| CE-ESI-MS | 20 amol injected [74] | Not specified | Structural information, sialic acid linkage specificity | In-depth structural characterization [74] |
| CGE-LIF (DNA Analyzer) | Attomole range [75] | High-throughput (up to 96 samples in parallel) [75] | Extremely high throughput, excellent sensitivity | Process monitoring, clone selection [76] |
| MALDI-TOF-MS with Internal Standards | Not specified | Hundreds of samples within minutes [60] | Rapid analysis, absolute quantification | Biopharmaceutical quality control [60] |
Experimental Protocols
HILIC-UPLC for IgG N-glycan Profiling
The HILIC-UPLC protocol serves as the foundational method for comparative analyses in this field. The following workflow details the standard procedure:
Table 2: Key Research Reagent Solutions for HILIC-UPLC
| Reagent/Equipment | Function | Specifications |
|---|---|---|
| Protein G Monolithic Plates | IgG isolation from serum/plasma | BIA Separations or equivalent [13] [26] |
| PNGase F Enzyme | Releases N-glycans from IgG | Waters GlycoWorks Rapid PNGase F or equivalent [77] |
| 2-Aminobenzamide (2-AB) | Fluorescent labeling of glycans | Sigma-Aldrich or equivalent [45] [26] |
| Waters Acquity UPLC H-class | Chromatographic separation | Equipped with FLR detector [7] |
| BEH Glycan Column | HILIC separation column | 100 × 2.1 mm i.d., 1.7 µm BEH particles [7] |
Protocol:
- IgG Isolation: Apply diluted plasma (50 µL diluted 10× with PBS, pH 7.4) to protein G monolithic plates. After washing, elute IgGs with 0.1 M formic acid and immediately neutralize with ammonium bicarbonate [26].
- N-glycan Release: Add PNGase F enzyme to the purified IgG and incubate to release N-glycans. Complete deglycosylation can be achieved in approximately 10 minutes using specialized kits with high enzyme concentration and elevated incubation temperature [77].
- Fluorescent Labeling: Label released glycans with 2-AB via reductive amination using a mixture containing 2-AB, dimethylsulfoxide, glacial acetic acid, and 2-picoline borane [26].
- HILIC-UPLC Analysis: Separate labeled glycans using a Waters Acquity UPLC system with a BEH Glycan column (100 × 2.1 mm i.d., 1.7 µm) maintained at 60°C. Employ a linear gradient from 75% to 62% acetonitrile over 25 minutes at 0.4 mL/min flow rate, with 100 mM ammonium formate (pH 4.4) as aqueous solvent [7].
- Data Processing: Integrate chromatograms into 24 peaks representing individual glycan traits. Calculate derived traits (e.g., galactosylation, sialylation, fucosylation) based on relative peak areas [7] [26].
Capillary Electrophoresis-Laser Induced Fluorescence (CE-LIF)
CE-LIF provides exceptional sensitivity and high-throughput capabilities:
Protocol:
- Glycan Release and Labeling: Release N-glycans with PNGase F and label with 8-aminopyrene-1,3,6-trisulfonic acid (APTS) via reductive amination [76] [75].
- Instrument Setup: Utilize a multi-capillary DNA analyzer (e.g., Applied Biosystems 3730xl) configured with LIF detection (excitation 488 nm, emission 520 nm) [76].
- Separation: Perform electrophoresis in gel-filled capillaries with suppressed electroosmotic flow. Separation is based on mass-to-charge ratio and hydrodynamic volume [75].
- Data Analysis: Identify peaks by comparison with APTS-labeled standards and express migration times in basepair units using an internal DNA ladder standard [76].
Mass Spectrometry Platforms
CE-ESI-MS for In-depth Characterization
Protocol:
- Linkage-Specific Sialic Acid Derivatization: Neutralize sialic acids through ethyl esterification of α2,6-linked sialic acids and amidation of α2,3-linked sialic acids in a one-pot, two-step reaction [74].
- Cationic Labeling: Introduce permanent positive charge to all glycans by labeling with Girard's reagent P (GirP) hydrazide at the reducing end [74].
- Sheathless CE-ESI-MS: Perform separation using capillary electrophoresis coupled to ESI-MS via a sheathless interface providing low-flow nano-ESI conditions (<10 nL/min) [74].
- Data Acquisition: Analyze samples in positive ion mode with dopant-enriched nitrogen gas to enhance ionization efficiency [74].
MALDI-TOF-MS with Internal Standards
Protocol:
- Rapid Glycan Release: Use high-throughput 96-well plate format for simultaneous processing of multiple samples. Denature glycoproteins with surfactant (e.g., RapiGest) at 95°C for 2 minutes, then incubate with PNGase F at 50°C for 5 minutes [77] [60].
- Internal Standard Preparation: Generate a full glycome internal standard library through reductive isotope labeling, creating glycans with 3 Da mass shift from native glycans [60].
- Purification: Employ Sepharose CL-4B HILIC solid-phase extraction in 96-well plates for clean-up [60].
- MALDI-TOF-MS Analysis: Spot samples on MALDI target plates and analyze using reflection positive ion mode. Quantify glycans by comparing signal intensities with corresponding internal standards [60].
Applications in Research and Biopharmaceutical Development
Clinical Biomarker Discovery
The HILIC-UPLC platform has demonstrated significant utility in clinical biomarker discovery. A nine-year prospective cohort study utilizing HILIC-UPLC analysis revealed that specific IgG N-glycan patterns could predict the long-term risk of ischemic stroke. Decreased levels of fucosylation and galactosylation were associated with an increased stroke risk, enabling the development of a prediction model with an area under the curve (AUC) of 0.756 [13]. This highlights the clinical relevance of IgG N-glycosylation profiling in chronic disease risk assessment.
Biopharmaceutical Quality Control
For therapeutic antibody development, monitoring Fc glycosylation is essential as it affects critical quality attributes including efficacy, stability, and safety [45] [60]. The high-throughput MALDI-TOF-MS method with internal standards provides quantitative glycan analysis with excellent repeatability (CV ~10%) and linearity (R² > 0.99) across a 75-fold concentration range, making it ideal for clone selection, process optimization, and batch-to-batch consistency testing [60].
In-depth Structural Characterization
The CE-ESI-MS platform enables comprehensive structural analysis of minor glycoforms from complex biological samples. This method allows detection of low attomole levels and identification of sialic acid linkage isomers, which is crucial for understanding biological processes such as cancer development [74]. With the ability to characterize 167 N-glycan compositions from just 0.1 nL of plasma, this approach provides unprecedented sensitivity for discovery research [74].
Integrated Analytical Strategy
For comprehensive IgG N-glycan analysis, an integrated approach leveraging the complementary strengths of each platform is recommended:
- Primary Screening: Utilize HILIC-UPLC for robust, high-throughput profiling of large sample sets in clinical and bioprocess applications [13] [7].
- High-Throughput Analysis: Implement CGE-LIF on DNA analyzers for process monitoring where rapid analysis of hundreds of samples is required [76] [75].
- Structural Elucidation: Apply CE-ESI-MS for in-depth characterization of sialic acid linkages and identification of low-abundance glycoforms in discovery research [74].
- Absolute Quantification: Employ MALDI-TOF-MS with internal standards for rapid, absolute quantification in biopharmaceutical quality control [60].
This multi-platform framework enables researchers to address diverse analytical needs throughout the drug development pipeline, from initial discovery to final product quality control, while maintaining alignment with the robust HILIC-UPLC methodology that forms the foundation of IgG N-glycosylation research.
Immunoglobulin G (IgG) N-glycosylation is a Critical Quality Attribute (CQA) for therapeutic antibodies and other biologic drugs, directly influencing efficacy, stability, and safety profiles [78]. The N-glycan profile attached to the Fc region at asparagine 297 modulates effector functions such as Antibody-Dependent Cellular Cytotoxicity (ADCC) and Complement-Dependent Cytotoxicity (CDC) [2] [79]. During bioprocess development, ensuring consistent glycan profiles is paramount. This application note details the use of a robust HILIC-UPLC protocol for IgG N-glycan analysis to support clone selection and batch consistency testing, providing a framework for quality control in biopharmaceutical development.
HILIC-UPLC-FLR Protocol for IgG N-Glycan Analysis
This section outlines a standardized, high-throughput protocol for the analysis of IgG N-glycans, optimized for reliability and scalability in a bioprocess development setting.
IgG Isolation and Purification
- Isolation Method: Isolate IgG from cell culture supernatant or purified drug substance using Protein G monolithic 96-well plates [56] [62]. This method ensures high specificity and is amenable to automation.
- Purification Steps: Transfer the IgG-bound beads to a filter plate. Wash with phosphate-buffered saline (PBS) and deionized water to remove contaminants [2]. Elute the purified IgG using 100 mM formic acid and immediately neutralize with 1 M ammonium bicarbonate [2] [62].
N-Glycan Release, Labeling, and Clean-up
The following steps prepare the glycans for chromatographic separation and detection.
- Denaturation and Release: Denature the isolated IgG with sodium dodecyl sulfate (SDS) at 65°C. Enzymatically release N-glycans using Peptide-N-Glycosidase F (PNGase F) [2]. For faster processing, Rapid PNGase F can complete release in approximately 10 minutes [78].
- Fluorescent Labeling: Label released glycans with a fluorescent tag for sensitive detection.
- Procainamide (ProA) Labeling: Incubate glycans with a procainamide mixture (in acetic acid/DMSO) at 65°C for 1 hour, followed by a reducing agent for 1.5 hours [2].
- Instant Labeling Kits: As an alternative, use "instant" labels like RapiFluor-MS or InstantPC, which react at room temperature in minutes, significantly accelerating sample preparation [78].
- Solid-Phase Extraction (SPE): Purify labeled glycans using hydrophilic interaction liquid chromatography (HILIC) solid-phase extraction in a 96-well format. Sepharose CL-4B HILIC plates offer excellent 96-well compatibility and high throughput, replacing traditional cartridge-based methods [60].
HILIC-UPLC Analysis
- Chromatography: Separate fluorescently labeled N-glycans using HILIC on a UPLC system equipped with a fluorescence (FLR) detector [2] [56].
- Column: Use a Waters BEH Glycan column (100 x 2.1 mm, 1.7 µm) for high-resolution separation [56].
- Data Processing: Integrate individual glycan peaks and express their abundance as a percentage of the total integrated area (% molar abundance) [62]. The system can be calibrated with an external standard of hydrolyzed and 2-AB-labeled glucose oligomers for retention time alignment [56].
Quantitative Method Performance and Application Data
The HILIC-UPLC-FLR method delivers the precision, linearity, and throughput required for rigorous bioprocess monitoring. The data below summarizes its performance in quantifying critical glycan attributes.
Table 1: Performance Characteristics of the HILIC-UPLC-FLR Glycan Analysis Method
| Performance Attribute | Result | Experimental Detail |
|---|---|---|
| Repeatability (CV) | 6.44% - 12.73% (Avg. 10.41%) | Analysis of 6 replicate trastuzumab samples in one day [60]. |
| Intermediate Precision (CV) | 8.93% - 12.83% (Avg. 10.78%) | Analysis of 12 trastuzumab samples over three different days [60]. |
| Linearity (R²) | > 0.99 (Average 0.9937) | 75-fold concentration gradient of glycan samples [60]. |
| Throughput | 192 samples per experiment | 96-well-plate compatibility with parallel processing [60]. |
Table 2: Key IgG N-Glycan Traits for Bioprocess Monitoring and Their Functional Impact
| Glycan Trait | Functionial Significance | Application in Bioprocess |
|---|---|---|
| Galactosylation | Modulates CDC and anti-inflammatory activity [62]. | Indicator of culture condition health and enzyme activity. |
| Fucosylation | Major impact on ADCC; low fucose enhances ADCC [79]. | Critical CQA for mAbs where enhanced effector function is desired. |
| Sialylation | Imparts anti-inflammatory properties [62]. | Monitor for consistency in biosimilars and process changes. |
| Bisecting GlcNAc | Can increase ADCC [79]. | Track for cell line engineering and clone screening. |
| High Mannose | Alters pharmacokinetics (clearance rate) [79]. | Key indicator for clone selection and harvest time. |
The Scientist's Toolkit: Essential Research Reagents
Table 3: Key Reagents and Kits for IgG N-Glycan Sample Preparation
| Reagent / Kit | Function / Application |
|---|---|
| Protein G Plates | High-throughput, affinity-based isolation of IgG from complex matrices [56] [62]. |
| PNGase F | Standard enzyme for releasing N-glycans from glycoproteins. Rapid PNGase F enables release in ~10 min [78]. |
| Procainamide (ProA) | Fluorescent label offering enhanced ionization for MS detection and sensitive FLR detection [2] [78]. |
| RapiFluor-MS | Rapid, "instant" fluorescent label enabling 2-D analysis (FLR and MS) with minimal sample preparation time [78]. |
| Sepharose CL-4B HILIC Plates | 96-well compatible solid-phase extraction medium for purifying and enriching labeled glycans [60]. |
| Exoglycosidase Kits | Enzyme mixtures for detailed glycan sequencing and structural confirmation via tandem MS [80]. |
Experimental Workflow for Bioprocess Applications
The logical progression of experiments from early to late-stage development is outlined below, linking analytical data to key bioprocessing decisions.
Application 1: High-Throughput Clone Selection
- Objective: Screen hundreds of cell clones to identify those producing IgG with the desired glycosylation profile, such as low fucosylation for enhanced ADCC activity [60].
- Protocol:
- Culture Clones: Grow candidate clones in 96-deep well plates under standardized conditions.
- Harvest and Isolate IgG: Clarify culture supernatants by centrifugation. Isolate IgG directly from the supernatant using a protein G 96-well plate.
- Parallel Glycan Processing: Execute the HILIC-UPLC protocol outlined in Section 2 in a 96-well format.
- Data-Driven Selection: Calculate the percentage of afucosylated glycans for each clone. Prioritize clones exhibiting both high titers and the desired glycan phenotype for scale-up.
Application 2: Batch Consistency and Biosimilarity Testing
- Objective: Demonstrate manufacturing consistency by comparing glycan profiles across multiple production batches, or demonstrate analytical biosimilarity to a reference product [60] [78].
- Protocol:
- Analyze Reference and Test Batches: Process the reference biologic and multiple test batches (or biosimilar candidate batches) simultaneously on the same 96-well plate to minimize batch effects [56].
- Comprehensive Profile Comparison: Quantify all 24 peak areas and calculate derived traits (e.g., fucosylation, galactosylation, sialylation) [62].
- Statistical Comparison: Use multivariate statistical analysis (e.g., PCA) to visually cluster batches and confirm that test batch profiles are within pre-defined acceptance criteria relative to the reference.
- Stability Monitoring: Apply the method to monitor glycan profile stability of the drug substance and product over time as part of shelf-life studies [60].
The HILIC-UPLC-FLR protocol provides a robust, high-throughput solution for quantifying IgG N-glycans, directly addressing the critical needs of clone selection and batch consistency testing in bioprocess development. The method's high precision and compatibility with automation make it an indispensable tool for ensuring the quality, efficacy, and consistency of therapeutic antibodies and other glycoprotein biologics throughout their development and commercial lifecycle.
Population Glycomics Studies Revealing Age and Sex-Associated Patterns
The analysis of immunoglobulin G (IgG) N-glycosylation has emerged as a critical tool for understanding biological aging and disease. Glycosylation, the most common post-translational modification of proteins, modulates the effector functions of IgG and is involved in disease development and progression [2]. Population-based glycomics studies have consistently demonstrated that the serum N-glycome changes with ageing, showing significant sexual dimorphism [81]. These changes are compatible with the concept of "inflammaging" – unhealthy inflammatory aging – suggesting that glycosylation patterns could serve as both a marker of biological age and a factor in the pathological aging process [81]. The N-glycome profile in serum is both gender and age dependent, a crucial consideration in the development of serum glycome markers [82]. This application note details standardized protocols for IgG N-glycan analysis using HILIC-UPLC technology, enabling robust population studies investigating these age and sex-associated patterns.
Experimental Protocols
IgG Isolation from Plasma/Serum
Principle: Immunoglobulin G is selectively captured from biological matrices using protein G-based affinity purification, ensuring specific isolation for subsequent glycan analysis [83] [2].
Detailed Procedure:
- Sample Preparation: Dilute 100 μL of plasma or serum sample with 700 μL of 1× phosphate-buffered saline (PBS) in a 96-well plate [51].
- Affinity Capture: Add 20 μL of Protein G Agarose Fast Flow beads to each well containing diluted sample [2].
- Incubation: Seal the plate and incubate for 2 hours at room temperature with continuous shaking at 800 rpm to facilitate IgG binding [2].
- Washing: Using a vacuum manifold, wash the IgG-bound beads three times with 200 μL PBS followed by three washes with 200 μL deionized water to remove non-specifically bound contaminants [2].
- Elution: Elute purified IgG from the beads by incubating with 100 mM formic acid for 15 minutes at room temperature. Collect the eluate by centrifugation into a PCR plate containing 17 μL of 1 M ammonium bicarbonate for neutralization [2].
- Preparation for Deglycosylation: Transfer 50 μL of the neutralized eluate to a new plate and dry completely for 2 hours at 37°C in a vacuum centrifuge [2].
Technical Notes:
- For saliva samples (IgG concentration ~0.014 mg/mL), use larger starting volumes (0.5-5 mL) to ensure sufficient IgG yield [2].
- Automated IgG isolation can be performed using liquid-handling robotic workstations (e.g., Tecan Freedom Evo 200) to enhance throughput and reproducibility [51].
N-Glycan Release, Labeling, and Cleanup
Principle: N-glycans are enzymatically released from the purified IgG protein, fluorescently labeled to enable detection, and purified to remove excess reagents and contaminants [84] [17].
RapiFluor-MS Labeling Method (Rapid Protocol)
Procedure:
- Denaturation: Reconstitute dried IgG samples in 20 μL of RapiGest SF surfactant solution to denature the protein [84] [17].
- Enzymatic Release: Add 2 μL of Rapid PNGase F to each sample and incubate for 10 minutes at room temperature to release N-glycans as glycosylamines [84].
- Labeling: Add 25 μL of RapiFluor-MS labeling reagent to the reaction mixture and incubate for 5 minutes at room temperature. The reagent rapidly reacts with glycosylamines via NHS carbamate chemistry [84].
- Cleanup: Purify labeled glycans using a HILIC μElution SPE plate:
- Condition the plate with 200 μL water.
- Equilibrate with 200 μL of 85% acetonitrile.
- Load sample diluted in 85% acetonitrile.
- Wash with 200 μL of 85% acetonitrile.
- Elute glycans with 100 μL of 50 mM ammonium formate, pH 4.4 [84].
Advantages: Complete sample preparation in approximately 30 minutes with enhanced fluorescence and MS sensitivity [84].
2-Aminobenzamide (2-AB) Labeling Method (Conventional Protocol)
Procedure:
- Denaturation and Reduction: Dissolve IgG in 1% Rapigest surfactant with 5 mM DTT and incubate for 30 minutes at 60°C [17].
- Alkylation: Add 10 mM iodoacetamide and incubate for 30 minutes in the dark at room temperature [17].
- Enzymatic Release: Add PNGase F (1.91 U/mL) and incubate for 18 hours at 37°C to release N-glycans [17].
- Purification: Purify released glycans using HILIC-SPE μElution plate with washing (90% ACN) and elution (1 mM Ammonium Tris Citrate in 10% ACN) [17].
- Labeling: Incubate glycans with 2-AB dye in 30% acetic acid/DMSO at 65°C for 3 hours in the dark [17].
- Cleanup: Remove excess dye using a second HILIC-SPE procedure [17].
Considerations: This traditional method requires longer processing time (~24 hours) but is well-established and widely used [17].
HILIC-UPLC Analysis of Labeled N-Glycans
Principle: Fluorescently labeled N-glycans are separated by hydrophilic interaction liquid chromatography (HILIC) based on their polarity and detected by fluorescence and mass spectrometry [84] [7].
Standard Chromatographic Conditions:
| Parameter | Specification |
|---|---|
| LC System | Waters Acquity UPLC H-class |
| Column | BEH Glycan, 100 × 2.1 mm i.d., 1.7 μm BEH particles |
| Column Temperature | 60°C |
| Mobile Phase A | 50 mM ammonium formate, pH 4.4 |
| Mobile Phase B | Acetonitrile (LC-MS grade) |
| Flow Rate | 0.4 mL/min |
| Fluorescence Detection | RapiFluor-MS: Ex 265/Em 425 nm2-AB: Ex 330/Em 420 nm |
| Injection Volume | ≤1 μL (aqueous) or ≤30 μL (organic) |
Separation Gradient for 100 mm Column:
| Time (min) | %A | %B | Curve |
|---|---|---|---|
| 0.0 | 25 | 75 | 6 |
| 25.0 | 38 | 62 | 6 |
| 25.1 | 100 | 0 | 6 |
| 28.0 | 100 | 0 | 6 |
| 28.1 | 25 | 75 | 6 |
| 33.0 | 25 | 75 | 6 |
Data Processing:
- Process chromatograms to integrate individual glycan peaks (typically 24 peaks for IgG) [7] [83].
- Express the amount of glycans in each peak as a percentage of the total integrated area (relative quantitation) [83].
- Apply batch effect correction using tools such as ComBat (R-package sva) [83].
- Calculate derived glycan traits based on structural similarities (e.g., galactosylation, sialylation, fucosylation) [83].
Key Research Findings: Age and Sex-Associated Patterns
Large-scale population studies have revealed consistent patterns in IgG N-glycosylation associated with age and sex:
Table: Age-Associated Changes in Serum N-Glycome
| Glycan Feature | Change with Aging | Functional Significance |
|---|---|---|
| Biantennary digalactosylated | Decrease [81] | Associated with anti-inflammatory activity [81] |
| Agalactosylated | Increase [81] | Pro-inflammatory; associated with unhealthy aging [81] |
| Bisected glycan GP3 (F(6)A2B) | Downregulation [85] | Potential biomarker for biological age prediction [85] |
| Digalactosylated glycan GP8 (F(6)A2G2) | Upregulation [85] | Potential biomarker for biological age prediction [85] |
| Core-α-1,6-fucosylation | Higher in women [82] | Sex-specific fucosylation pattern |
| Branching-α-1,3-fucosylation | Higher in men [82] | Sex-specific fucosylation pattern |
Table: Characteristics of Age and Sex-Associated N-Glycan Clusters
| Cluster Characteristic | Simple N-Glycans Cluster | Complex N-Glycans Cluster |
|---|---|---|
| Age Association | Older individuals [81] | Younger individuals [81] |
| Metabolic Profile | Higher glucose, glycation markers [81] | Healthier metabolic parameters [81] |
| Inflammation Status | Elevated inflammatory markers [81] | Lower inflammatory status [81] |
| Renal Function | Lower glomerular filtration rate [81] | Better renal function [81] |
| Comorbidity Burden | Higher comorbidity index [81] | Lower comorbidity burden [81] |
Biological Significance
The observed changes in IgG N-glycosylation patterns with age and between sexes have significant biological implications:
Inflammaging Hypothesis: The shift toward agalactosylated and simpler N-glycan structures in older adults supports the concept of chronic, low-grade inflammation in aging, which may contribute to age-related morbidity [81].
Sexual Dimorphism: Significant differences in fucosylation patterns between men and women suggest hormonal or genetic regulation of glycosylation enzymes that may underlie sex differences in immune function and disease susceptibility [82].
Biological Age Prediction: The consistent changes in specific glycans (e.g., GP3 and GP8) enable the development of predictive models for biological aging (e.g., abGlycoAge index), which may be more accurate than chronological age for assessing health status [85].
Experimental Workflow
The following diagram illustrates the complete experimental workflow for IgG N-glycan analysis in population studies:
IgG N-Glycan Analysis Workflow
The Scientist's Toolkit: Essential Research Reagents and Materials
Table: Key Research Reagent Solutions for IgG N-Glycan Analysis
| Reagent/Material | Function | Application Notes |
|---|---|---|
| Protein G Agarose Beads | IgG affinity purification | Compatible with plasma, serum, and saliva samples; suitable for automation [2] |
| RapiFluor-MS Labeling Kit | Rapid fluorescence and MS-active labeling | Enables complete sample prep in 30 min; significantly enhances MS sensitivity [84] |
| 2-Aminobenzamide (2-AB) | Conventional fluorescent labeling | Established protocol; requires longer processing time (~24 h) [17] |
| Procainamide (ProA) | Fluorescent labeling alternative | Used as 2-AB alternative; provides good sensitivity [2] |
| PNGase F | Enzymatic N-glycan release | Essential for cleaving N-glycans from protein backbone; available in rapid and standard formulations [84] [17] |
| HILIC μElution Plates | Solid-phase extraction clean-up | Provides quantitative recovery of neutral to tetrasialylated glycans [84] |
| BEH Glycan UPLC Column | HILIC separation of labeled glycans | 1.7 μm particles, 100-150 × 2.1 mm dimensions; enables high-resolution separation [84] [7] |
| Automated Liquid Handling | High-throughput sample processing | Systems like Tecan Freedom Evo 200 improve reproducibility and throughput [51] |
Technical Considerations for Population Studies
Sample Quality and Stability
- Plasma/Serum: IgG N-glycosylation profiles remain stable when biological matrices are stored under appropriate frozen conditions [2].
- Saliva: Salivary IgG N-glycans demonstrate stability across various storage temperatures (-80°C to 50°C) for up to 15 days, supporting the use of saliva as a less-invasive alternative [2].
- Pre-analytical Variables: Standardize collection protocols, fasting status, and processing methods to minimize technical variability in population studies.
Data Normalization and Batch Effects
- Implement robust normalization procedures to address the compositional nature of glycan data (relative percentages summing to 100%) [81] [83].
- Apply batch effect correction algorithms (e.g., ComBat) when processing large sample sets across multiple analysis batches [83].
- Include quality control samples and blanks in each processing batch to monitor technical performance [51].
The standardized protocols for IgG N-glycan analysis using HILIC-UPLC technology presented in this application note provide a robust framework for population glycomics studies. The consistent observations of age and sex-associated patterns in IgG N-glycosylation across multiple studies highlight the importance of considering these biological variables in clinical and epidemiological research. The implementation of automated methods and sensitive labeling techniques, such as RapiFluor-MS, further enhances the throughput and precision of these analyses, enabling larger-scale population studies. As research in this field advances, IgG N-glycan profiling shows promise as a valuable tool for assessing biological age, understanding sex-specific disease risks, and identifying biomarkers for healthy aging.
Validation of Saliva as a Non-Invasive Alternative to Plasma for IgG Glycan Analysis
Immunoglobulin G (IgG) glycosylation is a critical post-translational modification that modulates antibody effector functions, influencing immune responses in health and disease [2] [86]. While plasma has traditionally been the primary matrix for IgG glycan analysis, saliva presents a compelling non-invasive alternative with significant practical advantages for clinical monitoring and large-scale studies [2] [87]. This application note validates a comprehensive protocol for salivary IgG N-glycan analysis using hydrophilic interaction liquid chromatography with ultra-performance liquid chromatography and fluorescence detection (HILIC-UHPLC-FLR), establishing its comparability to plasma-based profiling.
Saliva collection is minimally invasive, requires no specialized training, and poses reduced infection risks compared to blood draws [2] [87]. However, the major analytical challenge stems from the substantially lower IgG concentration in saliva (approximately 0.014 mg/mL) compared to plasma (approximately 12.5 mg/mL) [2] [87]. The methodology detailed herein overcomes this limitation through optimized immunopurification and sensitive detection strategies, enabling reliable glycan profiling from saliva specimens.
Comparative Analysis of Salivary and Plasma IgG N-Glycans
Technical and Practical Considerations
Table 1: Comparison of Saliva and Plasma as Matrices for IgG Glycan Analysis
| Parameter | Saliva | Plasma |
|---|---|---|
| Collection Method | Non-invasive (unstimulated drooling) | Invasive (venipuncture) |
| Sample Collection Requirements | No specialized equipment; can be self-collected | Requires trained phlebotomist, needles, vacutainers |
| Infectious Risk | Lower | Higher |
| Approximate IgG Concentration | 0.014 mg/mL [87] | 12.5 mg/mL [87] |
| Sample Preprocessing | Centrifugation to reduce viscosity [87] | Centrifugation for plasma separation [2] |
| Primary Analytical Challenge | Low antibody concentration requires sensitive detection methods [2] | Sufficient antibody concentration, but requires specific storage/shipping conditions [2] |
| Stability Considerations | Stable under various storage conditions; preservation media available [2] | Requires specific and costly storage/shipping conditions [2] |
Glycosylation Profile Comparisons
Multiple studies have demonstrated that while salivary IgG N-glycan profiles are largely comparable to those from plasma, consistent minor differences exist, highlighting the importance of establishing saliva-specific baseline values.
Table 2: Key Glycosylation Differences Between Saliva and Plasma IgG
| Glycosylation Feature | Comparison (Saliva vs. Plasma) | References |
|---|---|---|
| Galactosylation | Slightly lower in saliva | [87] |
| Sialylation | Slightly lower in saliva | [87] |
| Core Fucosylation | Similar levels observed (~90%) | [86] |
| Bisecting GlcNAc | Comparable levels | [86] |
| Overall Profile | Highly similar with minor but consistent differences | [2] [87] |
Experimental Protocols
Sample Collection and Preprocessing
Saliva Collection Protocol:
- Instruct donors to rinse their mouths with water one hour prior to collection and abstain from eating or drinking during collection [2] [87].
- Collect unstimulated whole saliva by passive drooling into a 15-mL Falcon tube for 30-60 minutes [2].
- Immediately place samples on ice after collection [2].
- Centrifuge saliva at 10,000 × g for 30 minutes at 4°C to reduce viscosity and remove debris [2] [87].
- Collect the clear supernatant for IgG purification or store at -80°C with/without preservation medium for stability studies [2].
Plasma Collection Protocol:
- Collect peripheral blood in EDTA-containing vacutainers.
- Allow blood to settle at room temperature for 1 hour [2].
- Centrifuge at 2,700 × g for 10 minutes [2].
- Collect the clear upper plasma fraction.
- For IgG purification, dilute 30 μL plasma in 4 mL phosphate-buffered saline (PBS) [2].
IgG Purification from Saliva
Bead-Based Immunoprecipitation Protocol:
- Transfer 0.5-5.0 mL of saliva supernatant or diluted plasma to a 2-5 mL Eppendorf tube [2].
- Add 20 μL of Protein G Agarose Fast Flow beads to the sample [2].
- Incubate for 2 hours at 800 rpm on a plate shaker to facilitate IgG binding [2].
- Centrifuge briefly and discard the supernatant.
- Transfer the bead slurry to a 96-well filter plate (10-μm pore size) [2].
- Wash beads three times with 200 μL PBS followed by three times with 200 μL deionized water using a vacuum manifold [2].
- Elute IgG by incubating beads with 100 mM formic acid for 15 minutes at room temperature [2].
- Collect the eluate by centrifugation into a PCR plate containing 17 μL of 1 M ammonium bicarbonate for neutralization [2].
- Dry 50 μL of the eluted IgG samples for 2 hours at 37°C in a vacuum centrifuge [2].
N-Glycan Release, Labeling, and Cleanup
Procainamide Labeling Protocol:
- Denature dried IgG with sodium dodecyl sulfate (SDS) and incubate at 65°C [2].
- Enzymatically release N-glycans using PNGase F [2].
- Add 25 μL of procainamide labeling mixture (4.32 mg procainamide hydrochloride in glacial acetic acid/dimethyl sulfoxide, 30:70) per sample [2].
- Incubate at 65°C for 1 hour [2].
- Add 25 μL of reducing agent solution (4.48 mg 2-picoline borane in glacial acetic acid/dimethyl sulfoxide, 30:70) per sample [2].
- Incubate at 65°C for an additional 1.5 hours [2].
- Purify labeled glycans using solid-phase extraction, such as Sepharose CL-4B HILIC in 96-well plates [60].
HILIC-UHPLC-FLR Analysis
Chromatographic Conditions:
- Column: BEH Amide, 1.7 μm particle size, or equivalent HILIC column
- Mobile Phase A: 50 mM ammonium formate, pH 4.4
- Mobile Phase B: Acetonitrile
- Gradient: Optimized linear gradient from high to low organic content
- Flow Rate: 0.2-0.5 mL/min
- Temperature: 40-60°C
- Detection: Fluorescence (Excitation: 310 nm, Emission: 370 nm for procainamide-labeled glycans)
Data Analysis:
- Identify glycan peaks based on retention time compared to external standards or glucose unit values.
- Integrate peak areas and calculate relative percentages of individual glycan structures.
- Group glycans into structural classes (agalactosylated, monogalactosylated, digalactosylated, sialylated, etc.) for biological interpretation.
Workflow Visualization
Figure 1: Comprehensive workflow for IgG N-glycan analysis from saliva and plasma samples
Stability and Method Validation
Salivary IgG Storage Stability
Table 3: Stability of Salivary IgG N-glycans Under Different Storage Conditions
| Storage Condition | Duration Tested | Impact on IgG N-glycan Profile | Recommendations |
|---|---|---|---|
| -80°C | Up to 15 days | No dramatic changes observed [2] | Long-term storage recommended |
| -20°C | Up to 15 days | Stable profile maintained [2] | Acceptable for medium-term storage |
| 4°C | Up to 15 days | Generally stable [2] | Short-term storage (days) |
| Room Temperature | Up to 15 days | Moderate stability [2] | Process within 24 hours |
| 37°C | Up to 15 days | Potential alterations [2] | Avoid prolonged exposure |
| 50°C | Up to 15 days | Significant degradation likely [2] | Strictly avoid |
| With Preservation Medium | Up to 15 days | Enhanced stability [2] | Recommended for biobanking |
Analytical Method Validation
Recent advancements in automation have significantly improved the precision and throughput of IgG glycan analysis. Automated sample preparation methods using liquid-handling robotic workstations have demonstrated satisfactory precision, with coefficients of variation (CV) for glycan peaks typically below 5% for the majority of measured glycans [51]. These automated methods reduce analyst intervention, minimize human error, and enhance laboratory safety while maintaining high comparability to manual methods [51].
Research Reagent Solutions
Table 4: Essential Reagents and Materials for Salivary IgG N-glycan Analysis
| Reagent/Material | Function | Example Specifications |
|---|---|---|
| Protein G Agarose Beads | IgG affinity purification | Fast Flow, 20 μL per 5 mL saliva [2] |
| PNGase F | Enzymatic release of N-glycans | Recombinant, glycosidase [2] |
| Procainamide Hydrochloride | Fluorescent glycan labeling | 4.32 mg in acetic acid/DMSO [2] |
| 2-Picoline Borane | Reducing agent for labeling | 4.48 mg in acetic acid/DMSO [2] |
| HILIC UHPLC Column | Glycan separation | BEH Amide, 1.7 μm [2] |
| Ammonium Formate | Mobile phase buffer | 50 mM, pH 4.4 [2] |
| Preservation Medium | Sample stabilization | For saliva biobanking [2] |
| 96-Well Filter Plates | High-throughput processing | 10-μm pore size [2] |
Applications in Clinical Research
The validation of salivary IgG glycan analysis enables novel applications in disease biomarker discovery and monitoring. Recent research has demonstrated that salivary glycosylation patterns show significant alterations in autoimmune conditions such as bullous pemphigoid, where specific glycosylation changes in saliva proteins correlated with disease severity [88] [89]. These findings highlight the potential of salivary glycan biomarkers as non-invasive diagnostic and monitoring tools.
Salivary IgG N-glycan profiling is particularly valuable for:
- Pediatric and geriatric studies where repeated blood draws are challenging
- Large-scale epidemiological studies requiring cost-effective sampling
- Longitudinal monitoring of therapeutic interventions
- Point-of-care testing development for rapid disease screening
This application note establishes that saliva represents a valid and reliable alternative to plasma for IgG N-glycan analysis when using optimized HILIC-UHPLC-FLR methodologies. The detailed protocols and validation data provided herein enable researchers to implement salivary IgG glycomics in diverse research settings, expanding the possibilities for non-invasive immune monitoring and biomarker discovery.
Conclusion
HILIC-UPLC has firmly established itself as a robust, reproducible, and high-throughput platform for the detailed analysis of IgG N-glycosylation. Its superior performance, characterized by excellent precision and the ability to resolve complex glycan mixtures, makes it indispensable for both biopharmaceutical quality control and large-scale clinical research. The methodology enables the reliable detection of biologically critical, albeit minor, glycan species such as sialylated structures, which are essential for understanding antibody function. Future directions point toward increased automation, integration with mass spectrometry for definitive structural identification, and the expanded use of non-invasive sample matrices like saliva. As the field of glycomics continues to evolve, HILIC-UPLC will remain a cornerstone technique for unraveling the biological and clinical significance of the IgG glycome, driving advancements in personalized medicine and the development of next-generation biotherapeutics.
References
- 1. Impact of structural modifications of IgG antibodies on ... [https://www.frontiersin.org/journals/immunology/articles/10.3389/fimmu.2023.1304365/full]
- 2. Storage stability and HILIC-UHPLC-FLR analysis of ... [https://pmc.ncbi.nlm.nih.gov/articles/PMC10101819/]
- 3. IgG Fc Glycosylation in Human Immunity - PMC [https://pmc.ncbi.nlm.nih.gov/articles/PMC7853246/]
- 4. The impact of Fc glycosylation on IgG susceptibility to hinge ... [https://pmc.ncbi.nlm.nih.gov/articles/PMC12246625/]
- 5. Multivariate quantitative analysis of glycan impact on IgG1 ... [https://pmc.ncbi.nlm.nih.gov/articles/PMC11587841/]
- 6. High-Throughput Analysis of the IgG N-Glycome by UPLC- ... [https://pubmed.ncbi.nlm.nih.gov/27743356/]
- 7. HILIC-UPLC analysis of fluorescently labelled N-glycans [https://bio-protocol.org/exchange/minidetail?id=7412894&type=30]
- 8. Immunoglobulin G N-glycan Biomarkers for Autoimmune ... [https://pmc.ncbi.nlm.nih.gov/articles/PMC9100869/]
- 9. IgG N-glycan Signatures as Potential Diagnostic and ... [https://pmc.ncbi.nlm.nih.gov/articles/PMC10047871/]
- 10. Antibody Glycosylation in Autoimmune Diseases - PMC [https://pmc.ncbi.nlm.nih.gov/articles/PMC8058319/]
- 11. Causal link between immunoglobulin G glycosylation and ... [https://www.sciencedirect.com/science/article/abs/pii/S0008874921000010]
- 12. The importance of IgG glycosylation—What did we learn after ... [https://pmc.ncbi.nlm.nih.gov/articles/PMC11659926/]
- 13. Immunoglobulin G N-glycosylation predicts long-term risk of ... [https://pmc.ncbi.nlm.nih.gov/articles/PMC12557912/]
- 14. HILIC-UPLC-MS for high throughput and isomeric N-glycan ... [https://pubmed.ncbi.nlm.nih.gov/32915358/]
- 15. High sensitivity profiling of N-glycans from mouse serum ... [https://www.sciencedirect.com/science/article/pii/S0144861724006751]
- 16. N-Glycosylation of monoclonal antibody therapeutics [https://www.sciencedirect.com/science/article/abs/pii/S0003267022003993]
- 17. Quantitative N-Glycan Profiling of Therapeutic Monoclonal ... [https://pmc.ncbi.nlm.nih.gov/articles/PMC8617915/]
- 18. Assessing the Heterogeneity of the Fc-Glycan of a ... [https://www.nature.com/articles/s41598-018-22199-8]
- 19. Global variability of the human IgG glycome - PMC [https://pmc.ncbi.nlm.nih.gov/articles/PMC7467356/]
- 20. A Systematic Approach to Glycan Analysis using HILIC ... [https://www.waters.com/nextgen/at/de/library/application-notes/2012/systematic-approach-glycan-analysis-hilic-uplc-online-database-standardized-values.html?srsltid=AfmBOorogk3cViga1YXHLe9b8WeRxZ_aINRH76JL1Euf5QwcYf82LKFN]
- 21. N-glycosylation heterogeneity and the influence on ... [https://www.sciencedirect.com/science/article/pii/S0939641116000163]
- 22. Glycan Analysis - HILIC Glycan Profiling [https://www.ludger.com/glycan-analysis-services/hilic-glycan-profiling.php]
- 23. Enhanced N-Glycan Profiling of Therapeutic Monoclonal ... [https://pmc.ncbi.nlm.nih.gov/articles/PMC11348383/]
- 24. High Throughput Isolation and Glycosylation Analysis of IgG–Variability and Heritability of the IgG Glycome in Three Isolated Human Populations - PMC [https://pmc.ncbi.nlm.nih.gov/articles/PMC3205872/]
- 25. IgG Antibody Purification with HiTrap® Protein G HP ... [https://www.sigmaaldrich.com/US/en/technical-documents/technical-article/protein-biology/protein-purification/performing-purification-hitrap-protein-g-hp-columns?srsltid=AfmBOooHH-kjRLLyQuTYXeXGs0GoIfUMB_oCLC3OBW292oA71tNDNt93]
- 26. IgG N-glycans analysis [https://bio-protocol.org/exchange/minidetail?id=3433716&type=30]
- 27. High throughput isolation and glycosylation analysis of IgG-variability and heritability of the IgG glycome in three isolated human populations - PubMed [https://pubmed.ncbi.nlm.nih.gov/21653738/]
- 28. PNGase F [https://www.neb.com/en-us/products/p0704-pngase-f?srsltid=AfmBOoo7YcU1prCnR3DvSOFW7vfpfpEoGviblxVkiQPI9UsAkpoMusk-]
- 29. PNGase F Protocol (Denaturing Conditions) [https://www.protocols.io/view/pngase-f-protocol-denaturing-conditions-bikhkct6.html]
- 30. Extensive weight loss reduces glycan age by altering IgG N ... [https://www.nature.com/articles/s41366-021-00816-3]
- 31. N-Glycan Profiling [https://aspariaglycomics.com/analysis/n-glycan-profiling/]
- 32. Storage stability and HILIC-UHPLC-FLR analysis of ... [https://link.springer.com/article/10.1007/s00216-023-04682-y]
- 33. Comparison of 2-Aminobenzamide, Procainamide and ... [https://pubmed.ncbi.nlm.nih.gov/30094234/]
- 34. Comparison of procainamide and 2-aminobenzamide ... [https://www.sciencedirect.com/science/article/abs/pii/S0003269715002985]
- 35. Protocol for HILIC-UPLC Analysis of Brain Tissue N -Glycans [https://www.creative-proteomics.com/resource/protocol-for-hilic-uplc-analysis-of-brain-tissue-n-glycans.htm]
- 36. HILIC-UPLC Analysis of Brain Tissue N-Glycans [https://pubmed.ncbi.nlm.nih.gov/27743369/]
- 37. Comparison of Four Rapid N-Glycan Analytical Methods ... [https://www.mdpi.com/2076-3417/14/16/7320]
- 38. Hydrophilic-Interaction Chromatography: An Update [https://www.chromatographyonline.com/view/hydrophilic-interaction-chromatography-update]
- 39. Leveraging Analytical Quality by Design Principles for ... [https://www.waters.com/nextgen/us/en/library/application-notes/2025/leveraging-analytical-quality-by-design-principles-for-efficient-development-of-a-targeted-assay-method-for-routine-monitoring-of-mannose-5-glycans-using-fluorescence-detection.html?srsltid=AfmBOopJ6s5wj6djbxNAdZTlV6QQ1fkPxpc2ojeDSLGA8gXFOw9Hpj3V]
- 40. Development and application of a robust N-glycan profiling ... [https://pubmed.ncbi.nlm.nih.gov/24840237/]
- 41. Increased Resolving Power for Acidic Glycans with an MS- ... [https://www.waters.com/nextgen/us/en/library/application-notes/2020/increased-resolving-power-for-acidic-glycans-with-an-ms-compatible-anion-exchange-reversed-phase-separation.html?srsltid=AfmBOopSUSrWKzRcJBC1PhGgaJCZtmjvN5zCcMEPq6yWmjcx8iy62A1y]
- 42. More comprehensive standards for monitoring glycosylation [https://www.sciencedirect.com/science/article/pii/S0003269720304280]
- 43. High-selectivity profiling of released and labeled N-glycans ... [https://pmc.ncbi.nlm.nih.gov/articles/PMC6338698/]
- 44. Immunoglobulin G N-Glycosylation and Inflammatory Factors [https://pmc.ncbi.nlm.nih.gov/articles/PMC12036608/]
- 45. Comparison of methods for the analysis of therapeutic ... [https://pmc.ncbi.nlm.nih.gov/articles/PMC4623496/]
- 46. GlycoDash: automated, visually assisted curation of ... [https://pmc.ncbi.nlm.nih.gov/articles/PMC11961463/]
- 47. GlycoGenius: a streamlined high-throughput glycan ... [https://www.nature.com/articles/s41467-025-65265-2]
- 48. Fragmentation stability and retention time-shift obtained by ... [https://pmc.ncbi.nlm.nih.gov/articles/PMC10124117/]
- 49. Sialic acid O-acetylation patterns and glycosidic linkage ... [https://www.nature.com/articles/s41467-023-42575-x]
- 50. Optimizing HPLC/UHPLC Systems [https://www.ssi.shimadzu.com/service-support/faq/liquid-chromatography/knowledge-base/optimizing-your-hplc-uhplc-system/index.html]
- 51. Automated high throughput IgG N-glycosylation sample ... [https://pmc.ncbi.nlm.nih.gov/articles/PMC11177659/]
- 52. PNGase F [https://www.neb.com/en-us/products/p0704-pngase-f?srsltid=AfmBOop4W-eCL-MdqgdcN1h05RhZNn7paB9iVV6eQ22s-touYWtIVsjz]
- 53. N-linked Glycan Release Efficiency: A Quantitative ... [https://pmc.ncbi.nlm.nih.gov/articles/PMC6774468/]
- 54. Development of a colorimetric PNGase activity assay [https://www.sciencedirect.com/science/article/abs/pii/S0008621518304634]
- 55. Development of a Robust and High Throughput Method for ... [https://pmc.ncbi.nlm.nih.gov/articles/PMC3739297/]
- 56. Comparative Analysis and Validation of Different Steps in ... [https://www.sciencedirect.com/science/article/abs/pii/S0076687916303007]
- 57. Robust Optimization of Biological Protocols - PMC [https://pmc.ncbi.nlm.nih.gov/articles/PMC4582800/]
- 58. A new methodology to robustify an experimental design [https://www.sciencedirect.com/science/article/pii/S0169743924000443]
- 59. Hydrophilic Interaction Liquid Chromatography HPLC and ... [https://www.thermofisher.com/us/en/home/industrial/chromatography/liquid-chromatography-lc/hplc-uhplc-columns/hilic-hplc-columns.html]
- 60. High-throughput glycosylation screening method for ... [https://www.nature.com/articles/s42004-025-01680-2]
- 61. Systematic Evaluation of Normalization Methods for ... [https://pmc.ncbi.nlm.nih.gov/articles/PMC7408386/]
- 62. Immunoglobulin G N-glycosylation predicts long-term risk of ... [https://translational-medicine.biomedcentral.com/articles/10.1186/s12967-025-07236-1]
- 63. HILIC and Its Applications for Biotechnology, Part I [https://www.chromatographyonline.com/view/hilic-and-its-applications-biotechnology-part-i]
- 64. Highly sensitive two-dimensional profiling of N-linked ... [https://www.sciencedirect.com/science/article/pii/S0003267024007918]
- 65. Expanding the structural resolution of glycosylation ... [https://pmc.ncbi.nlm.nih.gov/articles/PMC11364061/]
- 66. Identification and quantification of sialylated and core ... [https://www.sciencedirect.com/science/article/abs/pii/S0003269722001063]
- 67. High Resolution UPLC Analysis of 2-AB Labelled Glycans [https://www.chromatographyonline.com/view/high-resolution-uplc-analysis-2-ab-labelled-glycans]
- 68. Determination of Sialic Acid Isomers from Released N- ... [https://pmc.ncbi.nlm.nih.gov/articles/PMC9535620/]
- 69. 2-Dimensional ultra-high performance liquid ... [https://www.sciencedirect.com/science/article/pii/S0003267021006668]
- 70. High sensitivity acidic N-glycan profiling with MS- ... [https://www.sciencedirect.com/science/article/pii/S1570023222000241]
- 71. Immunoglobulin G N-Glycan Analysis by Ultra- ... [https://www.jove.com/t/60104/immunoglobulin-g-n-glycan-analysis-ultra-performance-liquid]
- 72. Accuracy through Linearity Validation [http://www.chromforum.org/viewtopic.php?t=10557]
- 73. Enhanced Protocol for Quantitative N-linked Glycomics ... [https://pmc.ncbi.nlm.nih.gov/articles/PMC7541788/]
- 74. Highly sensitive CE-ESI-MS analysis of N-glycans from ... [https://www.nature.com/articles/s41467-019-09910-7]
- 75. Capillary (Gel) Electrophoresis-Based Methods for ... [https://link.springer.com/chapter/10.1007/978-3-030-76912-3_4]
- 76. High-throughput glycosylation analysis of therapeutic ... [https://pmc.ncbi.nlm.nih.gov/articles/PMC3929442/]
- 77. Recent Advances in Mass Spectrometric Analysis of ... [https://pmc.ncbi.nlm.nih.gov/articles/PMC5221507/]
- 78. N-Glycan Composition Profiling for Quality Testing of ... [https://www.biopharminternational.com/view/n-glycan-composition-profiling-quality-testing-biotherapeutics]
- 79. Identification and validation of IgG N-glycosylation biomarkers ... [https://pmc.ncbi.nlm.nih.gov/articles/PMC10043232/]
- 80. N-Glycan Sequencing Kit [https://www.neb.com/en-us/products/e0577-n-glycan-sequencing-kit?srsltid=AfmBOooaV1Bxezyrg2Ev9GZoiNkWlGE7a5IpD8mYezp-ANCe3_YNOT5g]
- 81. Age-Related Changes in Serum N-Glycome in Men and ... [https://pmc.ncbi.nlm.nih.gov/articles/PMC10813383/]
- 82. Human serum N-glycan profiles are age and sex dependent [https://pubmed.ncbi.nlm.nih.gov/21807702/]
- 83. IgG N-glycome analysis [https://bio-protocol.org/exchange/minidetail?id=7662432&type=30]
- 84. Rapid Preparation of Released N-Glycans for HILIC ... [https://www.waters.com/nextgen/us/en/library/application-notes/2015/released-n-glycans-for-hilic-using-fluorescence-and-ms-labeling.html?srsltid=AfmBOoq6ZgIU59nml7SRrS1337_a2WZelQ3FKMvPnY_j_gpgi-WUcCoA]
- 85. Absolute Quantification of Aging-Associated Glycans in IgG ... [https://www.sciencedirect.com/science/article/pii/S2095809925004977]
- 86. IgG N-glycan Signatures as Potential Diagnostic and ... [https://www.mdpi.com/2075-4418/13/6/1016]
- 87. Comparative Glycomics of Immunoglobulin A and G From ... [https://pmc.ncbi.nlm.nih.gov/articles/PMC6206042/]
- 88. Aberrant glycosylation patterns as potential biomarkers for ... [https://www.frontiersin.org/journals/immunology/articles/10.3389/fimmu.2025.1538126/full]
- 89. Aberrant glycosylation patterns as potential biomarkers for ... [https://pmc.ncbi.nlm.nih.gov/articles/PMC12146333/]