A Complete HILIC-UPLC Workflow for Fluorescently Labelled Glycan Analysis: From Release to Data Interpretation
This article provides a comprehensive guide to the complete HILIC-UPLC workflow for the analysis of released and fluorescently labelled glycans, targeted at researchers and biopharmaceutical professionals.
A Complete HILIC-UPLC Workflow for Fluorescently Labelled Glycan Analysis: From Release to Data Interpretation
Abstract
This article provides a comprehensive guide to the complete HILIC-UPLC workflow for the analysis of released and fluorescently labelled glycans, targeted at researchers and biopharmaceutical professionals. It covers the fundamental principles of hydrophilic interaction liquid chromatography (HILIC) for glycan separation, detailing the step-by-step methodology from enzymatic release to fluorescent tagging (e.g., with 2-AB or 2-AA) and ultra-performance liquid chromatography (UPLC) analysis. The content addresses common challenges, offers optimization strategies for resolution and reproducibility, and validates the workflow against other techniques like MALDI-TOF-MS or capillary electrophoresis. The goal is to deliver a practical, end-to-end resource for robust and high-throughput glycan profiling in therapeutic protein development and biomarker discovery.
Understanding the HILIC-UPLC Advantage for Glycan Analysis
The Critical Role of Glycosylation in Biopharmaceuticals and Disease Biomarkers
Introduction Glycosylation, the enzymatic attachment of oligosaccharide chains (glycans) to proteins, is a critical post-translational modification that governs the stability, activity, and immunogenicity of biopharmaceuticals, while serving as a rich source of disease-specific biomarkers. This whitepaper examines this dual role, framed within the context of advanced analytical workflows centered on Hydrophilic Interaction Liquid Chromatography coupled with Ultra-Performance Liquid Chromatography (HILIC-UPLC). The HILIC-UPLC platform is paramount for the high-resolution separation and analysis of released, and often fluorescently labeled, glycans, enabling precise characterization essential for both drug development and clinical diagnostics.
I. Glycosylation in Biopharmaceutical Development
The glycosylation profile of therapeutic proteins, such as monoclonal antibodies (mAbs), fusion proteins, and enzymes, is a Critical Quality Attribute (CQA). Minor alterations can significantly impact safety and efficacy.
1.1 Impact on Pharmacokinetics and Effector Functions Glycans modulate serum half-life and immune effector functions. For example, the presence of core fucose on the Fc N-glycan of IgG1 antibodies reduces binding to FcγRIIIa on natural killer cells, thereby attenuating Antibody-Dependent Cellular Cytotoxicity (ADCC). Terminal galactose and sialic acid residues can influence complement-dependent cytotoxicity (CDC) and anti-inflammatory activity.
Table 1: Impact of Specific Fc Glycan Features on mAb Function
| Glycan Feature | Impact on mAb Function | Quantitative Effect (Typical Range) |
|---|---|---|
| Core Fucosylation | ↓ ADCC activity | 50-100% reduction in ADCC vs. afucosylated |
| Galactosylation (G1/G2) | Modulates CDC, may influence anti-inflammatory activity | Variable, context-dependent |
| Sialylation | Can enhance anti-inflammatory activity | Increased serum half-life observed in some formats |
| High Mannose | ↑ Clearance rate, potentially ↑ ADCC | ~2-5x faster clearance vs. complex type |
1.2 Analytical Control via HILIC-UPLC Workflow Routine monitoring of glycosylation during cell culture production and downstream processing is non-negotiable. The HILIC-UPLC workflow for released glycans provides the necessary robustness, resolution, and quantitation.
Experimental Protocol 1: HILIC-UPLC Analysis of Released N-Glycans from a Therapeutic mAb
- Sample Preparation: Denature 100 µg of mAb with 1% SDS and 50 mM DTT at 60°C for 10 min. Add 1% NP-40 and digest with PNGase F (5 U/µg protein) at 37°C for 3 hours to release N-glycans.
- Glycan Labeling: Desalt released glycans using solid-phase extraction (SPE) with porous graphitized carbon (PGC) or hydrophilic-lipophilic balanced (HLB) cartridges. Label with 2-aminobenzamide (2-AB) by reductive amination: incubate with 2-AB labeling solution (0.35 M in DMSO/acetic acid 70:30 v/v) and 1 M sodium cyanoborohydride at 65°C for 2 hours. Quench with 100% acetonitrile.
- HILIC-UPLC Separation: Inject labeled glycans onto a BEH Glycan or similar HILIC column (1.7 µm, 2.1 x 150 mm) maintained at 60°C. Use a gradient from 70% to 53% acetonitrile in 50 mM ammonium formate, pH 4.4, over 30-40 min at a flow rate of 0.4 mL/min.
- Detection & Analysis: Use a fluorescence detector (Ex: 330 nm, Em: 420 nm for 2-AB). Identify peaks by comparison with external glucose unit (GU) ladder or known standards. Quantify by relative peak area percentage.
II. Glycans as Disease Biomarkers
Aberrant glycosylation is a hallmark of many diseases, including cancer, autoimmune disorders, and congenital disorders of glycosylation (CDGs). Specific glycan structures on serum or cell-surface proteins can serve as sensitive and specific biomarkers.
2.1 Key Biomarker Examples
- Cancer: Increased branching (β1,6-GlcNAc) of N-glycans mediated by MGAT5, elevated sialyl-Lewis X/A antigens, and truncated O-glycans (Tn and sialyl-Tn antigens) are prevalent across carcinomas.
- Inflammation: Agalactosylated IgG (G0) glycoforms are elevated in rheumatoid arthritis and correlate with disease severity.
- CDGs: The absence or drastic reduction of entire glycan branches provides a direct diagnostic readout.
Table 2: Disease-Associated Glycan Biomarkers and Detection Strategies
| Disease | Glycan Biomarker | Carrier Protein/Context | Typical Change vs. Healthy Control | Detection Method |
|---|---|---|---|---|
| Hepatocellular Carcinoma | Core α-1,6-fucosylation | Serum haptoglobin, α-fetoprotein | >10-fold increase | HILIC-MS, Lectin-ELISA |
| Rheumatoid Arthritis | Agalactosylated (G0) glycans | Serum IgG Fc | Increase from ~30% to >50% of total Fc glycans | HILIC-UPLC-FLR |
| Prostate Cancer | α2,3-Sialylation | Serum PSA | Increased sialylation density | CE-LIF, MS |
| CDG Type Ia | Truncated/absent N-glycans | Serum transferrin, apolipoprotein C-III | Disialo-Tf increase (>10% of total Tf) | HPLC/ESI-MS |
Experimental Protocol 2: Serum IgG Fc N-Glycan Profiling for Inflammatory Disease Monitoring
- IgG Isolation: Process 10 µL of human serum using Protein G affinity spin plates. Wash with PBS and elute IgG with 0.1 M glycine-HCl, pH 2.7. Immediately neutralize with 1 M Tris-HCl, pH 9.0.
- N-Glycan Release & Labeling: Denature and release N-glycans from the eluted IgG using PNGase F as in Protocol 1. Label with procalnamide (a highly fluorescent tag) for enhanced sensitivity.
- HILIC-UPLC Analysis: Separate procalnamide-labeled glycans on a HILIC column using a shallow acetonitrile/ammonium formate gradient. Fluorescence detection (Ex: 310 nm, Em: 370 nm).
- Data Interpretation: Quantify the G0, G1, and G2 glycan peaks. Calculate the G0/G1/G2 ratio and the G0/(G1+G2) index, which are biomarkers of inflammatory status.
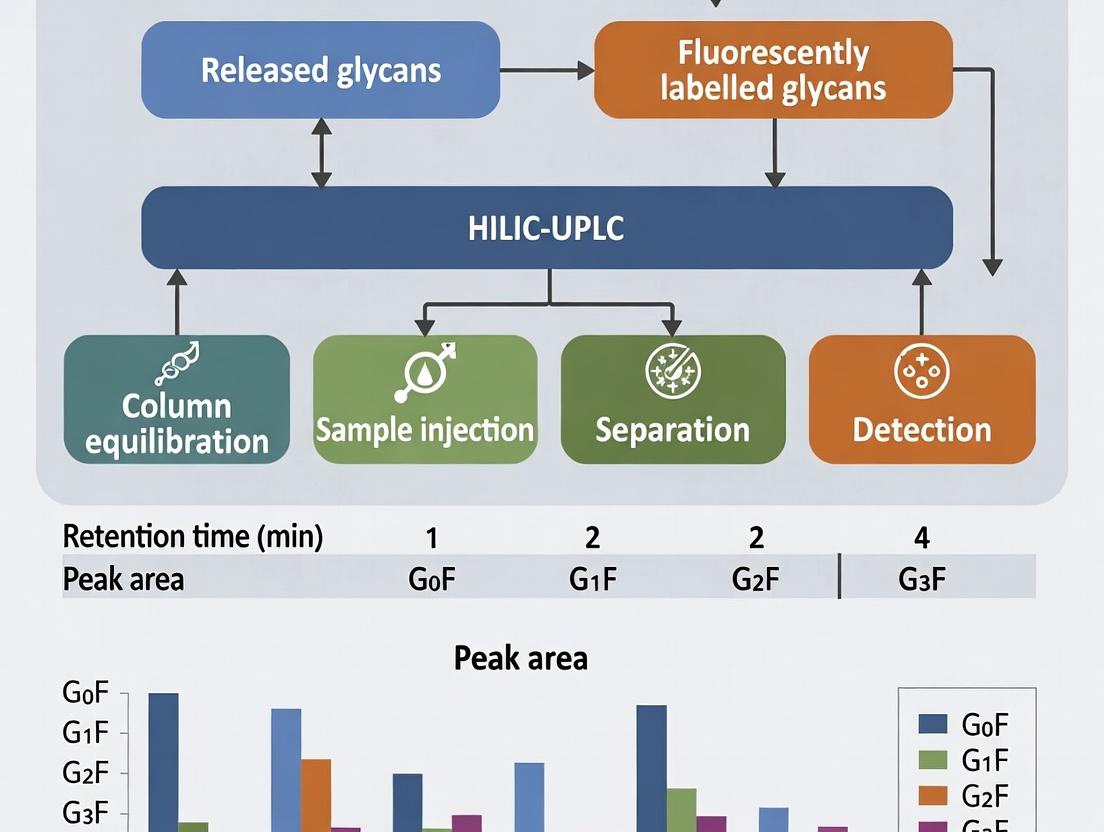
III. The Central Workflow: HILIC-UPLC for Glycan Analysis
The HILIC-UPLC workflow integrates sample preparation, separation, and data analysis, forming the backbone of modern glycosylation analysis for both biopharmaceutical characterization and biomarker discovery.
Diagram 1: Core HILIC-UPLC Workflow for Released N-Glycans
The Scientist's Toolkit: Key Research Reagent Solutions
| Item | Function/Application |
|---|---|
| PNGase F (Glycoamidase F) | Enzyme for releasing intact N-linked glycans from glycoproteins for analysis. |
| 2-Aminobenzamide (2-AB) / Procalnamide | Fluorescent dyes for glycan labeling via reductive amination, enabling sensitive detection. |
| BEH Glycan HILIC Column (e.g., Waters) | UPLC column with bridged ethyl hybrid particles for high-resolution separation of labeled glycans. |
| Porous Graphitized Carbon (PGC) SPE Cartridges | For clean-up and desalting of released glycans prior to labeling or MS analysis. |
| Glucose Unit (GU) Ladder Standard | Dextran hydrolysate or 2-AB-labeled standard used to calibrate HILIC retention times into GU values for identification. |
| Protein G/A Affinity Resin/Plates | For rapid isolation of IgG from serum or cell culture supernatants for Fc glycan analysis. |
| Ammonium Formate, pH 4.4 | Volatile salt buffer for HILIC mobile phase, compatible with both FLR and MS detection. |
| GlycoWorks RapiFluor-MS Labeling Kit | Commercial kit for rapid, efficient labeling of glycans with a fluorescent tag optimized for UPLC-MS sensitivity. |
IV. Advanced Pathway Mapping: Glycosylation Impact on mAb Mechanism of Action
The specific glycosylation of a therapeutic antibody orchestrates its interactions with the human immune system via defined signaling pathways.
Diagram 2: Key Fc Glycan Features Drive Immune Effector Functions
Conclusion The critical analysis of glycosylation is indispensable in the twin fields of biopharmaceuticals and disease biomarkers. The HILIC-UPLC workflow for released glycans provides the high-resolution, quantitative data required to ensure drug efficacy and safety, and to discover and validate clinically relevant glycan biomarkers. As therapeutic modalities and diagnostic needs evolve, this analytical foundation will continue to support innovations in precision medicine and quality-by-design drug development.
Why HILIC? Principles of Hydrophilic Interaction Chromatography for Sugar Separation
Hydrophilic Interaction Liquid Chromatography (HILIC) has become the cornerstone technique for the separation of polar, hydrophilic analytes, particularly sugars and glycans. Within the broader thesis of implementing a robust HILIC-UPLC workflow for released and fluorescently labeled glycans research, understanding the fundamental principles of HILIC is paramount. This guide delves into the core mechanisms that make HILIC uniquely suited for resolving complex glycan mixtures, a critical task for biopharmaceutical development, biomarker discovery, and basic research in glycoscience.
Core Principles of HILIC Separation
HILIC operates on a partitioning mechanism where analytes are separated based on differential partitioning between a water-rich layer immobilized on the surface of a hydrophilic stationary phase and a relatively hydrophobic organic-rich mobile phase (typically acetonitrile-rich). The retention order is generally the inverse of reversed-phase LC: the most hydrophilic compounds are retained the longest.
Key Retention Mechanisms:
- Partitioning: The primary mechanism. A water-enriched layer forms on the stationary phase. Analytes distribute between this layer and the bulk organic mobile phase.
- Hydrogen Bonding: Direct interaction between polar analytes and neutral polar functional groups (e.g., amide, diol) on the stationary phase.
- Electrostatic Interactions: For charged stationary phases (e.g., zwitterionic) and charged analytes (e.g., sialylated glycans), ion-exchange mechanisms can contribute significantly.
The typical HILIC mobile phase consists of a high percentage of organic solvent (e.g., 70-90% acetonitrile) with a small percentage of aqueous buffer (e.g., 10-30%). Elution is achieved by increasing the aqueous component, increasing analyte solubility in the mobile phase and reducing its interaction with the stationary phase.
Diagram Title: HILIC Retention Mechanism: Partitioning Model
Why HILIC for Sugar and Glycan Separation?
HILIC offers distinct advantages over other chromatographic modes for glycan analysis:
- Superior Retention of Polar Compounds: Reversed-phase LC fails to retain highly hydrophilic, non-derivatized glycans. HILIC provides excellent retention and resolution.
- Compatibility with MS Detection: The high organic mobile phases used in HILIC promote efficient desolvation and ionization in electrospray ionization (ESI) sources, significantly enhancing MS sensitivity.
- Orthogonality to Other Techniques: HILIC separation is orthogonal to reversed-phase and porous graphitized carbon (PGC) chromatography, providing complementary structural information.
- Ideal for Fluorescently Labeled Glycans: Common glycan labels (e.g., 2-AB, ProA) introduce a hydrophobic moiety, but the separation is still driven by the hydrophilic glycan core, offering excellent profiling.
Table 1: Comparison of Chromatographic Modes for Glycan Separation
| Feature | HILIC | Reversed-Phase (RP) | Porous Graphitized Carbon (PGC) |
|---|---|---|---|
| Retention Mechanism | Partitioning/Hydrogen bonding | Hydrophobicity | Hydrophobic & Charge-induced interactions |
| Mobile Phase | High Organic (ACN/H₂O) | High Aqueous to Organic Gradient | Aqueous Buffers / ACN |
| Retention Order | Hydrophilic = Retained Longer | Hydrophobic = Retained Longer | Complex (isomer separation) |
| MS Compatibility | Excellent (High ESI response) | Good | Good |
| Key Strength for Glycans | Profiling of labeled glycans | Separation of glycopeptides | Isomer separation (e.g., linkage) |
Detailed Experimental Protocol: HILIC-UPLC of 2-AB Labeled N-Glycans
This protocol is central to the thesis workflow for profiling released N-glycans from monoclonal antibodies or other glycoproteins.
Materials & Reagents:
- Glycan samples released via PNGase F.
- 2-Aminobenzamide (2-AB) fluorescent label.
- Sodium cyanoborohydride (reducing agent).
- HILIC column (e.g., Waters ACQUITY UPLC Glycan BEH Amide, 1.7 µm, 2.1 x 150 mm).
- UPLC system with FLD and/or MS detection.
- Solvents: LC-MS grade Acetonitrile (ACN), Ammonium formate (e.g., 50mM, pH 4.4).
- DMSO (optional, for labeling).
Procedure:
Fluorescent Labeling:
- Dry released glycans in a vacuum concentrator.
- Prepare labeling solution: 2-AB (19 mg/mL) and sodium cyanoborohydride (32 mg/mL) in DMSO/acetic acid (70:30 v/v).
- Add 5-10 µL of labeling solution to dried glycans. Vortex and centrifuge.
- Incubate at 65°C for 2-3 hours.
Clean-up of Labeled Glycans:
- Purify using hydrophilic solid-phase extraction (SPE) cartridges (e.g., PhyNexus Glycan clean-up tips or packed with cotton wool).
- Equilibrate with water, then condition with >95% ACN.
- Load labeled reaction in high %ACN. Wash with >95% ACN to remove excess dye.
- Elute labeled glycans with water or 20-30% ACN. Dry for storage or reconstitute.
HILIC-UPLC Analysis:
- Column: BEH Glycan Amide, 1.7 µm, 2.1 x 150 mm, 45°C.
- Mobile Phase A: 50 mM ammonium formate, pH 4.4.
- Mobile Phase B: 100% Acetonitrile.
- Gradient: Start at 75% B. Linear gradient to 50% B over 25-45 minutes (optimize for separation).
- Flow Rate: 0.4 mL/min.
- Detection: Fluorescence (Ex: 330 nm, Em: 420 nm) and/or ESI-MS.
Diagram Title: HILIC-UPLC Workflow for Fluorescently Labeled N-Glycans
The Scientist's Toolkit: Key Research Reagent Solutions
Table 2: Essential Materials for HILIC-Based Glycan Analysis
| Item | Function/Description | Example Vendor/Product |
|---|---|---|
| HILIC UPLC Column | Hydrophilic stationary phase for separation. Amide chemistry is standard for glycan profiling. | Waters ACQUITY UPLC Glycan BEH Amide |
| Fluorescent Label (2-AB) | Introduces a fluorophore for highly sensitive fluorescence detection (FLD). | Sigma-Aldrich, LudgerTag 2-AB |
| Rapid PNGase F | High-activity enzyme for efficient release of N-glycans from glycoproteins. | Promega, NEB |
| HILIC SPE Material | For purification of labeled glycans from excess dye and salts. Critical for robust analysis. | PhyNexus GlycanClean S, LudgerClean S |
| MS-Compatible Buffer | Volatile salt buffer for mobile phase. Maintains pH and is compatible with ESI-MS. | Ammonium formate, pH 4.4 |
| LC-MS Grade Solvents | High-purity solvents to minimize background noise and system contamination. | ACN, Water (from various vendors) |
| Glycan Standard | Dextran ladder or defined glycan mix for system performance qualification and GU calibration. | Waters Glycan Performance Test Standard |
Within the HILIC-UPLC workflow for released glycan analysis, fluorescent labelling is not merely a detection step; it is a critical determinant of sensitivity, resolution, and quantitative accuracy. This whitepaper provides an in-depth technical guide to selecting fluorescent tags, focusing on the widely used 2-aminobenzamide (2-AB), 2-aminobenzoic acid (2-AA), and procainamide, within the context of optimizing sensitivity for pharmaceutical and biomedical research.
The Role of Fluorescent Labelling in HILIC-UPLC Glycan Analysis
Hydrophilic Interaction Liquid Chromatography (HILIC) coupled with Ultra-Performance Liquid Chromatography (UPLC) separates glycans based on their hydrophilicity and size. Native glycans lack a strong chromophore or fluorophore, necessitating derivatization. A fluorescent tag introduces a hydrophobic moiety for improved chromatographic resolution and enables highly sensitive, quantitative detection. The choice of tag directly impacts:
- Detection Sensitivity: Quantum yield and instrument compatibility.
- Chromatographic Resolution: Hydrophobicity and interaction with the stationary phase.
- Structural Analysis: Potential for aiding tandem mass spectrometry (MS/MS) fragmentation.
Comparative Analysis of Key Fluorescent Tags
Chemical Properties and Labelling Mechanisms
All three tags are amines that react with the reducing terminus of released glycans via reductive amination. This involves the formation of a Schiff base between the aldehyde group of the reducing sugar and the amine group of the tag, followed by reduction with sodium cyanoborohydride (NaBH₃CN) to form a stable secondary amine linkage.
Quantitative Comparison of Tags
The following table summarizes the key performance characteristics of 2-AB, 2-AA, and procainamide.
Table 1: Comparative Properties of Fluorescent Tags for Glycan Labelling
| Property | 2-Aminobenzamide (2-AB) | 2-Aminobenzoic Acid (2-AA) | Procainamide |
|---|---|---|---|
| Excitation/Emission (nm) | ~330 / ~420 | ~230 / ~425 | ~310 / ~370 |
| Relative Quantum Yield | Moderate | Higher than 2-AB | Highest (~2-3x 2-AB) |
| Relative Sensitivity | Good (Standard) | Very Good | Excellent |
| Charge at pH 4.7 | Neutral | Anionic (-1) | Cationic (+1) |
| HILIC Retention | Standard | Slightly earlier elution | Stronger retention |
| MS Compatibility | Good; neutral label | Good; can impart negative charge | Excellent; enhances MS/MS sensitivity via charge-remote fragmentation |
| Key Advantage | Robust, established protocol | Good sensitivity, UV activity | Ultimate sensitivity, superior MS/MS data |
| Primary Disadvantage | Lower sensitivity vs. others | Requires lower Ex wavelength | More expensive, may require protocol optimization |
Experimental Protocols for Fluorescent Labelling
General Protocol for Reductive Amination Labelling
This standard protocol is adaptable for 2-AB, 2-AA, and procainamide with minor modifications in reagent preparation.
Materials:
- Dried, released glycan sample.
- Labelling reagent: Tag (e.g., 2-AB, 2-AA, procainamide) at 0.35-0.5 M in dimethyl sulfoxide (DMSO) containing 1.0 M acetic acid.
- Reducing agent: 1.0 M sodium cyanoborohydride (NaBH₃CN) in DMSO (CAUTION: Toxic. Handle in fume hood).
- Incubator or heat block (65°C).
- Acetonitrile (≥99.9%).
Procedure:
- Reaction Setup: To the dried glycan sample, add 5 µL of labelling reagent and 5 µL of reducing agent. Vortex thoroughly to dissolve.
- Incubation: Incubate the mixture at 65°C for 2-4 hours. Procainamide may benefit from extended incubation (up to 4 hours) for complete labelling.
- Reaction Quenching: The reaction can be stopped by dilution with the HILIC starting solvent (typically ~85% acetonitrile) or by drying.
- Cleanup (Optional but Recommended): Excess fluorescent reagent must be removed to avoid interference. This is typically achieved using solid-phase extraction (SPE) with hydrophilic-lipophilic balance (HLB) or porous graphitized carbon (PGC) cartridges, or by precipitation in cold acetonitrile (for 2-AB/2-AA).
- Acetonitrile Precipitation (for 2-AB/2-AA): Add 200 µL of cold acetonitrile to the reaction mixture, vortex, and centrifuge at 13,000 x g for 5 minutes. The labelled glycans form a pellet, while excess reagent remains in the supernatant. Carefully remove the supernatant.
- Reconstitution: Redissolve the purified, labelled glycan pellet in 50-100 µL of the appropriate HILIC starting solvent (e.g., 75-85% acetonitrile in water) for UPLC analysis.
The HILIC-UPLC Workflow for Labelled Glycans
The following diagram illustrates the integrated workflow from glycan release to data analysis, highlighting the central role of fluorescent labelling.
The Scientist's Toolkit: Research Reagent Solutions
Table 2: Essential Reagents and Materials for Fluorescent Glycan Labelling
| Item | Function & Importance |
|---|---|
| PNGase F | Enzyme for releasing N-linked glycans from glycoproteins under non-denaturing conditions. Essential for structural integrity. |
| 2-AB, 2-AA, or Procainamide | The core fluorescent labelling agents. Choice dictates sensitivity, MS compatibility, and chromatographic behavior. |
| Sodium Cyanoborohydride (NaBH₃CN) | Selective reducing agent for reductive amination. Stable in acidic, aqueous-organic solvents. Highly toxic. |
| Anhydrous Dimethyl Sulfoxide (DMSO) | High-quality, dry solvent for preparing labelling reagents to prevent hydrolysis of the reducing agent. |
| Acetic Acid (Glacial) | Provides the acidic catalysis required for efficient reductive amination. |
| HLB or PGC Solid-Phase Extraction Cartridges | For post-labelling cleanup to remove excess hydrophobic dye, which can contaminate columns and detectors. |
| HILIC UPLC Column (e.g., BEH Amide) | The separation core. Sub-2µm particles provide high-resolution glycan profiling. |
| Acetonitrile (HPLC/UPLC Grade) | Primary organic solvent for HILIC mobile phases and sample reconstitution. Purity is critical for baseline stability. |
| Fluorescence Detector | Must be compatible with the excitation/emission maxima of the chosen tag (e.g., 310/370 nm for procainamide). |
Advanced Considerations: Tag Selection for Specific Applications
The optimal tag is dictated by the research question, as illustrated in the following decision pathway.
The selection of a fluorescent tag—2-AB, 2-AA, or procainamide—is a fundamental strategic decision in the HILIC-UPLC analysis of released glycans. While 2-AB remains a robust standard, 2-AA offers a balance of good sensitivity and MS utility. For applications demanding the utmost sensitivity and superior structural characterization via MS/MS, procainamide represents the current state-of-the-art. Integrating an optimized labelling protocol with the resolving power of HILIC-UPLC creates a powerful platform for advancing glycomics research in drug development, where subtle changes in glycosylation can have critical therapeutic implications.
This technical whitepaper details the core five-component workflow—Release, Label, Cleanup, Separate, Analyze—essential for High-Performance Liquid Chromatography under Hydrophilic Interaction Liquid Chromatography conditions with Ultra-Performance Liquid Chromatography (HILIC-UPLC) analysis of fluorescently labelled glycans. Framed within a broader thesis on glycomics for biotherapeutic development, this guide provides standardized protocols and data interpretation frameworks for researchers and drug development professionals. The integration of these steps enables robust, reproducible, and high-resolution glycan profiling critical for monoclonal antibody characterization, biosimilar development, and biomarker discovery.
The analysis of released and fluorescently labelled glycans via HILIC-UPLC is the gold standard for high-throughput, high-resolution glycan profiling in biopharmaceuticals. This workflow dissects the complex heterogeneity of protein glycosylation, providing critical data on critical quality attributes (CQAs). Each core component—Release, Label, Cleanup, Separate, Analyze—is a critical link in a chain that transforms a glycosylated protein into a quantitative dataset, informing drug efficacy, stability, and immunogenicity.
Core Component 1: Release
Objective: To enzymatically or chemically cleave N-linked or O-linked glycans from the glycoprotein of interest without damaging the glycan structures.
Detailed Protocol: Enzymatic Release of N-glycans using PNGase F
- Denaturation: Dilute the glycoprotein (e.g., 100 µg of monoclonal antibody) to 1-2 mg/mL in a solution of 20 mM sodium bicarbonate buffer (pH 7.5). Add Rapid PNGase F denaturation solution (e.g., 1% SDS, 5% β-mercaptoethanol). Heat at 100°C for 5 minutes.
- Enzymatic Digestion: Cool the sample. Add 10% (v/v) Nonidet P-40 or Triton X-100 to sequester SDS. Add 2 µL (1000 units) of recombinant PNGase F. Vortex and incubate at 50°C for 15 minutes or 37°C for 3 hours.
- Termination: Heat the sample at 100°C for 5 minutes to denature the enzyme.
Table 1: Optimized Conditions for Glycan Release Methods
| Method | Typical Reagent | Conditions | Efficiency | Notes |
|---|---|---|---|---|
| Enzymatic (N) | PNGase F | 37-50°C, pH 7.5-8.5, 3 hr-15 min | >95% | Gold standard, non-reductive. |
| Chemical (N) | Hydrazine | 60°C, 6-10 hr | >90% | Harsh, can cleave O-glycans; used for historical peptide mapping. |
| Chemical (O) | β-Elimination | 45°C, 16-18 hr | Variable | Requires reductive conditions with NaBH₄ to prevent peeling. |
Diagram Title: Enzymatic Release of N-Glycans with PNGase F
Core Component 2: Label
Objective: To tag the reducing terminus of released glycans with a fluorescent dye, conferring high sensitivity for UPLC detection.
Detailed Protocol: 2-AB Labelling via Reductive Amination
- Labelling Mix: Prepare a labelling solution of 2-Aminobenzamide (2-AB) at a concentration of 48 mg/mL in a mixture of dimethyl sulfoxide (DMSO) and acetic acid (70:30 v/v). Separately, prepare sodium cyanoborohydride (NaBH₃CN) at 64 mg/mL in the same DMSO/acetic acid mixture.
- Reaction: Combine 5 µL of the clean, dried glycan sample with 5 µL of the 2-AB solution and 5 µL of the NaBH₃CN solution. Vortex thoroughly.
- Incubation: Incubate the mixture at 65°C for 2 hours in a dry heating block, protected from light.
- Completion: The reaction is complete after 2 hours; samples can be stored at -20°C in the dark prior to cleanup.
Table 2: Common Fluorescent Labels for HILIC-UPLC
| Label | Ex/Em (nm) | Charge | Relative Sensitivity | Key Advantage |
|---|---|---|---|---|
| 2-AB | 330/420 | Neutral | 1x (Baseline) | Standard label, minimal mass/charge impact on separation. |
| 2-AA | 370/410 | Negative | ~1x | Useful for alternative detection methods (MS). |
| Procalnamide | 310/370 | Positive | ~3-5x | Higher sensitivity, excellent for low-abundance glycans. |
| RapiFluor-MS | 265/425 | Positive | ~10-15x | Extreme sensitivity, enables direct MS coupling. |
Core Component 3: Cleanup
Objective: To remove excess dye, salts, and reaction byproducts that interfere with downstream separation and analysis.
Detailed Protocol: Solid-Phase Extraction (SPE) Cleanup on Hydrophilic Interaction (HLB) Cartridges
- Conditioning: Activate a 96-well HLB µElution plate or cartridge with 200 µL acetonitrile (ACN). Centrifuge at 1000 x g for 1 minute.
- Equilibration: Equilibrate with 200 µL of 85% ACN/15% water. Centrifuge as before.
- Sample Loading: Dilute the labelling reaction with 200 µL of 85% ACN. Apply to the conditioned plate. Centrifuge.
- Washing: Wash twice with 200 µL of 85% ACN to remove unincorporated dye. Centrifuge after each wash.
- Elution: Elute purified labelled glycans with 2 x 50 µL aliquots of Milli-Q water into a clean collection plate. Combine eluates and dry in a centrifugal vacuum concentrator.
Diagram Title: SPE Cleanup Workflow for Labelled Glycans
Core Component 4: Separate (HILIC-UPLC)
Objective: To achieve high-resolution separation of labelled glycans based on their hydrophilicity and size.
Detailed Protocol: HILIC-UPLC Separation on a BEH Amide Column
- Column: Acquity UPLC Glycan BEH Amide Column, 130Å, 1.7 µm, 2.1 mm x 150 mm.
- Mobile Phase: A) 50 mM ammonium formate, pH 4.5 (Aqueous); B) 100% Acetonitrile (Organic).
- Gradient: 75% B to 62% B over 25 minutes at a flow rate of 0.4 mL/min. Column temperature: 60°C. Sample temperature: 10°C.
- Detection: Fluorescence detection with λex/λem = 330/420 nm (for 2-AB).
- Injection: Inject 5-10 µL of dried, reconstituted glycan sample.
Table 3: Typical HILIC-UPLC Elution Order of Common N-glycans
| Glycan Structure (GU Value Approx.) | Abbreviation | Relative Retention (Typical Order) |
|---|---|---|
| High Mannose (M5) | Man5 | Early Elution |
| Hybrid | A2G1 | --- |
| Complex, Biantennary, No Core Fucose | A2 | --- |
| Complex, Biantennary, Core Fucose | FA2 | Middle Elution |
| Complex, Biantennary +1 Galactose | FA2G1 | --- |
| Complex, Biantennary, Fully Galactosylated | FA2G2 | --- |
| Complex, Asialylated, Triantennary | A3F | Late Elution |
| Complex, Sialylated (Monosialo) | FA2G2S1 | Very Late Elution |
| Complex, Sialylated (Disialo) | FA2G2S2 | Latest Elution |
Core Component 5: Analyze
Objective: To translate chromatographic data into structural identification and quantitative composition of the glycan profile.
Detailed Protocol: Data Processing and Quantification
- Integration: Use dedicated software (e.g., Waters Empower, Thermo Chromeleon) to integrate all glycan peaks, setting a consistent baseline.
- Glucose Unit (GU) Assignment: Run an external standard ladder of 2-AB labelled glucose oligomers (dextran hydrolysate). Create a calibration curve of log(Retention Time) vs. GU. Interpolate GU values for sample peaks.
- Identification: Compare experimental GU values to databases (e.g., GlycoStore, UGL) for tentative structural assignment. Confirm with exoglycosidase digests or LC-MS.
- Quantification: Report results as relative percent abundance of each integrated peak area relative to the total integrated glycan area. Absolute quantification requires an internal standard of known concentration.
The Scientist's Toolkit: Essential Research Reagent Solutions
Table 4: Key Reagents and Materials for the HILIC-UPLC Glycan Workflow
| Item | Function & Specification | Example Vendor/Product |
|---|---|---|
| PNGase F | Enzyme for efficient, non-reductive release of N-glycans. Recombinant, glycerol-free preferred. | Promega, Sigma-Aldrich, NZYTech |
| 2-Aminobenzamide (2-AB) | Neutral, fluorescent label for glycan detection via reductive amination. ≥98% purity. | Sigma-Aldrich, Ludger |
| Sodium Cyanoborohydride | Reducing agent for reductive amination labelling reaction. Powder, must be fresh. | Sigma-Aldrich |
| Acetonitrile (UPLC/MS Grade) | Primary organic mobile phase for HILIC; also used in SPE cleanup. | Fisher Chemical, Honeywell |
| Ammonium Formate | Buffer salt for aqueous mobile phase (Mobile Phase A). LC-MS grade. | Fluka, Sigma-Aldrich |
| BEH Amide UPLC Column | Stationary phase for HILIC separation of glycans. 1.7 µm, 2.1 x 150 mm. | Waters (Acquity UPLC) |
| HLB µElution Plate | Solid-phase extraction plate for post-labelling cleanup of glycans. | Waters (Oasis) |
| Dextran Hydrolysate Ladder | Glucose oligomer standard for GU value calibration. 2-AB labelled. | Procognate, Ludger |
Diagram Title: Core HILIC-UPLC Glycan Analysis Workflow
The five-component workflow—Release, Label, Cleanup, Separate, Analyze—forms an integrated, robust pipeline for glycan characterization using HILIC-UPLC. Standardization of each step, as detailed in this guide, is paramount for generating reliable, comparable data across laboratories. This methodology is indispensable for advancing glycomics research and ensuring the quality, safety, and efficacy of glycosylated biotherapeutics. Future developments will focus on increasing throughput, enhancing MS-compatibility, and automating data analysis, but the core conceptual workflow will remain foundational.
This whitepaper provides an in-depth technical guide on the application of HILIC-UPLC (Hydrophilic Interaction Liquid Chromatography-Ultra Performance Liquid Chromatography) workflows for the analysis of released and fluorescently labelled glycans. The analysis of glycosylation is a critical quality attribute (CQA) for monoclonal antibodies (mAbs), a cornerstone for demonstrating biosimilarity, and an emerging frontier in clinical biomarker discovery. The precision, resolution, and reproducibility of HILIC-UPLC make it the industry-standard platform for these high-stakes applications.
Monoclonal Antibody Quality Assurance and Quality Control
The glycan profile of a therapeutic mAb directly impacts its safety, efficacy, and stability. HILIC-UPLC of 2-aminobenzamide (2-AB) labelled glycans is the workhorse method for lot-release testing and stability studies.
Core Protocol: 2-AB Labelling and HILIC-UPLC for mAb QA/QC
- Release: Denature 100 µg of mAb with 2% SDS/1.2 M DTT. Use PNGase F (1000 units, 37°C, 18 hours) to release N-glycans.
- Cleanup: Purify released glycans using solid-phase extraction (e.g., hydrophilic PVDF plates) to remove detergents and proteins.
- Labelling: Dry glycans and label with 2-AB dye (5 µL of 0.35 M in DMSO/acetic acid 7:3 v/v) in the presence of reducing agent (5 µL of 1.0 M NaBH3CN in DMSO) at 65°C for 2-3 hours.
- Cleanup (Post-Labelling): Remove excess dye using paper chromatography or hydrophilic SPE.
- HILIC-UPLC Analysis: Inject labelled glycan sample onto a BEH Glycan or similar amide-bonded column (e.g., 2.1 x 150 mm, 1.7 µm). Use a binary gradient:
- Mobile Phase A: 50 mM ammonium formate, pH 4.5.
- Mobile Phase B: Acetonitrile.
- Gradient: 70-53% B over 25-30 minutes at 0.4 mL/min, 60°C.
- Detection: Fluorescence (Ex: 330 nm, Em: 420 nm).
Key QA/QC Metrics from HILIC-UPLC Data: Table 1 summarizes the primary quantitative attributes monitored. Table 1: Key Glycan Attributes for mAb QA/QC
| Attribute | Typical Target (IgG1) | Acceptance Criteria (Example) | Impact |
|---|---|---|---|
| G0F | ~10-30% | ± 5% absolute | Efficacy, ADCC |
| G1F | ~30-50% | ± 5% absolute | Efficacy, ADCC |
| G2F | ~10-25% | ± 5% absolute | Efficacy, half-life |
| Man5 | < 5% | ≤ 5% absolute | Process consistency |
| Afucosylated (G0, G1, G2) | < 5% | ≤ 5% absolute | Potency (enhanced ADCC) |
| High Mannose | < 5% | ≤ 5% absolute | Clearance rate |
| Sialylation | < 3% | ≤ 3% absolute | Half-life, immunogenicity |
HILIC-UPLC QA/QC Workflow for mAb Glycans
Biosimilarity Studies
Demonstrating biosimilarity requires comprehensive analytical comparability, where glycan analysis is a critical tier. HILIC-UPLC provides the high-resolution data necessary for statistical comparison of biosimilar-to-reference product profiles.
Experimental Protocol: Comparative Glycan Profiling for Biosimilars The core protocol is identical to the QA/QC method, but applied in a highly controlled, head-to-head manner.
- Sample Preparation: Process reference product and biosimilar candidate in parallel, using the same reagent batches.
- Analysis: Run samples in randomized sequence on the same UPLC system within a single session to minimize inter-run variability.
- Data Processing: Integrate all peaks using identical parameters. Normalize data to total area (100%).
- Statistical Analysis: Use multivariate statistics (e.g., Principal Component Analysis - PCA) and similarity indices (e.g., Gaussian Similarity Score, Pearson correlation).
Quantitative Comparability Metrics: Table 2: Example Biosimilarity Assessment Data
| Glycan Structure | Reference mAb (%) | Biosimilar mAb (%) | Absolute Difference | Pass/Fail (≤5%) |
|---|---|---|---|---|
| G0F | 15.2 | 16.8 | +1.6 | Pass |
| G1F | 34.5 | 33.1 | -1.4 | Pass |
| G2F | 23.1 | 21.9 | -1.2 | Pass |
| Man5 | 1.2 | 2.1 | +0.9 | Pass |
| G0 | 4.5 | 5.8 | +1.3 | Pass |
| G0F-GlcNAc | 3.1 | 5.5 | +2.4 | Pass |
| Gaussian Similarity Score | -- | -- | 98.7 | Pass (≥92) |
Biosimilarity Assessment Logic Flow
Clinical Glycomics
Clinical glycomics investigates glycan biomarkers in biofluids (serum, plasma) for disease detection and monitoring. HILIC-UPLC of labelled plasma N-glycome is a powerful discovery tool.
Core Protocol: Plasma N-Glycome Profiling for Clinical Research Note: This protocol involves total plasma protein analysis, not IgG-specific.
- Plasma Protein Precipitation: Dilute 10 µL of plasma with water. Precipitate proteins with cold ethanol (80% final concentration). Wash pellet.
- Release & Labelling: Resuspend protein pellet in PBS/0.1% SDS. Denature, reduce, and release N-glycans with PNGase F. Label with a highly sensitive tag like RapiFluor-MS (RFMS).
- HILIC-UPLC-MS Analysis:
- Chromatography: Use a BEH Glycan column with a shallow acetonitrile/ammonium formate gradient.
- Detection: Parallel Fluorescence (RFMS tag) and Mass Spectrometry (Q-TOF). Fluorescence provides robust quantification; MS provides structural identification.
Example Clinical Glycomics Findings: Table 3: Selected Plasma Glycan Biomarkers in Disease States
| Glycan Feature (HILIC Peak) | Relative Change in Disease | Associated Condition | Potential Biological Relevance |
|---|---|---|---|
| Bisecting GlcNAc (e.g., FA2B) | Increased | Hepatocellular Carcinoma, Liver Fibrosis | Altered γ-glutamyltransferase activity |
| Core Fucosylated (e.g., A3F) | Decreased | Rheumatoid Arthritis, IBD | Inflammation-driven glycosyltransferase dysregulation |
| α2,6 Sialylation | Decreased | Advanced Cancers, Severe COVID-19 | Reflects immune dysregulation and acute phase response |
| Branching (Tri-/Tetra-antennary) | Increased | Various Cancers (e.g., Breast, Ovarian) | Associated with metastasis and tumor burden |
From Disease to Biomarker via Glycan Analysis
The Scientist's Toolkit: Research Reagent Solutions
Table 4: Essential Materials for HILIC-UPLC Glycan Analysis
| Item | Function/Description | Example Vendor/Product |
|---|---|---|
| PNGase F (Rapid) | High-purity, rapid formulation for efficient release of N-glycans from glycoproteins. | Promega GlycoProfile Rapid |
| 2-AB Labeling Kit | Optimized kit for fluorescent labeling, includes dye, reductant, and cleanup materials. | ProZyme GlykoPrep 2-AB |
| RapiFluor-MS (RFMS) Label | Ultra-sensitive tag for combined UPLC fluorescence and MS detection. | Waters RapiFluor-MS |
| BEH Glycan UPLC Column | 1.7 µm particle size column designed for high-resolution glycan separation. | Waters ACQUITY UPLC BEH Glycan |
| Hydrophilic SPE Plate | 96-well plate for purification of glycans after release and labeling. | Waters μElution Protein Precipitation |
| Glycan Mobility Standard (2-AB) | Labelled standard for normalizing retention times (GU calibration). | ProZyme 2-AB Glucose Homopolymer |
| Glycan Sequencing Standards | 2-AB labelled, defined structures for peak assignment. | Elicityl OligoMass Kit |
| Ammonium Formate, LC-MS Grade | Essential for preparing volatile, MS-compatible mobile phase buffers. | Sigma-Aldrich 70221 |
Step-by-Step Protocol: From Glycan Release to UPLC Injection
The comprehensive structural analysis of protein glycosylation is pivotal in biopharmaceutical development, biomarker discovery, and fundamental biology. Within a standardized HILIC-UPLC workflow for released, fluorescently labelled glycans, the initial enzymatic release step is the critical determinant of analytical success. Efficient, quantitative, and non-degradative release preserves the native glycan structure for downstream fluorescent tagging, chromatographic separation, and data interpretation. This guide details the core enzymatic strategies, with a focus on PNGase F and complementary methods, to ensure a robust foundation for high-resolution HILIC-UPLC profiling.
Core Enzymatic Mechanisms and Protocols
PNGase F: The Gold Standard for N-Glycan Release
Mechanism: Peptide-N-Glycosidase F (PNGase F) is an amidase that cleaves the glycosylamine bond between the innermost GlcNAc of an N-linked glycan and the asparagine residue of the peptide backbone. It releases intact, unaltered N-glycans, converting asparagine to aspartic acid.
Detailed Protocol for Denatured Proteins:
- Denaturation: Incubate 10-100 µg of protein in a solution of 0.1% SDS and 50 mM β-mercaptoethanol (or 10 mM DTT) at 60°C for 10 minutes.
- Surfactant Neutralization: Cool the sample. Add a 10-fold molar excess of non-ionic surfactant (e.g., NP-40 or Triton X-100) over SDS to a final concentration of 1-2% (v/v). This prevents SDS from denaturing the enzyme.
- Enzymatic Digestion: Add reaction buffer (typically 50 mM sodium phosphate, pH 7.5) and 1-2 units of PNGase F per 100 µg of protein.
- Incubation: Incubate at 37°C for 3-18 hours. For complex samples or glycoproteins with hindered sites, extended incubation is recommended.
- Termination & Cleanup: Heat-inactivate the enzyme at 75°C for 10 minutes. Released glycans must be separated from proteins, salts, and detergents via solid-phase extraction (e.g., hydrophilic-lipophilic balanced (HLB) or graphite carbon cartridges) prior to labelling.
Limitations: PNGase F is ineffective against glycans with core α1-3 fucosylation (common in plants and insects) and does not cleave O-glycans.
Beyond PNGase F: Complementary Enzymatic Tools
A. PNGase A: Used for plant/insect-derived glycoproteins. It cleaves core α1-3 fucosylated N-glycans. Requires a reaction buffer at pH 5.0-5.5. B. Chemical Release for O-Glycans: No universal enzyme exists for O-glycan release. β-Elimination under mild alkaline conditions is standard.
- Protocol for Non-Reductive β-Elimination (Labels reducing terminus): Incubate dried glycoprotein with 50 mM NaOH and 1 M NaBH₄ at 45°C for 16 hours. Terminate with glacial acetic acid. Desalt via cation-exchange or sequential solid-phase extraction.
- Protocol for Reductive β-Elimination (Destroys reducing terminus): Use 100 mM NaOH and 1 M NaBH₄ at 45°C for 16 hours. Borate is removed by repeated evaporation with methanol.
C. Enzymatic O-Glycan Release (Emerging): O-Glycanase (endo-α-N-acetylgalactosaminidase) releases core 1 and core 3 type O-glycans (Galβ1-3GalNAc and GlcNAcβ1-3GalNAc) but not extended or substituted structures.
Table 1: Comparative Analysis of Glycan Release Methods
| Method | Target Glycan Type | Efficiency (%)* | Incubation Conditions | Key Advantages | Key Limitations |
|---|---|---|---|---|---|
| PNGase F | High-mannose, Hybrid, Complex N-Glycans | >95% (denatured) | 37°C, pH 7.5, 3-18h | High specificity, non-destructive, quantitative. | Ineffective on core α1-3 Fuc. |
| PNGase A | Plant/Insect N-Glycans (core α1-3 Fuc) | 80-90% | 37°C, pH 5.0-5.5, 18-24h | Releases PNGase F-resistant glycans. | Lower activity, acidic pH. |
| Non-Reductive β-Elim. | O-Glycans | 70-85% | 45°C, 16h | Preserves reducing end for labelling. | Peeling reaction possible, incomplete. |
| Reductive β-Elim. | O-Glycans | >90% | 45°C, 16h | High yield, prevents peeling. | Destroys reducing end; requires permethylation for MS. |
| O-Glycanase | Core 1/3 O-Glycans | 60-80% | 37°C, 3h | Specific, gentle, leaves peptide intact. | Extremely limited substrate range. |
*Efficiency is protein/substrate dependent.
Table 2: Optimized Reaction Conditions for Key Enzymes
| Reagent | Final Concentration | Purpose |
|---|---|---|
| SDS | 0.1% (w/v) | Protein denaturation. |
| β-Mercaptoethanol | 50 mM | Reduction of disulfide bonds. |
| NP-40 | 1-2% (v/v) | Neutralizes SDS, maintains enzyme activity. |
| Sodium Phosphate Buffer | 50 mM, pH 7.5 | Optimal buffer for PNGase F. |
| Sodium Acetate Buffer | 50 mM, pH 5.0 | Optimal buffer for PNGase A. |
| NaOH | 50-100 mM | Creates alkaline environment for β-elimination. |
| NaBH₄ (reductive) | 1 M | Reduces and stabilizes released O-glycans. |
The Scientist's Toolkit: Research Reagent Solutions
| Item | Function & Rationale |
|---|---|
| Recombinant PNGase F | High-purity, protease-free enzyme for quantitative N-glycan release without peptide cleavage. |
| Rapid PNGase F | Engineered enzyme for fast (minutes) digestion at higher temperatures (50°C), ideal for high-throughput workflows. |
| Glycan Release Buffer Kits | Pre-optimized, detergent-containing buffers for single-step denaturation and digestion, streamlining protocols. |
| 96-Well Plate Format SP | Solid-phase extraction plates (HLB, graphite carbon) for parallel cleanup of released glycans from multiple samples. |
| InstantPC | A surfactant/cleanup reagent that allows PNGase F digestion directly in SDS-PAGE gel bands, followed by passive elution. |
| 2-AB Labeling Kit | Optimized kit for fluorescent labeling of released glycans via reductive amination, essential for sensitive HILIC-UPLC detection. |
Workflow and Pathway Visualizations
Title: HILIC-UPLC N-Glycan Analysis Core Workflow
Title: Enzyme Specificity for N- and O-Glycan Release
Title: PNGase F Enzymatic Cleavage Mechanism
Within the HILIC-UPLC workflow for glycan analysis, fluorescent labelling is a critical step that imparts the necessary hydrophobicity and chromophoric properties for sensitive detection. This step directly influences quantitative accuracy, resolution, and downstream data quality. This guide details the optimization parameters for the 2-aminobenzamide (2-AB) and 2-anthranilic acid (2-AA) labelling reactions, which are the most prevalent in glycomics for therapeutic protein characterization.
Fluorescent Dye Chemistry & Selection
The choice of fluorophore dictates coupling efficiency, stability, and analytical performance.
| Fluorescent Tag | Reaction Mechanism | Primary Excitation/Emission (nm) | Key Advantages | Considerations |
|---|---|---|---|---|
| 2-Aminobenzamide (2-AB) | Reductive amination via Schiff base formation, using NaBH₃CN as a reducing agent. | 330 / 420 | High quantum yield, cost-effective, stable, minimal hydrophobicity shift. | Requires elevated temperature (60-65°C). |
| 2-Anthranilic Acid (2-AA) | Reductive amination (same as 2-AB). | 370 / 460 | Excellent sensitivity, good for MS coupling as it is a non-charged label. | Slightly higher background fluorescence potential. |
| Procalinamide (ProcA) | Reductive amination. | 310 / 370 | Imparts a strong positive charge, enhancing ESI-MS sensitivity. | Can alter HILIC retention; more expensive. |
| RapiFluor-MS (RFMS) | Instantaneous, non-reductive amination via an activated quinoline moiety. | 265 / 425 | Ultra-fast (<10 min), quantitative at room temperature, superior MS sensitivity. | Proprietary, specialized kit required. |
Quantitative data from recent literature and product manuals is synthesized below.
Table 1: Standardized Protocols for Common Fluorophores
| Parameter | 2-AB Labelling | 2-AA Labelling | RapiFluor-MS Labelling |
|---|---|---|---|
| Recommended Dye Concentration | 25-50 mM in DMSO:Acetic Acid (70:30 v/v) | 25-50 mM in DMSO:Acetic Acid (70:30 v/v) | Pre-formulated in kit (neat) |
| Reducing Agent | Sodium cyanoborohydride (NaBH₃CN), 1.0 M in THF | Sodium cyanoborohydride (NaBH₃CN), 1.0 M in THF | Not required |
| Reaction Stoichiometry (Glycan:Dye:Reductant) | 1:50:100 (molar ratio) | 1:50:100 (molar ratio) | 1:>100 (as per kit instructions) |
| Optimal Temperature | 60 ± 2 °C | 60 ± 2 °C or 37 °C overnight | Room Temperature (20-25 °C) |
| Optimal Time | 2-3 hours | 2-3 hours or 12-16 hours (overnight) | 5-10 minutes |
| Quenching/Completion | Dilution with 80% ACN | Dilution with 80% ACN | Addition of stop solution |
| Typical Yield | 70-85% (structure-dependent) | 75-90% (structure-dependent) | >95% (near quantitative) |
Detailed Experimental Protocol: 2-AB Labelling
This protocol is central to HILIC-UPLC glycan profiling for monoclonal antibodies.
Materials:
- Dried, purified N-glycans from your target protein (e.g., from PNGase F release).
- Labeling solution: 25 mM 2-AB in DMSO:Acetic Acid (70:30 v/v). Store in aliquots at -20°C, protected from light.
- Reducing solution: 1.0 M Sodium cyanoborohydride (NaBH₃CN) in Tetrahydrofuran (THF). CAUTION: Toxic. Prepare fresh or store under inert gas.
- Acetonitrile (ACN), HPLC grade.
- 0.2 mL PCR tubes or microcentrifuge tubes.
- Thermostatic heating block or PCR cycler.
Procedure:
- Sample Preparation: Ensure your dried glycan pellet is in the bottom of a 0.2 mL tube.
- Reagent Addition: In a dimmed light setting, add the following directly to the dried glycans:
- 2 µL of 25 mM 2-AB labelling solution.
- 2 µL of 1.0 M NaBH₃CN in THF.
- Mix thoroughly by pipetting and brief vortexing. Centrifuge to collect mixture at the tube bottom.
- Incubation: Seal the tube and incubate at 60°C for 2.5 hours in a heating block.
- Reaction Quenching & Dilution: After incubation, immediately add 96 µL of 80% ACN (v/v in water) to dilute and quench the reaction. The sample is now ready for purification (e.g., via HILIC-SPE) or direct injection onto a HILIC-UPLC system.
The labelling step is pivotal, linking upstream glycan release to downstream separation and analysis.
Diagram Title: HILIC-UPLC Glycan Analysis Workflow with Labelling Core
The Scientist's Toolkit: Key Reagents & Materials
Table 2: Essential Reagent Solutions for Fluorescent Labelling
| Item | Function & Role in Optimization |
|---|---|
| 2-AB or 2-AA Labelling Kit | Provides standardized, QC-tested reagents (dye, reductant, quenching buffer) ensuring reproducibility across experiments and laboratories. |
| RapiFluor-MS Labelling Kit | Proprietary optimized reagent system enabling rapid, quantitative labelling at room temperature, specifically designed for UPLC-MS workflows. |
| Sodium Cyanoborohydride (NaBH₃CN) | A mild, selective reducing agent critical for reductive amination. Stable at low pH, preventing glycan degradation. Must be fresh for optimal yield. |
| Dimethyl Sulfoxide (DMSO), Anhydrous | High-purity polar aprotic solvent that efficiently dissolves both glycans and fluorophores while stabilizing the reaction intermediate. |
| Acetonitrile (ACN), ≥99.9% HPLC Grade | Used in labelling solutions and for reaction quenching. High purity is essential to prevent fluorescent contaminants that increase baseline noise. |
| HILIC µElution SPE Plates (e.g., Waters ACQUITY) | For post-labelling purification to remove excess dye, salts, and reaction byproducts, minimizing artifacts in the final UPLC chromatogram. |
| PCR Plate or Strips with Sealing Mats | Allows for parallel processing of multiple samples under controlled, sealed conditions during the thermal incubation step. |
Within the analytical workflow for released and fluorescently labelled glycans, purification is a critical step following derivatization (e.g., with 2-AB, Procainamide) and prior to HILIC-UPLC analysis. Effective cleanup removes excess dye, salts, enzymes, and other reaction by-products that cause peak broadening, shifting retention times, and ion suppression. This guide provides an in-depth technical comparison of the two predominant strategies: Solid-Phase Extraction (SPE) and Membrane-Based Cleanup, within the context of high-sensitivity glycomics for biopharmaceutical development.
Technical Comparison of SPE and Membrane-Based Cleanup
The table below summarizes the core operational and performance characteristics of both techniques based on current methodologies.
Table 1: Comparative Analysis of SPE and Membrane-Based Cleanup for Fluorescently Labelled Glycans
| Feature/Aspect | Solid-Phase Extraction (SPE) | Membrane-Based Cleanup (e.g., 96-well plates) |
|---|---|---|
| Core Principle | Selective adsorption/desorption from a packed sorbent bed. | Size-exclusion or hydrophilic interaction on an ultra-filtration membrane. |
| Typical Format | Cartridges (1-6 mL) or 96-well plates. | Primarily 96-well plate format for high-throughput. |
| Common Sorbent/Membrane | Porous graphitized carbon (PGC), C18, silica. | Hydrophilic-modified polyethersulfone (PES) or regenerated cellulose. |
| Primary Mechanism | Reversed-phase (C18) or polar (PGC) interactions. | Molecular weight cut-off (MWCO) filtration (e.g., 10 kDa) combined with hydrophilic repulsion of glycans. |
| Throughput Potential | Moderate to High (with plate formats). | Very High (centrifugation or vacuum manifold processing). |
| Manual Hands-on Time | Higher (conditioning, equilibration, multiple steps). | Lower (often a single transfer and centrifugation step). |
| Elution/Sample Recovery | Requires optimization of elution solvent (e.g., ACN/H2O). | Recovery by centrifugation; sample is the filtrate. |
| Key Advantage | Excellent removal of hydrophobic dye impurities (via C18). | Rapid, consistent, minimal sample manipulation. |
| Key Limitation | Potential for glycan loss on irreversible binding sites. | Less effective if dye aggregates or interacts with membrane. |
| Typical Sample Volume | 100 µL - 1 mL | 50 - 200 µL |
| Best Suited For | Complex samples, when stringent removal of dye is critical. | High-throughput labs prioritizing speed and simplicity. |
Detailed Experimental Protocols
Protocol 3.1: Solid-Phase Extraction Using PGC Cartridges for 2-AB Labelled Glycans
This protocol is optimized for the purification of acidic and neutral glycans using porous graphitized carbon, known for its strong retention of oligosaccharides.
Materials:
- PGC SPE cartridges (e.g., 100 mg, 1 mL bed volume).
- Conditioning Solution: 80% Acetonitrile (ACN) / 0.1% Trifluoroacetic acid (TFA) in water (v/v).
- Equilibration/Wash Solution: 0.1% TFA in water.
- Elution Solution: 40% ACN / 0.1% TFA in water (v/v). For more complex glycans, a step gradient (e.g., 25%, 40% ACN) may be used.
- Vacuum manifold or centrifuge for 96-well plates.
Method:
- Conditioning: Load 1 mL of Conditioning Solution (80% ACN/0.1% TFA) onto the PGC cartridge. Apply vacuum or centrifuge until dry (~1 min).
- Equilibration: Load 1 mL of Equilibration Solution (0.1% TFA) onto the cartridge. Apply vacuum/centrifuge to pass through completely. Do not let the cartridge dry after this step.
- Sample Loading: Dilute the glycan labelling reaction mixture with 0.1% TFA to a final ACN concentration of <5%. Load the entire sample onto the conditioned cartridge.
- Washing: Pass 1 mL of Equilibration Solution (0.1% TFA) through the cartridge to remove salts, proteins, and excess hydrophilic contaminants.
- Elution: Place a clean collection tube. Pass 1 mL of Elution Solution (40% ACN/0.1% TFA) through the cartridge to recover the purified glycans.
- Concentration: Dry the eluate in a vacuum concentrator for subsequent HILIC-UPLC analysis.
Protocol 3.2: Membrane-Based Cleanup Using a 96-Well Hydrophilic Filtration Plate
This protocol describes a high-throughput method based on hydrophilic interaction and size exclusion.
Materials:
- 96-well hydrophilic filtration plate (e.g., 0.45 µm hydrophilic PVDF or PES membrane, or specialized glycan cleanup plates with ~10 kDa MWCO).
- Wash Solution: 96% Acetonitrile (ACN).
- Collection microplate (96-well).
- Microplate centrifuge or positive pressure manifold.
Method:
- Plate Priming: Add 200 µL of Wash Solution (96% ACN) to each well of the filtration plate. Centrifuge at 1,000 x g for 1 minute. Discard the flow-through.
- Sample Application: Dilute the glycan labelling reaction 1:10 to 1:20 with 96% ACN. Typically, mix 5 µL of reaction with 95 µL of 96% ACN. Load the entire volume (100 µL) onto the center of the membrane.
- Filtration/Cleanup: Place the filtration plate on top of a collection plate. Centrifuge at 1,000 x g for 3-5 minutes. The labelled glycans (small, hydrophilic) pass through the membrane. Excess dye (hydrophobic, may aggregate), enzymes, and other high-MW contaminants are retained.
- Sample Recovery: The purified glycans are collected in the microplate in a solution of high ACN concentration, ready for direct injection or drying and reconstitution in a HILIC-compatible solvent.
Visualization of the Purification Decision Workflow
Title: Decision Workflow for Selecting Glycan Purification Strategy
The Scientist's Toolkit: Essential Reagents and Materials
Table 2: Key Research Reagent Solutions for Glycan Purification
| Item/Category | Specific Example(s) | Function in Purification |
|---|---|---|
| SPE Sorbents | Porous Graphitized Carbon (PGC); C18-bonded silica | Selective retention of glycans based on polarity/hydrophobicity for impurity separation. |
| Filtration Membranes | Hydrophilic PVDF; Polyethersulfone (PES) with HILIC surface | Size-exclusion and hydrophilic interaction to pass glycans while retaining contaminants. |
| 96-Well Purification Plates | Glycan Cleanup Plates (e.g., with integrated membrane) | Enable high-throughput, parallel processing of multiple samples with minimal variability. |
| Solvents for SPE | Acetonitrile (ACN) with 0.1% TFA; Ultrapure Water | Form the conditioning, washing, and elution gradients critical for selective SPE binding. |
| Solvents for Membrane Wash | 96% Acetonitrile (ACN) | Prime the membrane and create optimal conditions for glycan passage in HILIC-mode cleanup. |
| Fluorescent Dyes | 2-Aminobenzamide (2-AB), Procainamide | Label reducing glycans, enabling detection; their properties dictate cleanup requirements. |
| Vacuum Concentrator | Centrifugal evaporator | Gently removes volatile elution solvents post-purification for sample reconstitution. |
| Collection Vessels | 1.5 mL Lo-bind tubes; 96-well PCR plates | Minimize adsorptive loss of low-abundance purified glycans during processing and storage. |
This technical guide details the critical fourth step in a HILIC-UPLC workflow for the analysis of released and fluorescently labeled glycans, a core technique in biopharmaceutical characterization and biomarker research. Precise instrument configuration is paramount for achieving high-resolution separations, reproducible quantification, and accurate structural assignment of complex glycan mixtures.
HILIC Column Selection for Labeled Glycans
The selection of a hydrophilic interaction liquid chromatography (HILIC) column is foundational. Performance is governed by the stationary phase chemistry, particle size, pore size, column dimensions, and temperature stability.
Key Column Chemistries:
- Amide (Polymer or Silica-based): The most widely used phase for labeled glycans (e.g., 2-AB, 2-AA, Procainamide). Offers robust, reproducible separations based on glycan size, polarity, and linkage. Polymer-based versions provide excellent stability at high temperatures and over a wide pH range.
- BEH Amide (Ethylene Bridged Hybrid): Combines the advantages of amide chemistry with BEH particle robustness, enabling use at higher pressures and temperatures (up to 60-90°C), which enhances resolution.
- Diol: A less retentive alternative, sometimes used for very polar or sialylated glycans.
Selection Criteria Summary:
Table 1: HILIC Column Selection Criteria for Fluorescently Labeled Glycans
| Parameter | Recommended Specification | Rationale & Impact |
|---|---|---|
| Stationary Phase | Bridged Ethylene Hybrid (BEH) Amide | Superior resolution, high temperature/pH stability, and long column lifetime. |
| Particle Size | 1.7 µm | Optimal for UPLC performance, offering high efficiency and resolution. |
| Pore Size | 130 Å or 100 Å | Suitable for most glycan analytes; larger pores (e.g., 300 Å) may be used for very large glycans. |
| Column Dimensions | 2.1 x 100 mm or 2.1 x 150 mm | Standard for UPLC; longer columns increase resolution at the cost of run time and pressure. |
| Temperature Rating | Up to 60-90°C | Enables operation at elevated temperatures to improve peak shape and resolution. |
Protocol 2.1: Column Conditioning and Equilibration
- Connect the new column to the UPLC system according to manufacturer instructions.
- Flush sequentially with 10-15 column volumes (CV) of the following solvents at a slow flow rate (e.g., 0.2 mL/min):
- a. Water or starting mobile phase buffer.
- b. Acetonitrile.
- c. Initial gradient starting conditions (e.g., 75-80% Acetonitrile, 20-25% Aqueous buffer).
- Perform 5-10 blank gradient runs to establish a stable baseline before analyzing samples.
Mobile Phase Preparation
Consistent, high-purity mobile phases are essential for reproducible retention times and sensitive detection.
Aqueous Buffer (Mobile Phase A):
- Typical Composition: 50-200 mM ammonium formate, pH 4.4-4.5.
- Function: Provides ionic strength to control selectivity and a slightly acidic pH to protonate sialic acids, ensuring consistent elution.
Organic Modifier (Mobile Phase B):
- Typical Composition: 100% Acetonitrile (HPLC/UPLC grade).
- Function: The strong solvent in HILIC that promotes retention. Higher %B increases glycan retention time.
Protocol 3.1: Preparation of 100 mM Ammonium Formate Buffer, pH 4.5
- Weigh 6.305 g of ammonium formate (HCOONH₄, MW 63.05 g/mol) and transfer to a 1 L volumetric flask.
- Add approximately 900 mL of ultrapure water (18.2 MΩ·cm) and dissolve completely.
- Adjust the pH to 4.50 using concentrated formic acid. Use a calibrated pH meter.
- Make up to the final volume of 1 L with ultrapure water.
- Filter the buffer through a 0.22 µm nylon or PVDF membrane filter into a clean, dedicated solvent bottle.
- Degas by sonication or sparging with helium for 10 minutes before use.
Mobile Phase Handling:
- Prepare fresh aqueous buffer weekly. Store at room temperature.
- Use dedicated HPLC-grade solvents. Filter all mobile phases (0.22 µm).
- Degas solvents to prevent air bubble formation in pumps and detectors.
UPLC Instrument Parameters
Optimized UPLC parameters ensure maximum separation efficiency, sensitivity, and throughput.
Table 2: Standard UPLC Parameters for 2-AB Labeled N-Glycan Analysis
| Parameter | Recommended Setting | Notes |
|---|---|---|
| Column Temperature | 40°C - 60°C | Higher temp (60°C) improves resolution of larger glycans. |
| Sample Temperature | 4°C - 10°C | Maintains sample stability in the autosampler. |
| Flow Rate | 0.3 - 0.6 mL/min | For 2.1 mm I.D. columns. Adjust based on column length and pressure limits. |
| Injection Volume | 1 - 10 µL | Dependent on glycan concentration and detector sensitivity. |
| Fluorescence Detection | λex = 330 nm, λem = 420 nm | Optimal for 2-AB label. Adjust for other fluorophores (e.g., Procainamide: λex 310 nm, λem 370 nm). |
| Gradient Profile | See Protocol 4.1 | Linear or multi-step gradient from high to low %B. |
Protocol 4.1: Establishing a Generic HILIC-UPLC Gradient for N-Glycans
- Column: BEH Amide, 1.7 µm, 2.1 x 100 mm.
- Flow Rate: 0.4 mL/min.
- Temperature: 60°C.
- Detection: FLD (λex 330 nm, λem 420 nm).
Table 3: Generic Gradient Table
| Time (min) | % Mobile Phase A (Aqueous Buffer) | % Mobile Phase B (Acetonitrile) | Curve |
|---|---|---|---|
| Initial | 25 | 75 | - |
| 0.0 | 25 | 75 | Initial |
| 45.0 | 45 | 55 | 6 (Linear) |
| 46.0 | 100 | 0 | 11 (Step) |
| 48.0 | 100 | 0 | 11 (Hold) |
| 48.1 | 25 | 75 | 11 (Step) |
| 55.0 | 25 | 75 | 11 (Re-equilibration) |
System Suitability Test: Prior to sample analysis, inject a standard dextran ladder or a well-characterized glycan pool (e.g., from human IgG) to confirm resolution, retention time reproducibility, and peak shape.
The Scientist's Toolkit: Essential Research Reagents & Materials
Table 4: Key Reagent Solutions for HILIC-UPLC Glycan Analysis
| Item | Function / Description | Example Product/Chemical |
|---|---|---|
| HILIC UPLC Column | High-resolution separation of hydrophilic, labeled glycans. | Waters ACQUITY UPLC Glycan BEH Amide, 1.7 µm, 2.1 x 100 mm. |
| Ammonium Formate | Salt for preparing the aqueous mobile phase buffer. | HPLC-grade, ≥99.0% purity. |
| Formic Acid | Used to adjust the pH of the aqueous buffer to ~4.5. | LC-MS grade, ≥98% purity. |
| Acetonitrile (ACN) | Organic mobile phase (Mobile Phase B) in HILIC. | HPLC/UPLC grade, low UV absorbance. |
| Ultrapure Water | Base for all aqueous solutions; prevents contaminants. | 18.2 MΩ·cm resistivity, from a purification system. |
| Fluorescent Label | Tags released glycans for sensitive fluorescence detection. | 2-Aminobenzamide (2-AB), Procainamide. |
| Labeling Dye | Reductive amination agent for labeling. | Sodium cyanoborohydride (NaBH₃CN) in DMSO. |
| Glycan Standards | For system suitability, calibration, and identification. | 2-AB labeled dextran ladder, IgG N-glycan standard. |
| Syringe Filters | For filtering mobile phases and sample preparations. | 0.22 µm, Nylon or PVDF membrane, 13 mm diameter. |
| LC Vials/Inserts | For sample introduction into the UPLC autosampler. | Clear glass vials with low-volume inserts (e.g., 250 µL). |
Visualized Workflows
HILIC-UPLC Setup Workflow
HILIC Retention & Elution Mechanism
Within the comprehensive HILIC-UPLC workflow for the analysis of released and fluorescently labeled glycans, the data acquisition and initial processing step is critical for transforming raw chromatographic signals into reliable, analyzable data. This stage directly impacts the accuracy of glycan profiling, quantification, and subsequent structural elucidation, which are essential for biopharmaceutical development, particularly for monoclonal antibodies and other glycoprotein therapeutics.
Core Principles of Data Acquisition
Data acquisition in glycan analysis involves capturing the detector response over time as labeled glycans are separated by HILIC-UPLC. The primary detector is a fluorescent (FLR) detector, with common excitation/emission settings of 265/425 nm for 2-AB labeled glycans. A photodiode array (PDA) detector may be used in tandem for additional spectral confirmation.
Key Acquisition Parameters:
- Data Rate: Typically 10-20 Hz to ensure sufficient data points across narrow UPLC peaks.
- Channel Configuration: Primary FLR channel, secondary UV/Vis channel (e.g., 265 nm for label detection).
- Injection Volume Precision: Critical for quantitative reproducibility.
- Autosampler Temperature Control: Maintains sample stability during the run sequence.
Initial Data Processing in Empower
Initial processing transforms the acquired chromatogram into a report of integrated peaks, each representing a glycan structure. The process follows a defined workflow.
Diagram Title: Empower Initial Data Processing Workflow
Peak Integration Methodology
- Integration Algorithm Selection: Use the "Traditional" or "ApexTrack" algorithm. ApexTrack is often preferred for complex, partially resolved HILIC peaks.
- Peak Width & Threshold: Set appropriately (e.g., peak width 0.05-0.1 min, threshold 5-10 µV) to capture minor glycan peaks without integrating noise.
- Baseline Drawing: Use "Baseline to Valley" for well-resolved peaks. For crowded regions, "Drop Baseline" or "Exponential Skim" may be applied.
- Manual Review & Integration Events: Essential step. Scientists must visually inspect and apply consistent integration events (e.g., "Force Peak Start/End", "Baseline-to-Baseline") across all samples in the batch.
Peak Alignment and System Suitability
Peaks are aligned using a reference standard, typically a hydrolyzed and labeled glucose homopolymer (GHP) ladder.
Table 1: Representative GHP Ladder Data for Alignment
| GHP DP* | Expected RT (Min) | Use in Processing |
|---|---|---|
| 1 | ~5.2 | System Check |
| 2 | ~7.1 | Void Marker |
| 3 | ~9.0 | - |
| 4 | ~10.8 | Primary Anchor |
| 5 | ~12.5 | Secondary Anchor |
| 6 | ~14.1 | Tertiary Anchor |
*DP: Degree of Polymerization
- Alignment Method: In the Processing Method, the "Peak Matching" table is configured. The GHP peaks (e.g., DP4, DP5, DP6) are assigned as Reference Peaks. Sample glycan peaks are matched to these references based on retention time windows (e.g., ±0.1 min with %RT windows).
- System Suitability: The relative standard deviation (RSD%) of the retention times for the GHP peaks across the sequence must be <1.0% to confirm chromatographic stability.
Quantification and Calibration
Quantification of glycans is typically performed using relative percent area (%Area).
Detailed Protocol: Relative Quantification
- Integration: Ensure all glycan peaks in a sample are correctly integrated.
- Total Area: The software sums the area of all integrated peaks identified as glycans (excluding solvent front, reagent peaks, etc.).
- %Area Calculation: For each individual glycan peak, %Area = (Individual Peak Area / Total Glycan Peak Area) × 100.
- Reporting: Results are reported in a custom field, generating a table of Glycan IDs (by GU value) and their corresponding %Area for each injection.
Table 2: Example Processed Data Output for a Monoclonal Antibody N-Glycan Profile
| Peak ID | GU Value | RT (Min) | Area | %Area | RSD% of %Area (n=3) |
|---|---|---|---|---|---|
| G0F | 5.89 | 10.21 | 125450 | 45.2 | 0.8 |
| G1F | 6.21 | 11.02 | 85600 | 30.8 | 1.1 |
| G2F | 6.54 | 11.89 | 52300 | 18.8 | 1.5 |
| Man5 | 7.95 | 15.43 | 10500 | 3.8 | 2.3 |
| G0F-GN | 5.12 | 8.87 | 4200 | 1.5 | 5.6 |
The Scientist's Toolkit: Essential Research Reagent Solutions
Table 3: Key Materials for HILIC-UPLC Data Acquisition & Processing
| Item | Function in Workflow |
|---|---|
| Empower 3 or Waters UNIFI | Primary CDS software for instrument control, data acquisition, processing, and reporting. |
| Agilent OpenLAB CDS or Thermo Fisher Chromeleon | Alternative chromatography data systems with similar functionality for non-Waters instruments. |
| 2-AB Labeled GHP Ladder | Hydrolyzed glucose polymer labeled with 2-AB. Serves as the essential retention time alignment standard for converting RT to GU values. |
| Processed Sample Comparator (PSC) | A control sample (e.g., a characterized mAb digest) run intermittently to monitor system performance and processing consistency over time. |
| Custom Processing Method (.xml) | Empower file containing all integration, peak matching, and calculation parameters for consistent batch processing. |
| Custom Report Method (.rmth) | Empower template for automated generation of summary tables and system suitability reports. |
| GU Value Library | A reference database of glycan structures and their empirically determined Glucose Unit values for peak identification. |
Advanced Processing: From GU Value to Identification
Initial processing yields peaks with GU values. Identification involves comparing sample GU values to a reference library.
Diagram Title: Glycan Identification Workflow Post-Processing
Protocol: Exoglycosidase Sequencing for Validation (Example)
- Isolate Pooled Glycans: Collect and dry the fraction corresponding to a peak of interest from multiple HILIC runs.
- Digest: Reconstitute in appropriate buffer and incubate with a specific exoglycosidase (e.g., Arthrobacter ureafaciens sialidase to remove α2-3/6 linked sialic acids).
- Re-analyze: Inject the digested sample and compare the GU shift to the original peak. A loss corresponding to the monosaccharide removed confirms its presence and linkage.
Rigorous execution of Step 5, Data Acquisition and Initial Processing, is foundational for the integrity of the entire HILIC-UPLC glycan profiling workflow. Mastery of the CDS software, meticulous attention to integration parameters, strict adherence to alignment and system suitability criteria, and proper use of standard materials ensure that the quantitative and qualitative data generated is robust, reproducible, and fit for purpose in critical drug development applications.
Solving Common HILIC-UPLC Challenges for Perfect Peaks
Within the broader thesis on establishing a robust, high-throughput HILIC-UPLC workflow for the analysis of released and fluorescently labeled glycans (e.g., 2-AB, 2-AA, RapiFluor-MS), achieving and maintaining optimal chromatographic resolution is paramount. This technical guide addresses three interconnected, core parameters—column age, temperature, and gradient—that are critical for troubleshooting poor resolution, a common bottleneck impacting glycan profiling accuracy and reproducibility in biopharmaceutical development.
Core Parameter Analysis and Quantitative Data
The Impact of Column Age and Performance Degradation
Column degradation is a primary cause of declining resolution in HILIC glycan analysis. Key failure modes include:
- Stationary Phase Loss: Silica-based phases can hydrolyze, especially at higher pH and temperature.
- Pore Blockage: Accumulation of strongly retained sample components or contaminants.
- High-Pressure Frit Blockage: Particulate matter from samples or mobile phases.
Quantitative indicators of column aging are summarized in Table 1.
Table 1: Quantitative Indicators of HILIC Column Aging and Their Impact
| Performance Indicator | New Column Benchmark | Aged Column Symptom | Typical Acceptability Threshold |
|---|---|---|---|
| Theoretical Plates (N) | >15,000 plates/meter | Decrease of 20-50% | <30% decrease from initial |
| Peak Asymmetry (As) | 0.8 - 1.2 | Increase to >1.5 | >1.4 |
| Back Pressure | Vendor specification (e.g., ~1000 psi) | Increase of 20-50% | >30% increase from initial |
| Retention Time Shift (ΔtR) | Stable (RSD < 0.5%) | Progressive shortening (>2% shift) | >2% cumulative shift |
The Role of Column Temperature
Temperature directly influences retention, selectivity, and backpressure in HILIC. Its optimization is non-linear and interdependent with the gradient.
Table 2: Effect of Temperature Variation on HILIC Separation Parameters
| Temperature | Retention (k) | Selectivity (α) | Peak Shape | Backpressure | Recommended Range for Glycans |
|---|---|---|---|---|---|
| Low (e.g., 25°C) | Increased | Higher | Often broader | Higher | Baseline for method scouting |
| High (e.g., 60°C) | Decreased | Lower | Sharper | Lower | 40-60°C for complex mixtures |
| Optimal | Balanced for resolution | Maximized for critical pairs | Sharp, symmetrical | Stable | 40-55°C (empirically determined) |
Gradient Optimization Principles
The gradient slope (change in strong solvent %B per minute) is the primary tool for manipulating resolution (Rs). The relationship is governed by the fundamental resolution equation. For HILIC, a shallower gradient increases resolution but extends run time and dilutes peaks.
Table 3: Gradient Optimization Effects on Resolution and Runtime
| Gradient Slope | Example | Impact on Resolution (Rs) | Impact on Run Time | Application |
|---|---|---|---|---|
| Steep | 75% to 50%B in 10 min | Lower Rs, potential co-elution | Short (~15 min total) | Simple glycan pools, QC |
| Shallow | 75% to 50%B in 40 min | Higher Rs, better separation | Long (~50 min total) | Complex samples, isomer separation |
| Multi-step/Curved | Initial shallow segment, then steep | Targets specific Rs in critical region | Medium | Optimal for most N-glycan profiles |
Integrated Experimental Protocol for Systematic Troubleshooting
Protocol 1: Diagnostic Run to Isolate the Cause of Poor Resolution
- Objective: Determine if poor resolution stems from column degradation, suboptimal temperature, or an ill-suited gradient.
- Materials: Standard labeled N-glycan ladder (e.g., 2-AB labeled glucose homopolymer or human IgG N-glycan standard), fresh mobile phases (A: 50mM ammonium formate, pH 4.4; B: Acetonitrile), HILIC-UPLC system (e.g., ACQUITY UPLC, Thermo Vanquish).
- Method:
- Install the suspect column and equilibrate at standard conditions (e.g., 45°C, initial %B).
- Inject the standard using the original method gradient. Record performance metrics (Table 1).
- Perform a temperature gradient run: Inject the same standard with a linear temperature ramp from 30°C to 60°C over the analytical gradient duration. Note if resolution improves in a specific temperature window.
- Perform a gradient slope test: At the temperature identified in step 3 (or the original temperature), run three gradients: the original, one 25% shallower, and one 25% steeper.
- Analysis: Compare plate counts, asymmetry, and resolution of key critical pairs (e.g., FA2/FA2G1, G1F/G1F isomers) across all runs. If plate count is low and asymmetry high despite temperature/gradient changes, column aging is likely the root cause. If plate count is acceptable, optimal temperature and gradient can be identified from steps 3 and 4.
Protocol 2: Column Cleaning and Revalidation
- Objective: Attempt to restore column performance and confirm functionality.
- Method:
- Reverse-flush the column according to manufacturer's instructions.
- Implement a stepwise cleaning gradient: Flush with 50:50 Water:ACN (no salt) for 10 column volumes (CV), then 95:5 Water:ACN for 20 CV, then return to starting conditions.
- Re-equilibrate with the analytical mobile phase for 15-20 CV.
- Repeat the diagnostic run (Protocol 1, step 2) and compare metrics to Table 1 benchmarks.
- Decision Point: If performance metrics are restored within acceptability thresholds, the column can be returned to service. If not, replacement is required.
Protocol 3: Empirical Optimization of Temperature and Gradient
- Objective: Establish a new method baseline for a new or cleaned column.
- Method:
- Using a design of experiment (DoE) approach or a univariate search, create a short series of runs varying temperature (e.g., 40°C, 50°C, 60°C) and gradient time (e.g., 20 min, 40 min, 60 min).
- For each run, calculate the resolution (Rs) between the two least-resolved peaks in the standard (the critical pair).
- Plot response surfaces of Rs vs. Temperature and Gradient Time.
- Select the condition that delivers Rs > 1.5 for the critical pair within an acceptable run time.
Visualizing the Systematic Troubleshooting Workflow
Title: Systematic Troubleshooting Workflow for HILIC Resolution
The Scientist's Toolkit: Key Research Reagent Solutions
Table 4: Essential Materials for HILIC-UPLC Glycan Analysis
| Item | Function & Importance |
|---|---|
| Chromatography Column: e.g., Waters ACQUITY UPLC Glycan BEH Amide, 1.7µm, 2.1x150mm | The core HILIC stationary phase. Particle size (<2µm) enables UPLC performance. Column dimensions balance resolution, sensitivity, and solvent use. |
| Fluorescent Label: e.g., 2-Aminobenzoic Acid (2-AB), RapiFluor-MS | Imparts UV/fluorescence detection capability and enhances ionization for MS. Critical for high-sensitivity analysis of released glycans. |
| Labeled Glycan Standard: e.g., 2-AB labeled N-Glycan Standard from human IgG | Essential system suitability test for troubleshooting. Provides known retention times and critical peak pairs for resolution measurement. |
| Mobile Phase Additives: Ammonium formate (or acetate), LC-MS grade | Provides volatile buffer system for consistent HILIC retention (ionic strength) and MS compatibility. pH (~4.4) is critical for sialylated glycan analysis. |
| Organic Solvent: LC-MS Grade Acetonitrile (≥99.9%) | The strong solvent (B) in HILIC. Purity is paramount to avoid high-background noise and ghost peaks. |
| Column Regeneration Solvents: LC-MS Grade Water, Isopropanol | High-purity solvents for cleaning protocols to remove strongly retained contaminants and restore column performance. |
Within the high-resolution analytical framework of Hydrophilic Interaction Liquid Chromatography coupled with Ultra-Performance Liquid Chromatography (HILIC-UPLC), the quality of data is fundamentally dependent on the initial sample preparation steps. The release of glycans from glycoproteins and their subsequent fluorescent labeling are critical, yet often problematic, junctures where significant yield loss can occur. This guide details the technical challenges and optimized protocols to ensure efficient release and labeling reactions, maximizing analyte yield for robust and reproducible HILIC-UPLC profiling in glycomics research and biotherapeutic development.
Core Challenges in Release and Labeling
The primary causes of low yield in glycan sample preparation are multifaceted. Inefficient enzymatic cleavage, incomplete labeling, and sample loss during cleanup are predominant contributors. Recent search data highlights key quantitative benchmarks for expected yields.
Table 1: Typical Yield Ranges and Pitfalls in Glycan Workflow Steps
| Workflow Step | Target Yield Range | Common Pitfalls Leading to Low Yield |
|---|---|---|
| Enzymatic Release (PNGase F) | >95% (from glycoprotein) | Denaturation of protein substrate, insufficient enzyme:substrate ratio, suboptimal incubation time/temp, presence of detergents inhibiting enzyme. |
| Fluorescent Labeling (2-AB) | 70-90% (of released glycans) | Impure glycan pool (salts, detergents), expired or suboptimal labeling reagent, insufficient reductant (NaBH3CN), improper reaction volume leading to reagent concentration issues. |
| Post-Labeling Cleanup | >85% Recovery | Overloading cleanup cartridges (HILIC, SPE), improper solvent composition for binding/elution, sample drying beyond complete dryness causing irreversible adsorption. |
Optimized Experimental Protocols
High-Efficiency N-Glycan Release with PNGase F
Principle: PNGase F cleaves between the innermost GlcNAc and asparagine residue of N-glycans. Complete denaturation of the glycoprotein is essential for enzyme access.
Protocol:
- Denaturation: Dissolve up to 100 µg of glycoprotein in 50 µL of ultra-pure water. Add 50 µL of 2x denaturation buffer (100 mM Ammonium Bicarbonate, pH 8.0, 0.1% SDS). Heat at 60°C for 10 minutes.
- Detergent Neutralization: Cool the sample. Add 25 µL of 5% (v/v) Igepal CA-630 (Nonidet P-40 substitute) to neutralize SDS, which inhibits PNGase F. Vortex thoroughly.
- Enzymatic Digestion: Add 5 µL (50 U) of recombinant PNGase F (e.g., Promega, #V4831). Mix gently and incubate at 37°C for 18 hours (overnight). Note: For complex samples, a 3-5x higher enzyme amount or extended incubation to 24h may be used.
- Termination & Storage: The reaction can be terminated by heating at 65°C for 10 min. Released glycans can be stored at -20°C prior to labeling.
Maximized Fluorescent Labeling with 2-Aminobenzoic Acid (2-AB)
Principle: Reductive amination attaches the fluorophore (2-AB) to the reducing end of the glycan via a stable bond. Excess reagent and a reducing agent (NaBH3CN) are required to drive the reaction to completion.
Protocol:
- Reagent Preparation: Prepare a fresh 2-AB labeling solution: 48 mg/mL 2-AB (Sigma, #A89804) and 64 mg/mL Sodium cyanoborohydride (NaBH3CN, Sigma, #156159) in a mixture of DMSO:Acetic Acid (70:30 v/v). Sonicate to dissolve.
- Labeling Reaction: Transfer the entire released glycan sample (from step 3.1) into a clean PCR tube. Dry completely in a vacuum concentrator (avoid over-drying).
- Resuspend the dried glycans in 25 µL of the freshly prepared 2-AB labeling solution. Vortex thoroughly and spin down.
- Incubate at 65°C for 2 hours in a thermal cycler or oven.
- Termination: The reaction is terminated by drying the mixture under vacuum.
Workflow Visualization
Diagram Title: HILIC-UPLC Glycan Sample Prep Workflow
Diagram Title: Core Chemical/Enzymatic Reactions
The Scientist's Toolkit: Essential Research Reagents
Table 2: Key Reagents for Efficient Release & Labeling
| Item | Function & Rationale | Example Product (Supplier) |
|---|---|---|
| Recombinant PNGase F | High-purity, glycerol-free enzyme for maximum activity and minimal interference in downstream steps. Essential for complete release. | PNGase F (Promega, V4831) |
| 2-Aminobenzoic Acid (2-AB) | Common, cost-effective fluorescent label with good sensitivity and HILIC compatibility. Must be of high purity for consistent labeling efficiency. | 2-AB (Sigma, A89804) |
| Sodium Cyanoborohydride | Reducing agent for reductive amination. More stable and selective than NaBH4. Critical for driving labeling reaction. Handle with care (toxic). | NaBH3CN (Sigma, 156159) |
| Igepal CA-630 | Non-ionic detergent used to neutralize SDS after denaturation, creating a compatible environment for PNGase F activity. | Igepal CA-630 (Sigma, 18896) |
| HILIC µElution Plates | For high-recovery cleanup of labeled glycans. Stationary phase (e.g., BEH Amide) removes excess dye and salts prior to UPLC. Minimizes sample loss. | GlycoWorks HILIC µElution Plate (Waters, 186004800) |
| Anhydrous DMSO | High-quality, dry dimethyl sulfoxide is the optimal solvent for preparing labeling reagent to prevent hydrolysis of NaBH3CN. | Anhydrous DMSO (Sigma, 276855) |
Within the critical HILIC-UPLC workflow for analyzing released and fluorescently labeled glycans in biotherapeutic drug development, baseline noise and peak tailing are primary adversaries. These chromatographic artifacts compromise precise peak integration, accurate quantification, and robust structural assignment, directly impacting the reliability of critical quality attribute (CQA) assessments. This guide delves into the root causes of these issues, with a focused thesis on how mobile phase optimization and rigorous sample cleanup form the foundational pillars for achieving high-fidelity glycan profiling data.
Root Causes in the HILIC-UPLC Glycan Analysis Context
Baseline noise and tailing in HILIC separations of glycans are seldom independent; they often stem from interrelated system and sample contaminants.
- Baseline Noise Sources: Chemical noise frequently originates from impure mobile phase components (e.g., amine modifiers like ammonium formate/acetate), fluorescent dye contaminants (from the labeling reagent), or leachates from system components. A high baseline drift can also occur due to inadequate mobile phase equilibration under HILIC conditions or temperature fluctuations.
- Peak Tailing Sources: Tailing is primarily a symptom of secondary interactions. In HILIC, these include ionic interactions with residual silanols on the stationary phase and hydrophobic interactions with the underlying silica matrix. Sample-related matrix effects (e.g., salts, proteins, excess labeling reagent) that are not fully removed during cleanup are a major contributor.
Mobile Phase Optimization for Enhanced Signal-to-Noise
The mobile phase is not merely a carrier; it is a central parameter controlling efficiency and selectivity.
Salt (Buffer) Selection and Purification
High-purity, volatile buffers are mandatory. Ammonium formate and ammonium acetate are standards, but their grade is crucial.
Table 1: Mobile Phase Buffer Optimization for HILIC-UPLC of Labeled Glycans
| Buffer Parameter | Recommendation | Rationale & Impact on Noise/Tailing |
|---|---|---|
| Salt Purity | LC-MS grade or better (>99%). | Minimizes UV/fluorescence background noise and column contamination. |
| Concentration | 50-100 mM ammonium formate/acetate. | Adequate ionic strength suppresses silanol interactions (reduces tailing); higher concentrations may increase noise. |
| pH (aqueous buffer) | 4.0-4.5 (ammonium formate). | Protonates silanols and sialic acids, reducing ionic tailing. Optimizes charge state consistency. |
| Preparation Method | Weigh solid salt, dissolve in HPLC-grade water, filter (0.22 µm Nylon). | Prevents microbial growth and particulate introduction. Never use buffer salts to adjust pH of pre-made solutions. |
| Organic Modifier | Acetonitrile (ACN), >99.9% HPLC gradient grade. | Lower UV-cutoff ACN reduces baseline drift and noise. Ensure minimal water content in the "organic" mobile phase reservoir. |
Mobile Phase Additives and Equilibration
- Additives: Adding 0.1-0.5% (v/v) trifluoroacetic acid (TFA) can dramatically improve peak shape for sialylated glycans by acting as an ion-pairing agent. However, it may suppress MS signal and must be used judiciously.
- Equilibration: HILIC requires extensive column equilibilation. A minimum of 10-15 column volumes between runs is essential to establish a stable water layer on the stationary phase, preventing retention time drift and baseline shifts.
Sample Cleanup Protocols for Optimal Peak Shape
Effective removal of labeling byproducts and sample matrix is non-negotiable.
Protocol 1: Solid-Phase Extraction (SPE) using Porous Graphitized Carbon (PGC) or Hydrophilic Interaction (HLB)
Purpose: Remove excess fluorescent dye (e.g., 2-AB, ProA), salts, and detergents.
Detailed Methodology:
- Conditioning: Activate a PGC or HLB SPE cartridge with 3 mL of ACN, followed by 3 mL of HPLC-grade water.
- Loading: Dilute the labeled glycan sample 10-fold with water (to increase aqueous content) and load onto the cartridge.
- Washing: Wash with 3-5 mL of 0.1% TFA in water to remove ionic contaminants and unreacted dye.
- Elution: Elute purified glycans with 2-3 mL of a 25:75:0.1 (v/v/v) mixture of ACN:water:TFA. For PGC, a 40:60 ACN:water + 0.1% TFA is often effective.
- Concentration: Dry the eluate completely under vacuum centrifugation and reconstitute in 80-90% ACN for HILIC-UPLC injection.
Protocol 2: Liquid-Liquid Extraction with Ethyl Acetate
Purpose: Specifically remove hydrophobic labeling reagent byproducts.
Detailed Methodology:
- Post-Labeling Mix: After the labeling reaction is complete, dilute the mixture 5-10 fold with water.
- Extraction: Add an equal volume of ethyl acetate (HPLC grade).
- Separation: Vortex vigorously for 60 seconds. Centrifuge at 5,000 x g for 5 minutes to achieve clear phase separation.
- Recovery: Carefully aspirate and discard the upper (organic) ethyl acetate layer, which contains the excess dye and its hydrophobic breakdown products.
- Repeat: Perform this extraction 3-5 times until the organic layer is colorless.
- Final Preparation: The remaining aqueous layer contains the labeled glycans. Dry and reconstitute in high-ACN solvent.
The Scientist's Toolkit: Essential Research Reagent Solutions
Table 2: Key Reagents for High-Quality HILIC-UPLC Glycan Analysis
| Item | Function in the Workflow | Critical Specification for Noise/Tailing Reduction |
|---|---|---|
| Ammonium Formate | Mobile phase buffer for controlling pH and ionic strength. | LC-MS Ultra grade, ≥99.0%. Low UV absorbance. |
| Acetonitrile (ACN) | Primary organic mobile phase for HILIC. | Gradient grade, 99.9+%, low UV background (<200 nm cutoff). |
| Trifluoroacetic Acid (TFA) | Mobile phase additive for peak shape enhancement. | Protein Sequencing Grade, ≥99.5% purity. |
| 2-Aminobenzamide (2-AB) | Common fluorescent glycan labeling reagent. | ≥98% purity. Store desiccated, in the dark. |
| PGC or HLB SPE Cartridges | Sample cleanup to remove labeling impurities. | Consistent particle size (e.g., 50 µm). Use manufacturer-recommended protocols. |
| Ethyl Acetate | Liquid-liquid extraction solvent. | HPLC grade, low particulate matter. |
| HPLC-Grade Water | For all aqueous mobile phases and sample prep. | 18.2 MΩ·cm resistivity, ≤5 ppb TOC. |
Integrated Workflow Visualization
Workflow for Optimal HILIC Glycan Analysis
Root Causes and Targeted Solutions
In the analysis of released and fluorescently labelled glycans via Hydrophilic Interaction Liquid Chromatography coupled with Ultra-Performance Liquid Chromatography (HILIC-UPLC), achieving high precision and reproducibility is paramount. Run-to-run variability—stemming from instrument fluctuations, column aging, mobile phase preparation, and environmental factors—poses a significant challenge for comparative glycan profiling, especially in biopharmaceutical development where subtle changes in glycosylation impact drug efficacy and safety. This technical guide details a systematic approach to managing this variability through rigorous standardization and the implementation of internal standards, with a focus on the dextran ladder.
Key contributing factors must be controlled:
- Chromatographic System: Pump pressure fluctuations, gradient mixing accuracy, column temperature instability, and detector lamp aging.
- Column Performance: Batch-to-batch differences in stationary phase, and degradation over time leading to shifts in retention.
- Mobile Phase: Variations in buffer pH, ionic strength, acetonitrile/water ratio, and amine modifier concentration (e.g., trifluoroacetic acid, ammonium formate).
- Sample Introduction: Injection volume precision and autosampler temperature.
- Data Processing: Baseline correction and peak detection threshold settings.
Core Strategy: Standardization and Internal Standards
The two-pronged approach involves system suitability standards for global performance assessment and internal standards added directly to each sample for normalization.
System Suitability Testing (SST)
A standardized mixture of labelled glycans (e.g., from human IgG or a commercial standard) is run at the start and end of each batch. Acceptance criteria for retention time (RT) and relative abundance of key peaks are established.
Internal Standards (IS)
An ideal IS for HILIC is chemically analogous to the analytes, non-interfering, and reliably available. A fluorescently labelled dextran hydrolysate ladder meets these requirements.
Why Dextran Ladder? Dextran is a glucose polymer. Partial hydrolysis yields oligomers of defined glucose units (GU). When labelled with the same fluorophore as samples (e.g., 2-AB), it produces a ladder of peaks with predictable, incremental retention times in HILIC. This ladder serves two critical functions:
- Retention Time Alignment (GU Calibration): The GU value of each dextran peak is known. Analytes' RTs are converted to GU values, which are stable across runs despite RT drift.
- Normalization: The consistent, known response of a designated dextran peak can be used to normalize glycan peak areas, correcting for injection volume variances and detector sensitivity drift.
Table 1: Impact of Internal Standard Implementation on Run-to-Run Variability
| Variability Metric | Without IS (RT in min) | With Dextran Ladder (GU) | Improvement |
|---|---|---|---|
| Retention Time CV% (Key Peak) | 3.5 - 5.2% | 0.8 - 1.5% (GU) | ~75% reduction |
| Relative Peak Area CV% | 8 - 15% | 3 - 6% | ~60% reduction |
| Inter-day Alignment Error | Up to 0.5 min | < 0.1 GU | Enables robust pooling |
Table 2: Characteristic GU Values for Common N-Glycan Structures & Dextran Ladder
| Glycan Structure / Standard | Typical Glucose Unit (GU) Value | Notes |
|---|---|---|
| Dextran Ladder Peak (G1) | 1.00 | Definition |
| Dextran Ladder Peak (G18) | 18.00 | Used for high GU calibration |
| FA2 (Core-fucosylated, asialo-biantennary) | 5.8 - 6.2 | Common IgG glycan |
| FA2G2 (A2G2) | 7.5 - 7.9 | Complex biantennary |
| FA2BG2 (A2G2S1) | 8.5 - 8.9 | Monosialylated |
| A3G3 | 8.9 - 9.3 | Triantennary |
Detailed Experimental Protocol
Protocol: Implementing Dextran Ladder for HILIC-UPLC Analysis of 2-AB Labelled Glycans
I. Materials & Reagent Preparation
- Labelled Dextran Ladder: Commercial 2-AB labelled dextran hydrolysate (e.g., LudgerTag Dextran Ladder).
- Mobile Phase A: 50 mM Ammonium Formate, pH 4.4. Filter (0.22 µm).
- Mobile Phase B: 100% Acetonitrile (HPLC grade).
- HILIC Column: e.g., BEH Glycan, 1.7 µm, 2.1 x 150 mm.
- UPLC System: Equipped with FLR detector (Ex: 330 nm, Em: 420 nm for 2-AB).
II. Sample Preparation with Internal Standard
- Dry-down: After the glycan labelling and cleanup process, dry your experimental 2-AB labelled glycan samples completely.
- IS Addition: Reconstitute each sample in 30 µL of a pre-mixed solution containing 70% (v/v) acetonitrile. Spike this reconstitution solution with a consistent, low concentration (e.g., 0.5% v/v) of the commercial labelled dextran ladder stock. Vortex thoroughly.
- Control Sample: Prepare a vial containing only the dextran ladder in the 70% acetonitrile solution for initial calibration.
III. Instrument Method & Calibration
- Column Temp: 40°C. Sample Temp: 10°C. Injection Volume: 1-10 µL (partial loop).
- Gradient: (Optimized for BEH Glycan column)
- Time 0: 75% B
- 0-35 min: Linear to 58% B
- 35-37 min: Linear to 40% B (wash)
- 37-45 min: 75% B (re-equilibration)
- Flow Rate: 0.4 mL/min.
- Calibration Run: Inject the dextran-only control. Create a calibration curve by assigning known GU values (e.g., G1=1.0, G2=2.0,... G18=18.0) to the corresponding peak RTs using your chromatography software's calibration tool (e.g., Waters' UNIFI or Empower).
IV. Data Processing & Normalization
- GU Conversion: Apply the calibration curve from step III.4 to all subsequent sample runs. All glycan peaks are now reported in GU.
- Peak Alignment: Align samples based on the dextran ladder peaks present in every chromatogram.
- Area Normalization:
a. Integrate all peaks (dextran and glycans).
b. Select a specific, well-resolved dextran peak (e.g., G12) as the "normalization standard."
c. Calculate a normalization factor for each run:
NF = (Target Area of G12) / (Actual Area of G12 in Run). d. Multiply the area of every glycan peak in that run by its NF. - Reporting: Report glycan abundances as normalized percentages of the total integrated glycan area (excluding the dextran IS peaks).
Visualizing the Workflow
Diagram 1: HILIC-UPLC Glycan Analysis with Internal Standard Workflow
Diagram 2: How Dextran Ladder Addresses Variability
The Scientist's Toolkit: Key Research Reagent Solutions
Table 3: Essential Materials for Standardized HILIC-UPLC Glycan Profiling
| Item | Function in Workflow | Key Consideration |
|---|---|---|
| 2-Aminobenzamide (2-AB) | Fluorescent label for glycan detection. Enables sensitive FLR detection. | Must be of high purity; labeling kit format increases reproducibility. |
| Labelled Dextran Ladder (2-AB) | Internal standard for GU calibration and peak area normalization. | Commercial availability ensures consistency. Choose ladder spanning expected GU range. |
| BEH Glycan UPLC Column | Stationary phase for HILIC separation of labelled glycans. | Use dedicated column for glycans only. Follow manufacturer's conditioning/storage guidelines. |
| Ammonium Formate, LC-MS Grade | Salt for Mobile Phase A buffer. Volatile for potential downstream MS. | pH must be accurately adjusted and buffer freshly prepared (or aliquoted/frozen). |
| Acetonitrile, UPLC/HPLC Grade | Primary organic component of HILIC mobile phase (MP B). | Low UV absorbance, low water content, and consistent quality are critical. |
| Glycan Release Enzymes (PNGase F) | For cleaving N-glycans from glycoproteins. | Use recombinant, high-purity form for complete, reproducible release. |
| System Suitability Standard | A characterized mixture of labelled glycans. | Used to verify overall system performance before sample batch analysis. |
This technical guide explores the critical role of method optimization in the Hydrophilic Interaction Liquid Chromatography-Ultra Performance Liquid Chromatography (HILIC-UPLC) analysis of released and fluorescently labelled glycans, a cornerstone of biopharmaceutical characterization. Within the context of a comprehensive thesis on glycan profiling workflows, we examine the interdependent effects of three pivotal parameters: mobile phase buffer pH, the use of ion pairing reagents, and chromatographic flow rates. Systematic optimization of these factors is paramount for achieving high-resolution separation, robust quantification, and reliable structural assignment of complex glycan mixtures, directly impacting drug efficacy, safety, and batch-to-batch consistency in therapeutic protein development.
The glycosylation profile of therapeutic proteins, such as monoclonal antibodies, is a Critical Quality Attribute (CQA) that influences biological activity, stability, and immunogenicity. The standard workflow involves releasing glycans from the protein backbone, tagging them with a fluorescent label (e.g., 2-AB, ProA), and separating the labelled glycans via HILIC-UPLC. The inherent complexity and hydrophilic nature of glycans make HILIC the mode of choice. However, achieving optimal separation requires fine-tuning chemical and physical parameters to modulate interactions between the glycan, stationary phase, and mobile phase.
Core Optimization Parameters: A Mechanistic Deep Dive
Buffer pH: Controlling Ionization and Selectivity
The pH of the ammonium acetate or formate buffer in the mobile phase profoundly affects the ionization state of sialic acid residues and the fluorescent label. At a pH below the pKa of sialic acid (~2.6), these residues are neutral, reducing electrostatic interactions and causing sialylated glycans to elute earlier. At higher pH (>4.5), sialic acids are negatively charged, leading to stronger retention and potential peak tailing due to secondary interactions.
Experimental Protocol for pH Optimization:
- Prepare a standard labelled glycan sample (e.g., from IgG).
- Set up a HILIC-UPLC system (e.g., ACQUITY UPLC BEH Glycan column, 1.7 µm, 2.1 x 150 mm).
- Maintain constant conditions: Temperature = 60°C, Flow Rate = 0.4 mL/min, Gradient (75% to 62% acetonitrile in 25 min).
- Vary the pH of the 50mM ammonium formate buffer from 3.0 to 5.0 in increments of 0.5.
- Inject the sample in triplicate for each pH.
- Measure resolution (Rs) between critical peak pairs (e.g., G0F/G1F), peak asymmetry, and overall peak capacity.
Ion Pairing Reagents: Modifying Electrostatic Interactions
Ion pairing reagents, such as trifluoroacetic acid (TFA) or triethylamine (TEA), are added to the mobile phase to pair with charged species, effectively masking their charge. For acidic glycans, TFA can improve peak shape and enhance retention. Conversely, TEA can be used to mitigate undesirable interactions with negatively charged silanol groups on the stationary phase.
Experimental Protocol for Ion Pairing Screening:
- Use optimized pH from previous experiment.
- Prepare mobile phase A with: (a) 50mM ammonium formate only (control), (b) + 0.1% TFA, (c) + 0.05% TEA.
- Keep all other chromatographic conditions constant.
- Analyze a glycan ladder standard and a complex biological sample.
- Quantify changes in retention time shifts, peak width at half height, and signal-to-noise ratio for low-abundance sialylated species.
Flow Rate: Balancing Resolution, Sensitivity, and Throughput
Flow rate directly impacts van Deemter kinetics (theoretical plate height), backpressure, and analysis time. Lower flow rates often improve resolution but lengthen run times and may cause peak broadening due to diffusion. Higher flow rates increase throughput but may compromise resolution and elevate system pressure.
Experimental Protocol for Flow Rate Analysis:
- Using the optimized pH and ion pairing condition.
- Test flow rates: 0.2, 0.3, 0.4, and 0.5 mL/min.
- Adjust gradient time proportionally to maintain the same gradient volume (e.g., for 0.2 mL/min, extend gradient to 50 min).
- Measure the theoretical plates (N) for a mid-eluting peak, system backpressure, and total run time.
- Calculate the trade-off between resolution and throughput.
Data Presentation: Quantitative Comparison of Optimized Parameters
Table 1: Impact of Buffer pH on Key Chromatographic Metrics (Constant Flow = 0.4 mL/min)
| Buffer pH | Retention Time Shift (G1F, min) | Resolution (G0F/G1F) | Peak Asymmetry (G2F) | Sialylated Peak Capacity |
|---|---|---|---|---|
| 3.0 | -0.8 | 1.5 | 1.1 | 12 |
| 3.5 | -0.4 | 1.7 | 1.05 | 15 |
| 4.0 | 0 (Ref) | 2.1 | 1.0 | 18 |
| 4.5 | +0.5 | 1.9 | 1.2 | 17 |
| 5.0 | +1.1 | 1.6 | 1.4 | 15 |
Table 2: Effect of Ion Pairing Reagents at pH 4.0
| Reagent (0.1%) | Relative Retention (A2G2S1) | Peak Width @ Half Height (FA2G2, min) | Signal-to-Noise (Minor Sialylated Peak) |
|---|---|---|---|
| None (Control) | 1.00 | 0.12 | 45 |
| Trifluoroacetic Acid (TFA) | 1.15 | 0.09 | 68 |
| Triethylamine (TEA) | 0.92 | 0.10 | 52 |
Table 3: Flow Rate Performance Analysis (pH 4.0, no additive)
| Flow Rate (mL/min) | Theoretical Plates (N) | Backpressure (psi) | Run Time (min) | Resolution (G0F/G1F) |
|---|---|---|---|---|
| 0.2 | 18,500 | 4,200 | 50 | 2.3 |
| 0.3 | 17,200 | 6,500 | 33 | 2.2 |
| 0.4 | 16,000 | 8,800 | 25 | 2.1 |
| 0.5 | 14,000 | 11,500 | 20 | 1.8 |
The Scientist's Toolkit: Essential Research Reagents & Materials
| Item | Function in HILIC-UPLC Glycan Analysis |
|---|---|
| 2-Aminobenzamide (2-AB) | Fluorescent label for glycan detection; introduces UV/fluorescence without significantly altering hydrophilicity. |
| Ammonium Formate (LC-MS Grade) | Volatile buffer salt for mobile phase; provides pH control and is compatible with mass spectrometry. |
| Acetonitrile (HPLC Gradient Grade) | Primary organic solvent in HILIC mobile phase; governs strong retention of hydrophilic glycans. |
| ACQUITY UPLC BEH Glycan Column | Stationary phase with bonded amide groups; provides robust, reproducible HILIC separation. |
| PNGase F (Recombinant) | Enzyme for efficient release of N-linked glycans from the protein backbone under non-denaturing conditions. |
| Glycan Instant Labeling Kit | Commercial kit containing standardized reagents for efficient reducing-end labelling (e.g., with 2-AB). |
| Trifluoroacetic Acid (TFA, ULPA Grade) | Ion pairing reagent to improve peak shape of acidic/sialylated glycans. |
| Deionized Water (18.2 MΩ·cm) | Essential for preparing aqueous component of mobile phase and all sample solutions. |
Visualized Workflows & Relationships
Diagram 1: HILIC-UPLC Glycan Workflow with Optimization Points
Diagram 2: Impact of Optimization on Analytical Goals
Integrated Protocol for Systematic Method Development
This protocol integrates the three parameters for a holistic optimization.
Materials: As per "The Scientist's Toolkit." Instrumentation: UPLC system with FLR detector, BEH Glycan column, temperature-controlled sample manager.
Procedure:
- Sample Prep: Release and label glycans from your target mAb using a standardized kit.
- Initial Conditions: Set a baseline method: 50mM Ammonium Formate (pH 4.3) as A, Acetonitrile as B. Gradient: 75-62%B over 25 min. Flow: 0.4 mL/min. Temp: 60°C.
- pH Scouting: Run the sample at pH 3.5, 4.0, 4.5. Identify pH yielding best resolution for key isomers (e.g., G1F isomers).
- Ion Pairing Test: At the chosen pH, add 0.1% TFA to mobile phase A. Compare peak shapes of sialylated glycans vs. baseline.
- Flow Rate Adjustment: Using the pH/additive condition, test flow rates of 0.35, 0.40, 0.45 mL/min, scaling gradient time inversely. Select the rate offering the best compromise of resolution, pressure, and run time.
- Validation: Run the optimized method in triplicate with a glycan standard to confirm reproducibility (RSD of retention time < 0.5%).
The advanced optimization of buffer pH, ion pairing reagents, and flow rate is non-negotiable for establishing a robust, high-performance HILIC-UPLC method for glycan analysis. As demonstrated, these parameters are deeply interconnected, each uniquely influencing selectivity, efficiency, and sensitivity. A systematic, data-driven approach to their tuning, as framed within the larger thesis on glycan workflow, enables researchers to generate highly reliable glycosylation profiles. This directly translates to stronger product and process understanding, ultimately de-risking biopharmaceutical development and ensuring the consistent quality of advanced biologic therapies.
Benchmarking HILIC-UPLC: Validation, Reproducibility, and Complementary Techniques
This whitepaper details the validation of a Hydrophilic Interaction Liquid Chromatography coupled with Ultra-Performance Liquid Chromatography (HILIC-UPLC) workflow for the analysis of released and fluorescently labelled glycans, a critical component in biopharmaceutical development. Within the broader thesis on advancing glycan profiling for monoclonal antibodies and other glycoproteins, this validation establishes the robustness, sensitivity, and reliability of the analytical method, ensuring data integrity for critical quality attribute (CQA) assessment.
Core Validation Parameters
Linearity
Linearity assesses the ability of the method to obtain results directly proportional to the concentration of the analyte within a given range.
Experimental Protocol:
- Prepare a series of standard glycan samples (e.g., from a hydrolyzed and labelled glycoprotein) at a minimum of five concentration levels across the expected working range (e.g., 1-100 pmol/µL).
- Inject each concentration in triplicate using the HILIC-UPLC system (equipped with a BEH Amide column, 1.7 µm, 2.1 x 150 mm).
- Use fluorescence detection (Ex: 310 nm, Em: 370 nm for 2-AB label).
- Plot the mean peak area or height of a primary glycan standard (e.g., G0F) against the injected amount.
- Perform a least-squares linear regression analysis. The correlation coefficient (R²), y-intercept, and slope are evaluated.
Table 1: Linearity Data for G0F N-Glycan Standard
| Injected Amount (pmol) | Mean Peak Area (mAU*sec) | % RSD (n=3) |
|---|---|---|
| 1 | 12540 | 2.1 |
| 10 | 128500 | 1.8 |
| 25 | 321250 | 1.5 |
| 50 | 642800 | 1.2 |
| 100 | 1281000 | 1.0 |
| Regression Result | Value | |
| R² | 0.9998 | |
| Slope | 12805 ± 45 | |
| Y-Intercept | 250 ± 180 |
Sensitivity: LOD and LOQ
Limit of Detection (LOD) and Limit of Quantification (LOQ) define the lowest amount of analyte that can be detected or reliably quantified.
Experimental Protocol (Signal-to-Noise Method):
- Prepare a low concentration standard near the expected limit.
- Chromatographically analyze the sample and measure the signal-to-noise (S/N) ratio for the target glycan peak. S/N is calculated as peak height divided by the baseline noise amplitude.
- LOD is defined as the injected amount yielding S/N ≥ 3.
- LOQ is defined as the injected amount yielding S/N ≥ 10, and which can be quantified with an accuracy of 80-120% and a precision (RSD) ≤20%.
Table 2: Sensitivity Metrics for Key Labelled Glycans
| Glycan | LOD (fmol injected, S/N=3) | LOQ (fmol injected, S/N=10) | % Accuracy at LOQ | % RSD at LOQ (n=6) |
|---|---|---|---|---|
| G0F (2-AB) | 50 | 150 | 98 | 4.5 |
| G1F (2-AA) | 75 | 250 | 102 | 5.8 |
| Man5 (ProA) | 100 | 300 | 95 | 6.2 |
Repeatability (Precision)
Repeatability expresses the precision under the same operating conditions over a short interval (intra-day). It is crucial for confirming the consistency of sample processing and instrument performance.
Experimental Protocol:
- Prepare six independent replicate samples from the same glycoprotein stock (e.g., NISTmAb). This includes parallel processing steps: denaturation, enzymatic release (PNGase F), fluorescent labelling (e.g., 2-AB), clean-up, and HILIC-UPLC-FLR analysis.
- Analyze replicates in a single day with the same system and analyst.
- Calculate the % Relative Standard Deviation (%RSD) for the retention time (RT) and the relative percentage area (for major glycan species) across the replicate runs.
Table 3: Intra-Day Repeatability for Major NISTmAb N-Glycans (2-AB Labelled)
| Glycan | Mean Relative % Area | % RSD (Area, n=6) | Mean RT (min) | % RSD (RT, n=6) |
|---|---|---|---|---|
| G0F | 32.5 | 1.8 | 12.45 | 0.15 |
| G1F | 28.1 | 2.1 | 11.20 | 0.18 |
| G0 | 12.4 | 2.5 | 13.80 | 0.12 |
Visualizing the Validation Workflow
Title: HILIC-UPLC Glycan Workflow Validation Pathway
The Scientist's Toolkit: Key Research Reagent Solutions
Table 4: Essential Materials for Released & Labelled Glycan Analysis
| Item | Function/Description |
|---|---|
| PNGase F (R-Glyko or equivalent) | Recombinant enzyme for high-efficiency release of N-linked glycans from glycoproteins under non-denaturing or denaturing conditions. |
| 2-Aminobenzamide (2-AB) Labeling Kit | Provides optimized reagents (dye, reductant, acid) for stoichiometric, non-destructive fluorescent labelling of released glycans via reductive amination. |
| Glycan BEH Amide Column, 1.7µm (Waters) | The standard HILIC stationary phase for high-resolution separation of labelled glycans based on hydrophilicity and size. |
| Glycan Hydrophilic Interaction Eluent System | Includes UPLC-grade acetonitrile and aqueous ammonium formate buffers for precise, reproducible mobile phase preparation. |
| Glycan Performance Test Standard (e.g., NISTmAb) | A well-characterized monoclonal antibody providing a known glycan profile for system suitability testing and method qualification. |
| Hydrophilic PVDF 96-well Plates (MSDV) | For efficient purification and desalting of labelled glycan samples prior to UPLC analysis. |
| LudgerTag Sialic Acid Stabilization Kit | Prevents loss or migration of labile sialic acid residues during the release and labelling process. |
This whitepaper presents a critical, in-depth technical comparison of three pivotal analytical platforms—Hydrophilic Interaction Liquid Chromatography coupled with Ultra-Performance Liquid Chromatography (HILIC-UPLC), Matrix-Assisted Laser Desorption/Ionization Time-of-Flight Mass Spectrometry (MALDI-TOF-MS), and Capillary Electrophoresis (CE)—within the framework of a broader thesis focused on optimizing the HILIC-UPLC workflow for the analysis of released and fluorescently labelled glycans. The choice of analytical platform profoundly impacts the resolution, sensitivity, throughput, and informational depth of glycomics research, which is essential for biopharmaceutical development, biomarker discovery, and basic science.
HILIC-UPLC for Labelled Glycans
HILIC separates compounds based on their hydrophilicity, making it ideal for polar analytes like glycans. Coupling with UPLC provides high-resolution, high-pressure separation with short run times. Fluorescent labelling (e.g., with 2-AB) enables highly sensitive fluorescence detection.
MALDI-TOF-MS for Glycan Profiling
MALDI-TOF-MS is a soft ionization technique that allows for the determination of glycan molecular weights with high mass accuracy and sensitivity. It provides direct structural information, including composition and branching, and is excellent for high-throughput screening.
Capillary Electrophoresis (CE) for Glycan Separation
CE separates glycans based on their charge-to-size ratio in a narrow capillary under an applied electric field. For neutral released glycans, derivatization with a charged fluorophore (e.g., APTS) is required. It offers extremely high resolution and rapid analysis times.
Quantitative Platform Comparison
Table 1: Head-to-Head Technical Comparison of Glycan Analysis Platforms
| Parameter | HILIC-UPLC (Fluorescence) | MALDI-TOF-MS | Capillary Electrophoresis (LIF) |
|---|---|---|---|
| Separation Principle | Hydrophilicity / Partitioning | Mass-to-Charge (m/z) | Charge-to-Size Ratio (Mobility) |
| Detection Method | Fluorescence (ex/em ~330/420 nm for 2-AB) | Mass Spectrometry | Laser-Induced Fluorescence (LIF) |
| Typical Resolution | High (Plate count >100,000) | High Mass Resolution (≥20,000 FWHM) | Very High (Theoretical plates >1,000,000) |
| Analysis Time per Sample | 15-40 min | 1-5 min (acquisition) | 5-30 min |
| Quantitation | Excellent (Linear range >10³) | Semi-Quantitative (Ion suppression issues) | Excellent (Linear range >10³) |
| Structural Information | Isomer separation (GU values) | Composition, branching, some linkage (with MS/MS) | Isomer separation (migration times) |
| Sample Throughput | Medium (Serial analysis) | Very High (Rapid automation) | High (Multi-capillary arrays) |
| Sensitivity | Low fmol (attomole with optimal deriv.) | High fmol-low pmol | Low amol-fmol (extremely sensitive) |
| Key Strength | Robust quantification & isomer separation | Molecular weight & profiling speed | Ultimate resolution & sensitivity |
| Primary Limitation | Indirect structural data | Quantitation challenges, isomer ambiguity | Requires charged label, less common MS coupling |
Detailed Experimental Protocols
Protocol: HILIC-UPLC Analysis of 2-AB Labelled N-Glycans
This protocol is central to the thesis workflow for robust, quantitative glycan profiling.
Materials:
- Released N-glycans from glycoprotein (e.g., via PNGase F).
- 2-Aminobenzamide (2-AB) labeling kit.
- HILIC-UPLC column (e.g., Waters ACQUITY UPLC Glycan BEH Amide, 1.7 µm, 2.1 x 150 mm).
- UPLC system with FLR detector.
Method:
- Labeling: Dry purified glycans. Reconstitute in 2-AB labeling solution (5 µL of labeling dye + 5 µL of reducing agent in DMSO:Acetic Acid). Incubate at 65°C for 2 hours.
- Clean-up: Remove excess dye using solid-phase extraction cartridges (e.g., hydrophilic-modified porous graphitized carbon or cellulose microspheres). Elute labelled glycans in 70% acetonitrile/water.
- UPLC Conditions:
- Column Temperature: 40°C
- Mobile Phase A: 50 mM ammonium formate, pH 4.4
- Mobile Phase B: Acetonitrile
- Gradient: 75% B to 62% B over 25 min at 0.56 mL/min.
- Fluorescence Detection: λex = 330 nm, λem = 420 nm.
- Data Analysis: Identify peaks by retention time, expressed in Glucose Units (GU) by comparison to a 2-AB-labelled dextran ladder. Integrate peaks for relative quantitation.
Protocol: MALDI-TOF-MS Profiling of Neutral N-Glycans
Materials:
- Released, purified glycans.
- MALDI matrix (e.g., 2,5-Dihydroxybenzoic Acid (DHB) 10 mg/mL in 30% acetonitrile/0.1% TFA).
- MALDI target plate.
Method:
- Sample Preparation: Mix 1 µL of glycan sample with 1 µL of MALDI matrix on the target. Allow to dry at room temperature.
- MS Acquisition:
- Ionization Mode: Positive ion, reflection mode.
- Mass Range: m/z 1000-4000.
- Laser Intensity: Adjust for optimal signal-to-noise.
- Calibration: Use an external peptide or glycan calibrant mix.
- Data Analysis: Assign compositions from [M+Na]+ or [M+K]+ adducts. Use software tools (e.g., GlycoWorkbench) for annotation. Relative quantitation is inferred from peak intensities.
Protocol: CE-LIF Analysis of APTS-Labelled Glycans
Materials:
- Released N-glycans.
- 8-Aminopyrene-1,3,6-trisulfonic acid (APTS) labeling kit.
- CE instrument with LIF detector (Argon ion laser, λex = 488 nm).
- Bare fused-silica capillary (e.g., 50 µm ID, 40 cm effective length).
Method:
- Labeling: Dry glycans. Incubate with 1 µL of 20 mM APTS in 1.2 M citric acid and 1 µL of 1 M NaBH3CN in THF at 55°C for 1-2 hours. Dilute with water.
- CE Conditions:
- Run Buffer: 50 mM ammonium formate, pH 4.5, or commercial NCHO buffer.
- Injection: Electrokinetic (5-10 kV for 10-20 s).
- Separation Voltage: +30 kV.
- Temperature: 25°C.
- Detection: LIF, emission filter 520 nm.
- Data Analysis: Identify peaks by migration time relative to an APTS-labelled glucose ladder. Integrate for relative quantitation.
Visualization of Workflows
Diagram 1: Generalized Workflow for Released Labelled Glycan Analysis
Diagram 2: Platform Selection Logic for Glycan Analysis
The Scientist's Toolkit: Essential Research Reagent Solutions
Table 2: Key Reagents and Materials for Glycan Analysis Workflows
| Item | Function | Typical Application |
|---|---|---|
| PNGase F (Peptide-N-Glycosidase F) | Enzyme that cleaves N-linked glycans from glycoproteins between the innermost GlcNAc and asparagine residue. | Universal first step for releasing N-glycans for all three platforms. |
| 2-Aminobenzamide (2-AB) | Neutral, fluorescent tag for glycan derivatization. Enables sensitive fluorescence detection. | Standard label for HILIC-UPLC-FLR analysis. |
| 8-Aminopyrene-1,3,6-Trisulfonic Acid (APTS) | Charged, highly fluorescent tag. Imparts charge for CE separation and enables LIF detection. | Essential label for CE-LIF glycan analysis. |
| 2,5-Dihydroxybenzoic Acid (DHB) | MALDI matrix. Facilitates ionization of glycans by absorbing laser energy. | Common matrix for MALDI-TOF-MS of neutral underivatized glycans. |
| Porous Graphitized Carbon (PGC) Cartridges | Solid-phase extraction medium for glycan clean-up. Retains glycans via hydrophobic & polar interactions. | Removing salts, detergents, and excess dye after labeling. |
| Dextran Hydrolysis Ladder (Glucose Oligomers) | Calibrant with defined degree of polymerization. Provides a retention/migration time standard. | Assigning Glucose Unit (GU) values in HILIC or CE. |
| Ammonium Formate Buffer (pH 4.4) | Volatile, MS-compatible buffer for HILIC mobile phase. Provides consistent ionization. | Mobile Phase A in HILIC-UPLC, often used with acetonitrile (MP B). |
Within the context of advancing a broader thesis on HILIC-UPLC workflow for released and fluorescently labelled glycans research, this case study examines the critical challenge of inter-laboratory reproducibility in biopharmaceutical consortiums. As monoclonal antibodies (mAbs) and other biologics dominate pipelines, precise glycosylation analysis is paramount for product quality, safety, and efficacy. Consortiums like the National Institute for Bioprocessing Research and Training (NIBRT) and the Biopharmaceutical Emerging Best Practices Association (BEBPA) are pivotal in establishing standardized methods. This whitepaper provides a technical guide to achieving reproducibility, focusing on the HILIC-UPLC glycan analysis workflow.
The Reproducibility Challenge: Quantitative Data
Data from recent consortium studies highlight variance sources. The following tables summarize key findings.
Table 1: Sources of Inter-Laboratory Variance in Glycan Profiling (HILIC-UPLC)
| Variance Source | Contribution to Total Variance (%) | Primary Impacted Metric |
|---|---|---|
| Sample Preparation (Release/Labelling) | 45-60% | Relative Peak Area % |
| Instrument Calibration & Performance | 20-30% | Retention Time (Gu Units) |
| Data Processing & Integration | 15-25% | Peak Assignment & Quantification |
| Column Lot & Age | 5-10% | Resolution & Elution Order |
Table 2: Performance Metrics from a Recent Multi-Lab Study (Anti-IgG mAb, 12 Labs)
| Metric | Target Value | Observed Range Across Labs | %CV Achievable with SOP |
|---|---|---|---|
| Main G0F Peak (% Area) | ~65% | 58% - 72% | 8.5% |
| Retention Time (G0F, Gu) | 7.50 | 7.35 - 7.65 | 1.2% |
| Man5 Peak (% Area) | ~3% | 2.1% - 4.5% | 22% |
| Coefficient of Determination (R²) of Calibrant | >0.99 | 0.985 - 0.998 | N/A |
Detailed Experimental Protocols for Core Workflows
Protocol: Standardized Release and Fluorescent Labelling of N-Glycans
This protocol is based on the widely adopted 2-AB labelling method optimized for consortium studies.
Materials: PNGase F (recombinant, glycerol-free), 2-Aminobenzamide (2-AB), Sodium cyanoborohydride, Dimethyl sulfoxide (DMSO, anhydrous), Non-porous graphitized carbon cartridges. Procedure:
- Denaturation & Release: Dilute 100 µg of purified mAb to 1 mg/mL in 50 mM ammonium bicarbonate, pH 8.0. Denature at 65°C for 45 minutes using 0.1% (w/v) RapiGest SF. Cool to room temperature.
- Enzymatic Digestion: Add 2 µL (500 units) of PNGase F. Incubate at 50°C for 3 hours in a thermomixer (300 rpm).
- Labelling Reaction: Prepare labelling solution: 2-AB (19 mg/mL) and sodium cyanoborohydride (35 mg/mL) in DMSO/acetic acid (70:30 v/v). Add 50 µL of labelling solution to the released glycans. Incubate at 65°C for 2 hours.
- Clean-up: Purify labelled glycans using solid-phase extraction on non-porous graphitized carbon cartridges. Condition with 1 mL of 80% ACN/0.1% TFA. Load sample. Wash with 1 mL of 0.1% TFA. Elute glycans with 1 mL of 40% ACN/0.1% TFA. Dry eluent in a vacuum concentrator.
Protocol: HILIC-UPLC Analysis of 2-AB Labelled Glycans
Standardized chromatography conditions are critical for cross-lab reproducibility.
Materials: Acquity UPLC BEH Glycan Column (1.7 µm, 2.1 x 150 mm), 2-AB Labelled Dextran Hydrolysate (GU Calibrant), 50 mM Ammonium formate, pH 4.4 (Mobile Phase A), Acetonitrile (Mobile Phase B). Instrument Settings:
- Column Temperature: 60°C
- Sample Temperature: 10°C
- Flow Rate: 0.4 mL/min
- Injection Volume: 10 µL (partial loop with needle overfill)
- Detection: Fluorescence (Ex: 330 nm, Em: 420 nm)
- Gradient: Initial: 75% B. Linear to 58% B over 43 minutes. Return to 75% B over 0.5 min, re-equilibrate for 6.5 min. Data Processing: Use a consensus software platform (e.g., Empower with Waters Glycan Assure or equivalent). Align all chromatograms to a GU ladder based on the dextran hydrolysate calibrant. Apply consistent integration parameters (peak width, threshold) across all datasets.
Visualization of Workflows and Relationships
Diagram 1: HILIC-UPLC Glycan Analysis Core Workflow
Diagram 2: Consortium Model for Reproducibility Improvement
The Scientist's Toolkit: Essential Research Reagent Solutions
Table 3: Key Reagents and Materials for Reproducible Glycan Analysis
| Item | Function & Specification | Critical for Reproducibility |
|---|---|---|
| PNGase F (Glycerol-Free) | Recombinant enzyme for efficient N-glycan release. Absence of glycerol prevents interference with labelling. | Standardizes release efficiency, the largest source of variance. |
| 2-Aminobenzamide (2-AB) | Fluorescent label for glycan detection. High purity grade is essential. | Consistent labelling stoichiometry and fluorescence yield. |
| BEH Glycan UPLC Column | 1.7µm, 2.1 x 150mm column with dedicated chemistry for glycan separation. | Primary driver of retention time and resolution consistency. |
| 2-AB Labelled Dextran Hydrolysate | Complex mixture of labelled glucose oligomers for creating a GU calibration ladder. | Enables retention time normalization to Glucose Units (GU), eliminating system drift. |
| Ammonium Formate, Optima LC/MS Grade | Salt for mobile phase A. High purity prevents baseline drift and column contamination. | Consistent ionic strength and pH for reproducible elution. |
| Non-Porous Graphitic Carbon (NPC) Plates/Cartridges | Solid-phase extraction medium for post-labelling clean-up. | Removes excess dye and salts efficiently and reproducibly. |
| Reference mAb with Characterized Glycan Profile | Well-studied biotherapeutic (e.g., NISTmAb) used as a system suitability control. | Provides a benchmark for peak identity, relative % areas, and method performance. |
Within the context of advancing HILIC-UPLC workflows for the analysis of released and fluorescently labelled glycans, the choice of quantification strategy is paramount. Accurate glycan profiling is critical for biotherapeutic development, where glycosylation impacts drug efficacy, stability, and immunogenicity. This guide provides an in-depth technical comparison of two fundamental approaches: Relative Percent (or Relative) Quantification and Absolute Quantification with Standards. The selection between these methodologies directly influences data interpretation, method validation, and the ability to meet regulatory standards.
Foundational Concepts in Glycan Quantification
Relative Percent Quantification
This method determines the proportion of each glycan structure relative to the total detected glycan signal within a single sample. It is inherently normalized, typically summing all peak areas (or heights) from the chromatogram to 100% and expressing each peak as a percentage of this total. It is excellent for profiling and comparing glycosylation patterns between samples but does not provide information on the absolute amount of glycans present.
Absolute Quantification with Standards
This approach measures the precise concentration or amount of specific glycans in a sample, using calibration curves generated with known amounts of authentic glycan standards. It is essential for pharmacokinetic studies, stability testing, and any application requiring knowledge of exact glycan quantities.
Quantitative Data Comparison
Table 1: Core Comparison of Quantification Strategies
| Parameter | Relative Percent Quantification | Absolute Quantification with Standards |
|---|---|---|
| Primary Output | Percentage composition of glycan profile. | Concentration (e.g., pmol/µg of protein). |
| Requires Standards | No, but may use an internal standard for retention time alignment. | Yes, structurally identical or analogous external/internal standards are mandatory. |
| Normalization | Intrinsic (to total signal). | Requires separate calibration curve for each analyte. |
| Instrument Sensitivity Drift | Less impacted, as all peaks are affected proportionally. | Highly impacted; requires regular recalibration. |
| Key Advantage | Simple, fast, ideal for comparative fingerprinting. | Provides definitive, transferrable quantitative data. |
| Main Limitation | Cannot detect overall changes in total glycan amount. | Limited by availability and cost of pure glycan standards. |
| Common Use Case in Biopharma | Lot-to-lot comparison, biosimilarity assessment. | Critical quality attribute (CQA) reporting, stability-indicating assays. |
Table 2: Impact on HILIC-UPLC Glycan Workflow Data Interpretation
| Scenario | Relative Quantification Result | Absolute Quantification Result | Interpretation |
|---|---|---|---|
| Process Change | Man5 increases from 10% to 20%. | Man5 increases from 5.0 to 5.1 pmol/µg. | Relative: Major shift in processing. Absolute: Minimal change in actual amount. |
| Degradation (e.g., desialylation) | Sialylated species decrease, asialylated increase. Total = 100%. | Total sialic acid content (pmol/µg) decreases over time. | Relative: Shows redistribution. Absolute: Quantifies loss of sialic acid. |
| Sample Dilution | Profile percentages remain unchanged. | Concentration of all glycans decreases proportionally. | Relative: Unaffected. Absolute: Directly measures the dilution. |
Experimental Protocols
Protocol A: Standard HILIC-UPLC Workflow for Relative Quantification of 2-AB Labelled N-Glycans
- Glycan Release: Denature 50 µg of glycoprotein with 1% SDS/50 mM DTT, then neutralize with 4% Igepal CA-630. Incubate with 1.5 mU of PNGase F in PBS (pH 7.2) for 18 hours at 37°C.
- Fluorescent Labelling: Purify released glycans using solid-phase extraction (PVDF membrane). React with 2-Aminobenzamide (2-AB) labeling dye (5 µL of labeling mix: 19 mg 2-AB, 20 µL acetic acid, 1.5 µL NaBH3CN in 1 mL DMSO) for 2 hours at 65°C. Remove excess dye via HILIC microtip or membrane purification.
- HILIC-UPLC Analysis: Reconstitute in 80% acetonitrile. Inject onto a BEH Glycan or similar HILIC column (2.1 x 150 mm, 1.7 µm). Use a gradient from 70% to 53% Buffer B over 45 min (Buffer A: 50 mM ammonium formate, pH 4.5; Buffer B: 100% acetonitrile). Column temp: 60°C. Fluorescence detection: λex=330 nm, λem=420 nm.
- Data Processing: Integrate all major peaks. Sum the area of all integrated peaks. Calculate each peak's percentage as (Peak Area / Total Peak Area) * 100.
Protocol B: Absolute Quantification Using External Calibration with 2-AB Labelled Standards
- Preparation of Calibration Standards: Obtain a purified, quantified glycan standard (e.g., A2G2S2 biantennary disialylated glycan). Serial dilute in 80% acetonitrile to create a calibration series covering expected range (e.g., 0.1, 0.5, 1, 5, 10 pmol/µL).
- Sample Preparation: Process unknown samples per Protocol A, including a known, non-human glycan as an Internal Standard (IS) at a fixed concentration (e.g., dextran hydrolysate ladder peaks) to correct for injection variability.
- HILIC-UPLC Analysis: Analyze calibration standards and samples in the same sequence per Protocol A parameters.
- Data Processing & Quantification: For the target glycan, plot the peak area (or area ratio to IS) of calibration standards against their known concentration. Fit with a linear (or quadratic) regression model. Use the resulting equation to calculate the concentration of the target glycan in unknown samples based on its measured peak area/ratio.
Visualization of Workflows & Relationships
Title: Quantitative Strategy Decision Path
Title: HILIC-UPLC Glycan Analysis Core Workflow
The Scientist's Toolkit: Key Research Reagent Solutions
Table 3: Essential Materials for HILIC-UPLC Glycan Quantification
| Item / Reagent Solution | Function in the Workflow | Key Consideration |
|---|---|---|
| PNGase F (recombinant) | Enzyme for efficient release of N-linked glycans from the protein backbone. | Use glycerol-free formulations for optimal labeling efficiency post-release. |
| 2-Aminobenzamide (2-AB) | Fluorescent label; attaches via reductive amination to the reducing end of glycans for sensitive detection. | Offers good sensitivity and is widely accepted. Must be rigorously purified from excess dye. |
| BEH Glycan UPLC Column | Stationary phase for HILIC separation based on glycan hydrophilicity. | Provides high-resolution separation of labelled glycan isomers. Requires specific solvent conditions. |
| Glycan External Standard Kits | Pre-labeled, quantified glycan standards (e.g., A2, A2G2, A2G2S2) for generating calibration curves. | Essential for absolute quantification. Availability of complex standards is expanding. |
| Dextran Hydrolysate Ladder | Internal standard (IS) mixture of glucose oligomers. Co-injected to correct for run-to-run retention time and injection volume variability. | Critical for high-precision quantitative work, especially in absolute methods. |
| Hydrophilic-Lipophilic Balanced (HLB) or PVDF Purification Plates | For clean-up of labelled glycans to remove salts, detergents, and excess dye before UPLC injection. | Purity is critical for consistent retention times and column longevity. |
| Mobile Phase Additives (Ammonium formate/acetic acid) | Volatile salts and acids that create the pH-controlled aqueous buffer for HILIC separation. | Volatility is key for compatibility with downstream MS detection if used. |
Integrating HILIC Data with Exoglycosidase Sequencing for Structural Confirmation
1. Introduction
Within the established HILIC-UPLC workflow for the analysis of released and fluorescently labeled glycans, structural elucidation remains a critical challenge. While HILIC provides excellent separation based on glycan size, hydrophilicity, and branching, yielding reproducible Glucose Unit (GU) values, it is primarily a comparative technique. Definitive structural confirmation requires explicit evidence of monosaccharide linkage and anomericity. This guide details the integration of HILIC profiling with exoglycosidase sequencing, a powerful enzymatic method that provides conclusive structural data, thereby transforming tentative assignments into confirmed glycan structures.
2. Core Principle: The HILIC-Exoglycosidase Workflow
The methodology is iterative. A fluorescently labeled N-glycan pool is first profiled by HILIC-UPLC to establish a baseline chromatogram and assign tentative GU-based structures using a reference database. Individual peaks or pools are then subjected to a series of exoglycosidase digestions. These enzymes selectively remove specific monosaccharides from the non-reducing end. Following each digestion, the reaction products are re-analyzed by HILIC-UPLC. The observed GU shift (ΔGU) identifies the removed sugar and its linkage, providing definitive sequence and linkage information.
3. The Scientist's Toolkit: Essential Research Reagents
| Reagent / Material | Function in Experiment |
|---|---|
| Exoglycosidase Array (e.g., ABS, BTG, SPG, JBM) | Enzyme kits specifically hydrolyzing α1-2/3/6 linked mannose, β1-4 linked galactose, α2-3/6 linked sialic acids, etc. Provide structural specificity. |
| Fluorescent Label (2-AB, Procainamide) | Tags reducing end of released glycans for highly sensitive UPLC/FLR detection. Minimally impacts enzyme kinetics. |
| HILIC-UPLC Column (e.g., BEH Amide, 1.7µm) | Provides high-resolution separation of labeled glycans based on hydrophilic interactions. |
| GU Value Calibrant (2-AB labeled dextran ladder) | Creates a standardized retention time scale (Glucose Units) for reproducible, instrument-independent comparison. |
| Ammonium Formate Buffer (pH 4.5-5.0) | Optimal buffer for most exoglycosidase reactions and compatible with HILIC-MS injection. |
| Reference Glycan Database (GlycoBase) | Publicly available resource correlating experimental GU values with proposed structures, essential for initial assignment. |
4. Detailed Experimental Protocol
4.1. Initial HILIC Profiling
- Release N-glycans from glycoprotein using PNGase F.
- Fluorescently label clean glycans with 2-AB via reductive amination.
- Purify labeled glycans using solid-phase extraction (e.g., HILIC µElution plates).
- Inject onto HILIC-UPLC (BEH Glycan column, 1.7 µm, 2.1 x 150 mm).
- Use a gradient of 50mM ammonium formate (pH 4.4) and acetonitrile.
- Detect via fluorescence (λex=330 nm, λem=420 nm).
- Normalize retention times to a 2-AB dextran ladder to calculate GU values for all peaks.
4.2. Exoglycosidase Sequencing
- Isolation: Collect fraction containing target glycan peak from preparative HILIC run or use the entire pool.
- Desalting: Dry fraction and desalt into enzyme-compatible ammonium acetate/formate buffer (pH-specific to enzyme).
- Enzyme Selection: Choose enzyme(s) based on tentative GU assignment (see Table 1).
- Digestion: Incubate glycan with enzyme (typically 2-10 mU) in a total volume of 5-10 µL for 4-18 hours at 37°C.
- Enzyme Inactivation: Heat the reaction at 70°C for 10 minutes.
- Analysis: Inject the entire digest onto the HILIC-UPLC system under identical conditions to the initial profile.
- Interpretation: Identify the product peak(s) and note the ΔGU. A specific ΔGU confirms the presence and linkage of the cleaved monosaccharide.
5. Data Interpretation: Quantitative GU Shift Tables
Table 1: Characteristic GU Shifts (ΔGU) for Common Exoglycosidases on 2-AB Labeled N-Glycans
| Exoglycosidase | Specificity | Typical GU Shift (ΔGU) | Structural Confirmation Provided |
|---|---|---|---|
| Arthrobacter ureafaciens Sialidase (ABS) | α2-3,6,8,9 Neu5Ac/Gc | -0.8 to -1.2 per sialic acid | Presence and number of α2-3/6 linked sialic acids. |
| Streptococcus pneumoniae Sialidase (SPG) | α2-3 Neu5Ac > α2-6 | -0.8 to -1.0 | Specificity for α2-3 linked sialic acid. |
| β1-4 Galactosidase (BTG) | β1-4 Gal | -0.5 to -0.6 | Confirms terminal β1-4 galactose (e.g., LacNAc unit). |
| β-N-Acetylglucosaminidase (GUH) | β1-2,4,6 GlcNAc | -0.3 to -0.5 | Removal of β-GlcNAc, e.g., from bisecting GlcNAc (β1-4) or antenna. |
| α1-2,3,6 Mannosidase (JBH) | α1-2,3,6 Man | -0.2 to -0.4 | Trimming of mannose arms on hybrid/oligomannose structures. |
| α1-2 Mannosidase (AM) | α1-2 Man | -0.2 | Specific removal of terminal α1-2 mannose. |
Table 2: Example Sequencing Logic for a Complex Bianternary N-Glycan
| Step | Enzyme Used | Observed Product GU | ΔGU | Interpretation |
|---|---|---|---|---|
| 1 | Initial Profile | 8.50 | - | Tentative: A2G2S2 (disialylated, biantennary) |
| 2 | ABS (Broad Sialidase) | 7.45 | -1.05 | Confirms two α2-3/6 linked sialic acids removed. |
| 3 | BTG (β1-4 Galactosidase) | 6.40 | -1.05 (~2x -0.525) | Confirms two terminal β1-4 galactose residues. |
| 4 | GUH (β-GlcNAcase) | 5.95 | -0.45 | Confirms one terminal β-GlcNAc removed (likely core α1-6 arm). |
| 5 | JBH (α1-2,3,6 Mannosidase) | 5.40 | -0.55 | Trims mannose core, final structure confirmed. |
6. Visualizing the Integrated Workflow
HILIC-Exoglycosidase Sequencing Workflow
7. Advanced Applications & Considerations
Integration with MS: This workflow is highly complementary to LC-MS. GU values provide retention time validation for MS-based compositions, while exoglycosidase data confirms linkages MS struggles to define. Multiplexing: Strategically chosen enzyme arrays can be used in parallel to deconvolute complex glycan pools. Quantification: The peak area change before and after digestion can be used to quantify the proportion of glycans susceptible to a specific enzyme, providing linkage-specific quantitative data.
8. Conclusion
The systematic integration of HILIC profiling with exoglycosidase sequencing creates a powerful, orthogonal framework for definitive glycan structural confirmation. This approach leverages the high-resolution separation and reproducibility of HILIC-UPLC with the absolute linkage specificity of enzymatic digestion, addressing a core limitation in glycomics. For researchers employing a HILIC-UPLC workflow for released glycans, exoglycosidase sequencing is an indispensable next step for moving from putative identification to validated structural characterization, a necessity in biopharmaceutical development and functional glycomics.
Conclusion
The HILIC-UPLC workflow for released and fluorescently labelled glycans represents a robust, reproducible, and high-throughput pillar of modern glycomic analysis. By mastering the foundational principles, meticulous methodology, and optimization strategies outlined, researchers can achieve exceptional resolution and reliability in glycan profiling, essential for critical tasks like biotherapeutic characterization and discovering clinically relevant glycan biomarkers. Future directions point toward increased automation, integration with mass spectrometry for unambiguous structural assignment, and the development of standardized libraries and databases to fully harness the clinical potential of glycomics in personalized medicine and next-generation biologics development.